4.3 Dilation and Composition
•
0 likes•718 views
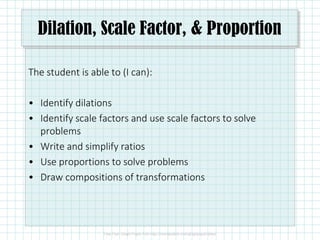
Identify dilations Identify scale factors and solve proportions Draw compositions of transformations
Report
Share
Report
Share
Download to read offline

Recommended
3.9.1 Dilation, Scale Factor, and Proportion
Identify dilations
Identify scale factors and use scale factors to solve problems
Write and simplify ratios
Use proportions to solve problems
Partial fraction
Partial Fraction, Advance Algebra, first-year college Mathematics, Bachelor of Secondary Mathematics Education
Business statistics homework help service
This document provides information about a business statistics homework help service and examples of how to solve common business statistics problems. It discusses shifting trend origins and converting trend equations between different time periods, such as annual, monthly, and quarterly. Customers can contact the statistics help desk for homework assistance via phone, email, social media, or their blog.
Dwp08 0106
This document discusses various types of graphical transformations, including translations, reflections, stretches, and shrinks. It provides examples of how to write the equation of a graph that has undergone one or more of these transformations. Combining transformations in a specific order is also demonstrated. Studying transformations helps understand relationships between graphs that are similar but not identical.
5.5 Point Slope and Standard Form
This document provides instructions for students to complete algebra warm up problems involving graphing lines from equations. It outlines three methods for graphing lines: using the slope and y-intercept, using a T-chart, and manipulating equations into slope-intercept form. Students are informed they will be tested on using both the slope-intercept method and the T-chart method for graphing lines from equations. They are also told they will need to learn how to manipulate equations in standard form and point-slope form into slope-intercept form.
My favorite online teaching tool
1. A linear regression model was estimated to relate the number of cars sold (dependent variable) to the number of TV ads (independent variable) based on weekly data from 5 weeks.
2. The regression results show that the number of TV ads has a statistically significant impact on car sales based on the F-test and t-tests.
3. The estimated regression equation found that for every additional TV ad, car sales are predicted to increase by 5 units on average, with an intercept of 10 cars sold even without any TV ads.
Forecasting
The document discusses various forecasting techniques including covariance, correlation coefficients, scatter plots, and linear regression. It defines covariance and correlation, and how they measure the strength and direction of relationships between variables. Linear regression finds the linear trend line that best fits the data using the method of least squares to calculate the slope (a) and y-intercept (b) values. Time series analysis can also use linear regression to model a linear trend over time and make forecasts by extending the trend line into the future.
Chapter 1.4 Opposites, Integers & Absolute Value
The document provides an agenda for an October 28 math class. It includes a do now, homework check on integers and absolute value using a Frayer model vocabulary template, and homework assignments from a pre-algebra textbook. Expressions are categorized as variable expressions, numerical expressions, or variables. Ways to write multiplication and division are demonstrated, along with examples of evaluating variable expressions by substituting values for variables. Vocabulary on evaluating, integers, opposite numbers, and absolute value are defined using Frayer models.
Exploring transformations and parent graphs
The document discusses transformations and parent graphs. It defines transformations as changes to the position, size, or shape of a figure. Specific transformations covered include translation, reflection, and stretches/compressions. Translation slides points in a direction, reflection flips points across an axis, and stretches/compressions change point distances from an axis. The document also introduces common parent graphs like linear, quadratic, and cubic functions and states the learning targets are applying transformations and identifying parent graphs.
Two way anova
This document discusses a two-way analysis of variance (ANOVA) used to analyze sales data from four salespeople over three seasons. It provides the statistical steps to test two hypotheses: 1) whether salespeople differ significantly in performance, and 2) whether seasons differ significantly in sales. The analysis of variance calculations, including sums of squares, degrees of freedom, mean squares, and F-ratios are shown. The results found no significant difference between salespeople or seasons, so both null hypotheses were accepted.
3.8.1 Dilations and Scale Factor
The document defines and provides examples of dilations and scale factors. It explains that a dilation changes the size but not the shape of a figure. The scale factor is the ratio of the image to the preimage, where a scale factor greater than 1 enlarges the figure and less than 1 shrinks it. Examples are given of finding scale factors, determining new dimensions after a dilation, finding coordinates of dilated points and vertices, and dilating triangles and other figures centered at various points using different scale factors.
Slopepowerpoint
Slope is a measure of steepness that represents the rate of change between two points on a line. It is commonly represented by the letter m. The formula for calculating slope given two points (x1, y1) and (x2, y2) is m = (y2 - y1) / (x2 - x1). Slope can be found from an equation by rewriting it in slope-intercept (y = mx + b) or standard (Ax + By = C) form and calculating m as -A/B. Slope can also be determined graphically by calculating the rise over run between two points.
1.3.2C Equations of Lines
* Find the slope of a line.
* Use slopes to identify parallel and perpendicular lines.
* Write the equation of a line through a given point
- parallel to a given line
- perpendicular to a given line
Using Formulae Ppp Spm 2009 Ppsx
This document provides formulas and examples for various topics in mathematics including algebra, geometry, calculus, trigonometry, and statistics. It lists formulas for quadratic equations, indices, logarithms, arithmetic and geometric progressions, coordinate geometry concepts like distance between points and midpoint, differentiation, integration, vectors, and trigonometric functions. Examples are given for solving simultaneous equations using a calculator, finding the area of a triangle, calculating mean and standard deviation, and solving trigonometric equations. The document is intended as a quick reference guide for mathematical formulas and calculations.
Slope power point grade 8
Slope measures the steepness of a line and is calculated as the rise over the run between two points on the line. Slope is defined as the change in the y-values divided by the change in the x-values and is represented by the letter m. A line's slope does not change based on the two points used in the calculation. Vertical lines have undefined slopes, horizontal lines have a slope of zero, and all other non-vertical lines have a constant slope that can be found graphically, using a table, or using two points on the line.
Anova (short cut method)
1) The document discusses two examples of one-way and two-way ANOVA. In the first example, ANOVA is used to analyze test score data from four schools to determine if there are significant differences in performance between the schools. The F-value calculated is less than the critical value, so there are no significant differences.
2) The second example uses two-way ANOVA to analyze sales data from four salespeople across three seasons. ANOVA indicates there are no significant differences in performance between salespeople or across seasons, as the calculated F-values are less than the critical values.
3) In both examples, ANOVA is used to test the hypothesis that samples come from the same population by comparing the mean squares between
Gradients and angles
The document discusses the relationship between the gradient of a line and the angle it makes with the x-axis. Specifically:
- The gradient (m) of a line is equal to the tangent of the angle (θ) it makes with the x-axis, or m = tanθ.
- Examples are provided to demonstrate calculating the gradient given the angle, and calculating the angle given the gradient or two points on the line.
- When taking the inverse tangent (tan-1) to find the angle from a negative gradient, there are two possible angles that are either in Quadrant II or Quadrant IV of the unit circle.
Standard form solve equations
The document discusses standard form for linear equations and provides examples of converting equations to standard form. It also discusses writing equations of lines given different forms, including slope-intercept form, standard form, and point-slope form. Steps are provided for solving two-step equations by using the opposite operations to isolate the variable. Examples demonstrate converting equations to standard form, writing equations given the slope and y-intercept or two points, and solving a two-step equation.
Introduction to slope presentation
This document defines slope and provides examples for teaching students about slope. It explains that slope is the ratio of vertical to horizontal change and can be positive, negative, zero, or undefined. The objectives are for students to identify slope from graphs, calculate slope using rise over run, and apply the slope formula to find slope given two points. Examples are provided to demonstrate calculating slope from graphs and points using rise over run and the slope formula.
Introduction to engineering maths
This document provides an introduction and overview of key concepts in mathematics that are important for engineering, including algebra, geometry, trigonometry, and calculus. It defines each area of math and outlines prerequisites. Algebra concepts like properties of equality, exponents, polynomials, and solving equations are explained. The document also covers lines and their standard form, noting that slope indicates whether a line rises or falls and what a zero slope represents. The overall goal is to help students understand what each math concept involves and how they are applied in engineering problems.
The gradient formula
The document discusses gradients and the gradient formula. It provides examples of calculating gradients between two points and identifying properties of gradients such as positive gradients going uphill and negative gradients going downhill. It then discusses applications of gradients including using equal gradients to prove that two lines are parallel and using equal gradients between three points to show they are collinear, or located on the same straight line.
Slope
The document discusses slope and how to calculate it. It defines slope as the rate of change of a line and provides the formula slope=rise/run. It then explains how to find the slope of a line graph by picking two points and calculating rise over run. Finally, it demonstrates how to find the slope of a line given two points or from a table of x-y values using the same rise over run formula.
3009 review day
1. The document provides instructions for a geometry drill to complete individually without talking.
2. It contains geometry problems involving angle measures, parallel lines, and a two-column proof to complete.
3. Students are to show the work and reasoning for finding missing angle measures, identifying parallelism theorems/postulates, writing and solving inequalities, and finishing the proof.
9702 w01 ms_3
This document outlines a marking scheme for an AS level physics practical exam involving measuring the radius of a circular card. It includes six measurement marks, two presentation marks, four graphical work marks, and five analysis marks. Key points that were measured include the diameter of the card, position of the center point, radius with uncertainty, and distance from center for various angle readings. The radius was then determined graphically by plotting angle readings against distances and finding the gradient.
Graphing linear equations
There are three main forms for writing linear equations: slope-intercept form (y=mx+b), point-slope form (y-y1=m(x-x1)), and standard form (Ax + By = C). Each form can be used to graph the line by finding ordered pairs that satisfy the equation and plotting those points. For slope-intercept form, a table of x-values with their corresponding y-values is made to find the points. For point-slope form and standard form, the given point and slope or intercepts are used to find another point which are then plotted and connected with a line.
Factoring Activity 3.09
The document discusses various factoring techniques including:
1) Finding the greatest common factor (GCF) to factor trinomials like 3x^3 + 27x^2 + 9x.
2) Factoring the difference of squares using the formula a2 - b2 = (a - b)(a + b).
3) Factoring trinomials by finding two numbers that multiply to the last term and sum to the coefficient of the middle term.
4) Factoring by grouping when there is no GCF between terms.
5) Using the formulas to factor the sum and difference of cubes.
3.9.1 Dilation, Scale Factor, and Proportion
- Identify dilations and scale factors and use them to solve problems
- Write and simplify ratios and use proportions to solve problems
- Key concepts covered include: dilations, scale factors, ratios, proportions, and using them to solve problems involving transformations and ratios of quantities
7.2 Similar Polygons
The student is able to identify scale factors and use them to solve problems involving similar polygons. Scale factors allow comparison of corresponding side lengths of similar polygons through proportions. To determine if two polygons are similar, their corresponding angles must be congruent and side lengths must be proportional as shown through equal ratios.
Linear equations inequalities and applications
This document provides information about chapter 2 of a math textbook. It covers linear equations, formulas, and applications. Section 2-1 discusses solving linear equations, including using properties of equality and identifying conditional, identity, and contradictory equations. Section 2-2 introduces formulas and how to solve them for a specified variable. Section 2-3 explains how to translate words to mathematical expressions and equations, and how to solve applied problems using a six step process. An example at the end solves a word problem about baseball players' home run totals.
Geometry unit 7.1
This document discusses ratios, proportions, and their applications. It begins with examples of writing and using ratios to compare numbers. It then explains that a proportion is an equation stating that two ratios are equal, and introduces the cross products property for solving proportions. Several examples demonstrate solving proportions and using them to solve real-world problems involving scale drawings.
More Related Content
What's hot
Exploring transformations and parent graphs
The document discusses transformations and parent graphs. It defines transformations as changes to the position, size, or shape of a figure. Specific transformations covered include translation, reflection, and stretches/compressions. Translation slides points in a direction, reflection flips points across an axis, and stretches/compressions change point distances from an axis. The document also introduces common parent graphs like linear, quadratic, and cubic functions and states the learning targets are applying transformations and identifying parent graphs.
Two way anova
This document discusses a two-way analysis of variance (ANOVA) used to analyze sales data from four salespeople over three seasons. It provides the statistical steps to test two hypotheses: 1) whether salespeople differ significantly in performance, and 2) whether seasons differ significantly in sales. The analysis of variance calculations, including sums of squares, degrees of freedom, mean squares, and F-ratios are shown. The results found no significant difference between salespeople or seasons, so both null hypotheses were accepted.
3.8.1 Dilations and Scale Factor
The document defines and provides examples of dilations and scale factors. It explains that a dilation changes the size but not the shape of a figure. The scale factor is the ratio of the image to the preimage, where a scale factor greater than 1 enlarges the figure and less than 1 shrinks it. Examples are given of finding scale factors, determining new dimensions after a dilation, finding coordinates of dilated points and vertices, and dilating triangles and other figures centered at various points using different scale factors.
Slopepowerpoint
Slope is a measure of steepness that represents the rate of change between two points on a line. It is commonly represented by the letter m. The formula for calculating slope given two points (x1, y1) and (x2, y2) is m = (y2 - y1) / (x2 - x1). Slope can be found from an equation by rewriting it in slope-intercept (y = mx + b) or standard (Ax + By = C) form and calculating m as -A/B. Slope can also be determined graphically by calculating the rise over run between two points.
1.3.2C Equations of Lines
* Find the slope of a line.
* Use slopes to identify parallel and perpendicular lines.
* Write the equation of a line through a given point
- parallel to a given line
- perpendicular to a given line
Using Formulae Ppp Spm 2009 Ppsx
This document provides formulas and examples for various topics in mathematics including algebra, geometry, calculus, trigonometry, and statistics. It lists formulas for quadratic equations, indices, logarithms, arithmetic and geometric progressions, coordinate geometry concepts like distance between points and midpoint, differentiation, integration, vectors, and trigonometric functions. Examples are given for solving simultaneous equations using a calculator, finding the area of a triangle, calculating mean and standard deviation, and solving trigonometric equations. The document is intended as a quick reference guide for mathematical formulas and calculations.
Slope power point grade 8
Slope measures the steepness of a line and is calculated as the rise over the run between two points on the line. Slope is defined as the change in the y-values divided by the change in the x-values and is represented by the letter m. A line's slope does not change based on the two points used in the calculation. Vertical lines have undefined slopes, horizontal lines have a slope of zero, and all other non-vertical lines have a constant slope that can be found graphically, using a table, or using two points on the line.
Anova (short cut method)
1) The document discusses two examples of one-way and two-way ANOVA. In the first example, ANOVA is used to analyze test score data from four schools to determine if there are significant differences in performance between the schools. The F-value calculated is less than the critical value, so there are no significant differences.
2) The second example uses two-way ANOVA to analyze sales data from four salespeople across three seasons. ANOVA indicates there are no significant differences in performance between salespeople or across seasons, as the calculated F-values are less than the critical values.
3) In both examples, ANOVA is used to test the hypothesis that samples come from the same population by comparing the mean squares between
Gradients and angles
The document discusses the relationship between the gradient of a line and the angle it makes with the x-axis. Specifically:
- The gradient (m) of a line is equal to the tangent of the angle (θ) it makes with the x-axis, or m = tanθ.
- Examples are provided to demonstrate calculating the gradient given the angle, and calculating the angle given the gradient or two points on the line.
- When taking the inverse tangent (tan-1) to find the angle from a negative gradient, there are two possible angles that are either in Quadrant II or Quadrant IV of the unit circle.
Standard form solve equations
The document discusses standard form for linear equations and provides examples of converting equations to standard form. It also discusses writing equations of lines given different forms, including slope-intercept form, standard form, and point-slope form. Steps are provided for solving two-step equations by using the opposite operations to isolate the variable. Examples demonstrate converting equations to standard form, writing equations given the slope and y-intercept or two points, and solving a two-step equation.
Introduction to slope presentation
This document defines slope and provides examples for teaching students about slope. It explains that slope is the ratio of vertical to horizontal change and can be positive, negative, zero, or undefined. The objectives are for students to identify slope from graphs, calculate slope using rise over run, and apply the slope formula to find slope given two points. Examples are provided to demonstrate calculating slope from graphs and points using rise over run and the slope formula.
Introduction to engineering maths
This document provides an introduction and overview of key concepts in mathematics that are important for engineering, including algebra, geometry, trigonometry, and calculus. It defines each area of math and outlines prerequisites. Algebra concepts like properties of equality, exponents, polynomials, and solving equations are explained. The document also covers lines and their standard form, noting that slope indicates whether a line rises or falls and what a zero slope represents. The overall goal is to help students understand what each math concept involves and how they are applied in engineering problems.
The gradient formula
The document discusses gradients and the gradient formula. It provides examples of calculating gradients between two points and identifying properties of gradients such as positive gradients going uphill and negative gradients going downhill. It then discusses applications of gradients including using equal gradients to prove that two lines are parallel and using equal gradients between three points to show they are collinear, or located on the same straight line.
Slope
The document discusses slope and how to calculate it. It defines slope as the rate of change of a line and provides the formula slope=rise/run. It then explains how to find the slope of a line graph by picking two points and calculating rise over run. Finally, it demonstrates how to find the slope of a line given two points or from a table of x-y values using the same rise over run formula.
3009 review day
1. The document provides instructions for a geometry drill to complete individually without talking.
2. It contains geometry problems involving angle measures, parallel lines, and a two-column proof to complete.
3. Students are to show the work and reasoning for finding missing angle measures, identifying parallelism theorems/postulates, writing and solving inequalities, and finishing the proof.
9702 w01 ms_3
This document outlines a marking scheme for an AS level physics practical exam involving measuring the radius of a circular card. It includes six measurement marks, two presentation marks, four graphical work marks, and five analysis marks. Key points that were measured include the diameter of the card, position of the center point, radius with uncertainty, and distance from center for various angle readings. The radius was then determined graphically by plotting angle readings against distances and finding the gradient.
Graphing linear equations
There are three main forms for writing linear equations: slope-intercept form (y=mx+b), point-slope form (y-y1=m(x-x1)), and standard form (Ax + By = C). Each form can be used to graph the line by finding ordered pairs that satisfy the equation and plotting those points. For slope-intercept form, a table of x-values with their corresponding y-values is made to find the points. For point-slope form and standard form, the given point and slope or intercepts are used to find another point which are then plotted and connected with a line.
Factoring Activity 3.09
The document discusses various factoring techniques including:
1) Finding the greatest common factor (GCF) to factor trinomials like 3x^3 + 27x^2 + 9x.
2) Factoring the difference of squares using the formula a2 - b2 = (a - b)(a + b).
3) Factoring trinomials by finding two numbers that multiply to the last term and sum to the coefficient of the middle term.
4) Factoring by grouping when there is no GCF between terms.
5) Using the formulas to factor the sum and difference of cubes.
What's hot (18)
Similar to 4.3 Dilation and Composition
3.9.1 Dilation, Scale Factor, and Proportion
- Identify dilations and scale factors and use them to solve problems
- Write and simplify ratios and use proportions to solve problems
- Key concepts covered include: dilations, scale factors, ratios, proportions, and using them to solve problems involving transformations and ratios of quantities
7.2 Similar Polygons
The student is able to identify scale factors and use them to solve problems involving similar polygons. Scale factors allow comparison of corresponding side lengths of similar polygons through proportions. To determine if two polygons are similar, their corresponding angles must be congruent and side lengths must be proportional as shown through equal ratios.
Linear equations inequalities and applications
This document provides information about chapter 2 of a math textbook. It covers linear equations, formulas, and applications. Section 2-1 discusses solving linear equations, including using properties of equality and identifying conditional, identity, and contradictory equations. Section 2-2 introduces formulas and how to solve them for a specified variable. Section 2-3 explains how to translate words to mathematical expressions and equations, and how to solve applied problems using a six step process. An example at the end solves a word problem about baseball players' home run totals.
Geometry unit 7.1
This document discusses ratios, proportions, and their applications. It begins with examples of writing and using ratios to compare numbers. It then explains that a proportion is an equation stating that two ratios are equal, and introduces the cross products property for solving proportions. Several examples demonstrate solving proportions and using them to solve real-world problems involving scale drawings.
Dilations edmodo 2013 14
This document introduces dilations by defining them as a type of transformation where a figure stretches or shrinks with respect to a fixed point. It explains that dilations use a scale factor, where a scale factor greater than 1 makes the figure larger (stretch) and a scale factor between 0-1 makes the figure smaller (shrink). The document provides examples of how to calculate new dimensions of a figure after dilating it using different scale factors. It also explains that dilations have a center of dilation, so that corresponding vertices of the original and dilated figures lie on the same line from the center. Examples are given to practice dilating shapes using different scale factors with the origin as the center of dilation.
Algebraic expressions
The document defines key concepts in algebraic expressions including:
- Terms, coefficients, like terms and unlike terms
- Types of expressions including monomials, binomials, trinomials and polynomials
- How to combine like terms and simplify expressions
- Using variables to represent unknown numbers and writing expressions to describe word problems mathematically
The document also provides examples demonstrating how to identify terms, coefficients, like and unlike terms in expressions, how to simplify expressions by combining like terms, and how to evaluate expressions by substituting values for variables.
IVS-B UNIT-1_merged. Semester 2 fundamental of sciencepdf
Unit-1 covers topics related to error analysis, graphing, and logarithms. It discusses types of errors, propagation of errors through addition, subtraction, multiplication, division, and powers. It also defines standard deviation and provides examples of calculating it. Graphing concepts like dependent and independent variables, linear and nonlinear functions, and plotting graphs from equations are explained. Logarithm rules and properties are also introduced.
ALGEBRA (3).pptx
Algebra is the use of symbols to represent values and their relationships. Key concepts in algebra include:
- Variables represent unknown values and are often represented by letters.
- Polynomials are expressions involving variables and coefficients with addition, subtraction, multiplication, and non-negative exponents.
- The degree of a polynomial refers to the highest exponent on any term.
- Important algebraic operations include addition, subtraction, multiplication, and factorization of polynomials.
- Systems of linear equations can be solved using several methods like substitution, elimination, and cross-multiplication. The consistency of the system determines if there is a unique solution, infinite solutions, or no solution.
P R E L I M R E V I S I O N U N I T 1
The document provides instructions and worked examples for solving various math problems involving straight lines, composite functions, limits of recurrence relations, trigonometric equations, graphs of functions, and finding maximums and minimums. It includes step-by-step workings for finding the equation of a line, angle between two points, perpendicular bisector of a line, composite functions, limits of recurrence relations, solving trig equations, sketching transformed graphs, and minimizing cost functions.
Fst ch3 notes
The document discusses various mathematical concepts related to functions and graphs including:
1) Transformations of graphs such as translations, reflections, and rotations. It also discusses parent functions and their derivatives.
2) Examples of graphing functions after applying transformations to translate, scale, or reflect the original graphs. Equations are provided for the transformed graphs.
3) Theorems related to how statistics of data change after translations or scale changes. For example, the mean, median and mode change proportionally but variance, standard deviation, and range change in specific ways.
4) Concepts involving inverse functions, including using the horizontal line test to determine if an inverse is a function and notations for inverse functions
Quadratic equations
This document discusses quadratic equations and methods for solving them. It begins by defining quadratic equations as second degree polynomial equations of the form ax^2 + bx + c = 0, where a is not equal to 0. It then presents several methods for finding the roots or solutions of quadratic equations: factoring, completing the square, and using the quadratic formula. Examples are provided to illustrate each method. The document also discusses graphing quadratic functions and key features of parabolas such as vertex, axis of symmetry, and direction of opening.
stats_ch12.pdf
This document discusses correlation and regression analysis. It begins by outlining the chapter's objectives and providing an introduction to investigating relationships between variables using statistical analysis. The document then presents examples of collecting data to study potential relationships between variables like stone dimensions, human heights and weights, and sprint and long jump performances. It introduces various statistical measures for quantifying relationships in data, including covariance, Pearson's product moment correlation coefficient, and Spearman's rank correlation coefficient. Examples are provided to demonstrate calculating and interpreting these statistics. Limitations of correlation analysis are also noted.
Advance algebra
The document provides steps and examples for solving various types of word problems in algebra, including number, mixture, rate/time/distance, work, coin, and geometric problems. It also covers solving quadratic equations using methods like the square root property, completing the square, quadratic formula, factoring, and using the discriminant. Finally, it discusses linear inequalities, including properties related to addition, multiplication, division, and subtraction of inequalities.
3.8.2 Ratio and Proportion
Ratios and proportions can be used to solve problems involving comparisons of quantities. A ratio compares two numbers using division, while a proportion states that two ratios are equal. To solve proportions, the cross product property is used, setting up equivalent fractions and solving with cross multiplication. Similar polygons have corresponding angles that are congruent and side lengths that are proportional, allowing their similarities to be described through statements listing corresponding vertices.
Hprec2 5
This document provides an overview of solving inequalities, including:
1) The principles for solving inequalities are similar to equations but the direction of the inequality changes when multiplying or dividing by a negative number.
2) Interval notation is used to represent the solutions of inequalities on the number line.
3) To solve inequalities, determine the zeros of the function and where the graph is above or below the x-axis to identify the intervals of solutions.
Basic Math
This document defines key mathematical terms related to subsets, properties, ratios, proportions, percentages, and interest. It includes:
- Definitions of natural numbers, whole numbers, and integers as subsets of numbers
- Explanations of closure, commutative, associative, and identity properties
- How to calculate ratios, rates, and use proportions
- Conversions between decimals, fractions, and percentages
- A formula for calculating simple interest (I=PRT) and an example using it
The document provides concise explanations and examples of fundamental mathematical concepts.
Vivek
The document provides an introduction to the binomial theorem. It defines binomial coefficients through the Pascal triangle and gives an explicit formula for computing them using factorials. The binomial theorem is then derived and stated, providing a formula for expanding expressions of the form (a + b)^n in terms of binomial coefficients. Several examples are worked out to demonstrate expanding expressions and finding coefficients using the binomial theorem. Applications to estimating interest calculations are also briefly discussed.
Solving Literal Equations
The document discusses solving literal equations by isolating variables. It defines literal equations as equations with more than one variable. The rules for solving literal equations are: 1) simplify each side if needed, 2) move the variable being solved for to one side using the opposite operation, 3) isolate the variable being solved for by applying the opposite operation to each side. Examples are provided of solving for different variables in equations and formulas. Practice problems are given at the end to solve for specific variables.
Precalculus 1 chapter 1
Please watch the video discussion on my YouTube channel. sample exercises was solved in the videos.
https://youtu.be/nGh8y9b8sMs
ICSE Mathematics Formulae Sheet
The document provides a list of formulae for the ICSE Mathematics (Class 10) exam. It covers topics like commercial arithmetic, algebra, coordinate geometry, geometry, mensuration, trigonometry, and statistics. For each topic, relevant formulae are listed along with explanations. The exam will have one 2-hour paper divided into two sections carrying 80 marks total. Section I will consist of short answer questions and Section II will require answering 4 out of 7 questions.
Similar to 4.3 Dilation and Composition (20)
IVS-B UNIT-1_merged. Semester 2 fundamental of sciencepdf
IVS-B UNIT-1_merged. Semester 2 fundamental of sciencepdf
More from smiller5
6.7 Exponential and Logarithmic Models
* Model exponential growth and decay
* Use Newton's Law of Cooling
* Use logistic-growth models
* Choose an appropriate model for data
* Express an exponential model in base e
4.5 Special Segments in Triangles
* Construct perpendicular and angle bisectors
* Use bisectors to solve problems
* Identify the circumcenter and incenter of a triangle
* Use triangle segments to solve problems
1.4 Conditional Statements
* Identify, write, and analyze conditional statements
* Write the inverse, converse, and contrapositive of a conditional statement
* Write a counterexample to a fake conjecture
1.3 Distance and Midpoint Formulas
* Find the distance between two points
* Find the midpoint of two given points
* Find the coordinates of an endpoint given one endpoint and a midpoint
* Find the coordinates of a point a fractional distance from one end of a segment
1.5 Quadratic Equations.pdf
This document provides instruction on factoring polynomials and quadratic equations. It begins by reviewing factoring techniques like finding the greatest common factor and factoring trinomials and binomials. Examples are provided to demonstrate the factoring methods. The document then discusses solving quadratic equations by factoring, putting the equation in standard form, and setting each factor equal to zero. An example problem demonstrates solving a quadratic equation through factoring. The document concludes by assigning homework and an optional reading for the next class.
3.2 Graphs of Functions
* Connect functions to their graphs
* Graph piecewise-defined functions
* Graph absolute value functions
* Graph greatest-integer functions
* Interpret graphs
* Use the vertical line test to determine a function
3.2 Graphs of Functions
* Connect functions to their graphs
* Graph piecewise-defined functions
* Graph absolute value functions
* Graph greatest-integer functions
* Interpret graphs
* Use the vertical line test to determine a function
3.1 Functions
* Introduce functions and function notation
* Develop skills in constructing and interpreting the graphs of functions
* Learn to apply this knowledge in a variety of situations
2.5 Transformations of Functions
* Recognize graphs of common functions.
* Graph functions using vertical and horizontal shifts.
* Graph functions using reflections about the x-axis and the y-axis.
* Graph functions using compressions and stretches.
* Combine transformations.
2.2 More on Functions and Their Graphs
This document discusses functions and their graphs. It defines increasing, decreasing and constant functions based on how the function values change as the input increases. Relative maxima and minima are points where a function changes from increasing to decreasing. Symmetry of functions is classified by the y-axis, x-axis and origin. Even functions are symmetric about the y-axis, odd functions are symmetric about the origin. Piecewise functions have different definitions over different intervals.
1.6 Other Types of Equations
This document provides examples and steps for solving various types of equations beyond linear equations, including:
1) Polynomial equations solved by factoring
2) Equations with radicals where radicals are eliminated by raising both sides to a power
3) Equations with rational exponents where both sides are raised to the reciprocal power
4) Equations quadratic in form where an algebraic substitution is made to transform into a quadratic equation
5) Absolute value equations where both positive and negative solutions must be considered.
1.5 Quadratic Equations (Review)
This document provides instruction on factoring quadratic equations. It begins by reviewing factoring polynomials and trinomials. It then discusses factoring binomials using difference of squares, sum/difference of cubes, and other patterns. Finally, it explains that a quadratic equation can be solved by factoring if it can be written as a product of two linear factors. An example demonstrates factoring a quadratic equation by finding the two values that make each factor equal to zero.
2.1 Basics of Functions and Their Graphs
This document provides an overview of functions and their graphs. It defines what constitutes a function, discusses domain and range, and how to identify functions using the vertical line test. Key points covered include:
- A function is a relation where each input has a single, unique output
- The domain is the set of inputs and the range is the set of outputs
- Functions can be represented by ordered pairs, graphs, or equations
- The vertical line test identifies functions as those where a vertical line intersects the graph at most once
- Intercepts occur where the graph crosses the x or y-axis
9.6 Binomial Theorem
The document discusses the binomial theorem, which provides a formula for expanding binomial expressions of the form (a + b)^n. It gives the formula for finding the coefficient of the term containing b^r as nCr. Several examples are worked out applying the binomial theorem to expand binomial expressions and find specific terms. Factorial notation is introduced for writing the coefficients. The document also discusses using calculators and Desmos to evaluate binomial coefficients. Practice problems are assigned from previous sections.
13.3 Venn Diagrams & Two-Way Tables
The document discusses using Venn diagrams and two-way tables to organize data and calculate probabilities. It provides examples of completing Venn diagrams and two-way tables based on survey data about students' activities. It then uses the tables and diagrams to calculate probabilities of different outcomes. The examples illustrate how to set up and use these visual representations of categorical data.
13.2 Independent & Dependent Events
* Identify events as independent or dependent
* Calculate the probabilities of independent and dependent events
9.5 Counting Principles
* Solve counting problems using the Addition Principle.
* Solve counting problems using the Multiplication Principle.
* Solve counting problems using permutations involving n distinct objects.
* Solve counting problems using combinations.
* Find the number of subsets of a given set.
* Solve counting problems using permutations involving n non-distinct objects.
13.1 Geometric Probability
* Calculate geometric probabilities
* Use geometric probability to predict results in real world situations.
9.4 Series and Their Notations
* Use summation notation.
* Use the formula for the sum of the first n terms of an arithmetic series.
* Use the formula for the sum of the first n terms of a geometric series.
* Use the formula for the sum of an infinite geometric series.
* Solve annuity problems.
9.3 Geometric Sequences
* Find the common ratio for a geometric sequence.
* List the terms of a geometric sequence.
* Use a recursive formula for a geometric sequence.
* Use an explicit formula for a geometric sequence.
More from smiller5 (20)
Recently uploaded
A Visual Guide to 1 Samuel | A Tale of Two Hearts
These slides walk through the story of 1 Samuel. Samuel is the last judge of Israel. The people reject God and want a king. Saul is anointed as the first king, but he is not a good king. David, the shepherd boy is anointed and Saul is envious of him. David shows honor while Saul continues to self destruct.
Mule event processing models | MuleSoft Mysore Meetup #47
Mule event processing models | MuleSoft Mysore Meetup #47
Event Link:- https://meetups.mulesoft.com/events/details/mulesoft-mysore-presents-mule-event-processing-models/
Agenda
● What is event processing in MuleSoft?
● Types of event processing models in Mule 4
● Distinction between the reactive, parallel, blocking & non-blocking processing
For Upcoming Meetups Join Mysore Meetup Group - https://meetups.mulesoft.com/mysore/YouTube:- youtube.com/@mulesoftmysore
Mysore WhatsApp group:- https://chat.whatsapp.com/EhqtHtCC75vCAX7gaO842N
Speaker:-
Shivani Yasaswi - https://www.linkedin.com/in/shivaniyasaswi/
Organizers:-
Shubham Chaurasia - https://www.linkedin.com/in/shubhamchaurasia1/
Giridhar Meka - https://www.linkedin.com/in/giridharmeka
Priya Shaw - https://www.linkedin.com/in/priya-shaw
Chapter wise All Notes of First year Basic Civil Engineering.pptx
Chapter wise All Notes of First year Basic Civil Engineering
Syllabus
Chapter-1
Introduction to objective, scope and outcome the subject
Chapter 2
Introduction: Scope and Specialization of Civil Engineering, Role of civil Engineer in Society, Impact of infrastructural development on economy of country.
Chapter 3
Surveying: Object Principles & Types of Surveying; Site Plans, Plans & Maps; Scales & Unit of different Measurements.
Linear Measurements: Instruments used. Linear Measurement by Tape, Ranging out Survey Lines and overcoming Obstructions; Measurements on sloping ground; Tape corrections, conventional symbols. Angular Measurements: Instruments used; Introduction to Compass Surveying, Bearings and Longitude & Latitude of a Line, Introduction to total station.
Levelling: Instrument used Object of levelling, Methods of levelling in brief, and Contour maps.
Chapter 4
Buildings: Selection of site for Buildings, Layout of Building Plan, Types of buildings, Plinth area, carpet area, floor space index, Introduction to building byelaws, concept of sun light & ventilation. Components of Buildings & their functions, Basic concept of R.C.C., Introduction to types of foundation
Chapter 5
Transportation: Introduction to Transportation Engineering; Traffic and Road Safety: Types and Characteristics of Various Modes of Transportation; Various Road Traffic Signs, Causes of Accidents and Road Safety Measures.
Chapter 6
Environmental Engineering: Environmental Pollution, Environmental Acts and Regulations, Functional Concepts of Ecology, Basics of Species, Biodiversity, Ecosystem, Hydrological Cycle; Chemical Cycles: Carbon, Nitrogen & Phosphorus; Energy Flow in Ecosystems.
Water Pollution: Water Quality standards, Introduction to Treatment & Disposal of Waste Water. Reuse and Saving of Water, Rain Water Harvesting. Solid Waste Management: Classification of Solid Waste, Collection, Transportation and Disposal of Solid. Recycling of Solid Waste: Energy Recovery, Sanitary Landfill, On-Site Sanitation. Air & Noise Pollution: Primary and Secondary air pollutants, Harmful effects of Air Pollution, Control of Air Pollution. . Noise Pollution Harmful Effects of noise pollution, control of noise pollution, Global warming & Climate Change, Ozone depletion, Greenhouse effect
Text Books:
1. Palancharmy, Basic Civil Engineering, McGraw Hill publishers.
2. Satheesh Gopi, Basic Civil Engineering, Pearson Publishers.
3. Ketki Rangwala Dalal, Essentials of Civil Engineering, Charotar Publishing House.
4. BCP, Surveying volume 1
Traditional Musical Instruments of Arunachal Pradesh and Uttar Pradesh - RAYH...
Traditional Musical Instruments of Arunachal Pradesh and Uttar Pradesh
BIOLOGY NATIONAL EXAMINATION COUNCIL (NECO) 2024 PRACTICAL MANUAL.pptx
Practical manual for National Examination Council, Nigeria.
Contains guides on answering questions on the specimens provided
Gender and Mental Health - Counselling and Family Therapy Applications and In...
A proprietary approach developed by bringing together the best of learning theories from Psychology, design principles from the world of visualization, and pedagogical methods from over a decade of training experience, that enables you to: Learn better, faster!
Beyond Degrees - Empowering the Workforce in the Context of Skills-First.pptx
Iván Bornacelly, Policy Analyst at the OECD Centre for Skills, OECD, presents at the webinar 'Tackling job market gaps with a skills-first approach' on 12 June 2024
Lifelines of National Economy chapter for Class 10 STUDY MATERIAL PDF
The chapter Lifelines of National Economy in Class 10 Geography focuses on the various modes of transportation and communication that play a vital role in the economic development of a country. These lifelines are crucial for the movement of goods, services, and people, thereby connecting different regions and promoting economic activities.
Stack Memory Organization of 8086 Microprocessor
The stack memory organization of 8086 microprocessor.
How to deliver Powerpoint Presentations.pptx
"How to make and deliver dynamic presentations by making it more interactive to captivate your audience attention"
BÀI TẬP BỔ TRỢ TIẾNG ANH LỚP 9 CẢ NĂM - GLOBAL SUCCESS - NĂM HỌC 2024-2025 - ...
BÀI TẬP BỔ TRỢ TIẾNG ANH LỚP 9 CẢ NĂM - GLOBAL SUCCESS - NĂM HỌC 2024-2025 - ...Nguyen Thanh Tu Collection
https://app.box.com/s/tacvl9ekroe9hqupdnjruiypvm9rdanePhilippine Edukasyong Pantahanan at Pangkabuhayan (EPP) Curriculum
(𝐓𝐋𝐄 𝟏𝟎𝟎) (𝐋𝐞𝐬𝐬𝐨𝐧 𝟏)-𝐏𝐫𝐞𝐥𝐢𝐦𝐬
𝐃𝐢𝐬𝐜𝐮𝐬𝐬 𝐭𝐡𝐞 𝐄𝐏𝐏 𝐂𝐮𝐫𝐫𝐢𝐜𝐮𝐥𝐮𝐦 𝐢𝐧 𝐭𝐡𝐞 𝐏𝐡𝐢𝐥𝐢𝐩𝐩𝐢𝐧𝐞𝐬:
- Understand the goals and objectives of the Edukasyong Pantahanan at Pangkabuhayan (EPP) curriculum, recognizing its importance in fostering practical life skills and values among students. Students will also be able to identify the key components and subjects covered, such as agriculture, home economics, industrial arts, and information and communication technology.
𝐄𝐱𝐩𝐥𝐚𝐢𝐧 𝐭𝐡𝐞 𝐍𝐚𝐭𝐮𝐫𝐞 𝐚𝐧𝐝 𝐒𝐜𝐨𝐩𝐞 𝐨𝐟 𝐚𝐧 𝐄𝐧𝐭𝐫𝐞𝐩𝐫𝐞𝐧𝐞𝐮𝐫:
-Define entrepreneurship, distinguishing it from general business activities by emphasizing its focus on innovation, risk-taking, and value creation. Students will describe the characteristics and traits of successful entrepreneurs, including their roles and responsibilities, and discuss the broader economic and social impacts of entrepreneurial activities on both local and global scales.
BÀI TẬP BỔ TRỢ TIẾNG ANH 8 CẢ NĂM - GLOBAL SUCCESS - NĂM HỌC 2023-2024 (CÓ FI...
BÀI TẬP BỔ TRỢ TIẾNG ANH 8 CẢ NĂM - GLOBAL SUCCESS - NĂM HỌC 2023-2024 (CÓ FI...Nguyen Thanh Tu Collection
https://app.box.com/s/y977uz6bpd3af4qsebv7r9b7s21935vdHYPERTENSION - SLIDE SHARE PRESENTATION.
IT WILL BE HELPFULL FOR THE NUSING STUDENTS
IT FOCUSED ON MEDICAL MANAGEMENT AND NURSING MANAGEMENT.
HIGHLIGHTS ON HEALTH EDUCATION.
Recently uploaded (20)
spot a liar (Haiqa 146).pptx Technical writhing and presentation skills
spot a liar (Haiqa 146).pptx Technical writhing and presentation skills
Mule event processing models | MuleSoft Mysore Meetup #47
Mule event processing models | MuleSoft Mysore Meetup #47
Chapter wise All Notes of First year Basic Civil Engineering.pptx
Chapter wise All Notes of First year Basic Civil Engineering.pptx
Traditional Musical Instruments of Arunachal Pradesh and Uttar Pradesh - RAYH...
Traditional Musical Instruments of Arunachal Pradesh and Uttar Pradesh - RAYH...
BIOLOGY NATIONAL EXAMINATION COUNCIL (NECO) 2024 PRACTICAL MANUAL.pptx
BIOLOGY NATIONAL EXAMINATION COUNCIL (NECO) 2024 PRACTICAL MANUAL.pptx
Gender and Mental Health - Counselling and Family Therapy Applications and In...
Gender and Mental Health - Counselling and Family Therapy Applications and In...
Beyond Degrees - Empowering the Workforce in the Context of Skills-First.pptx
Beyond Degrees - Empowering the Workforce in the Context of Skills-First.pptx
Lifelines of National Economy chapter for Class 10 STUDY MATERIAL PDF
Lifelines of National Economy chapter for Class 10 STUDY MATERIAL PDF
BÀI TẬP BỔ TRỢ TIẾNG ANH LỚP 9 CẢ NĂM - GLOBAL SUCCESS - NĂM HỌC 2024-2025 - ...
BÀI TẬP BỔ TRỢ TIẾNG ANH LỚP 9 CẢ NĂM - GLOBAL SUCCESS - NĂM HỌC 2024-2025 - ...
Film vocab for eal 3 students: Australia the movie
Film vocab for eal 3 students: Australia the movie
Philippine Edukasyong Pantahanan at Pangkabuhayan (EPP) Curriculum
Philippine Edukasyong Pantahanan at Pangkabuhayan (EPP) Curriculum
BÀI TẬP BỔ TRỢ TIẾNG ANH 8 CẢ NĂM - GLOBAL SUCCESS - NĂM HỌC 2023-2024 (CÓ FI...
BÀI TẬP BỔ TRỢ TIẾNG ANH 8 CẢ NĂM - GLOBAL SUCCESS - NĂM HỌC 2023-2024 (CÓ FI...
4.3 Dilation and Composition
- 1. Dilation, Scale Factor, & Proportion The student is able to (I can): • Identify dilations • Identify scale factors and use scale factors to solve• Identify scale factors and use scale factors to solve problems • Write and simplify ratios • Use proportions to solve problems • Draw compositions of transformations
- 2. dilationdilationdilationdilation – a transformation that changes the size of a figure but not the shape. Example: Tell whether each transformation appears to be a dilation. 1. 2. SS yes no
- 3. ratioratioratioratio – a comparison of two numbers by division. The ratio of two numbers a and b, where b does not equal 0 (b ≠ 0) can be written as a to b a : b a b Example: The ratio comparing 1 and 2 can be written 1 to 2, 1 : 2, or . To compare more than two numbers, use “dot” notation. Ex. 3 : 7 : 9 b 1 2
- 4. proportionproportionproportionproportion – an equation stating that two ratios are equal. Two sets of numbers are proportionalproportionalproportionalproportional if they use the same ratio. Example: or a : b = c : d a c b d Cross Products Property In a proportion, if , and b and d ≠ 0, then ad = bc a c b d
- 5. X´´´´ Y´´´´ Z´´´´ P X Y Z center of dilation scalescalescalescale factorfactorfactorfactor – the ratio of the image to the preimage. If k < 1, the figure gets smaller; if k > 1, the figure gets larger. X Y Y Z X Z k XY YZ XZ
- 6. Examples 1. What is the scale factor of the dilation? 10 24 5 12 2. If you are enlarging a 4x6 photo by a scale factor of 4, what are the new dimensions?
- 7. Examples 1. What is the scale factor of the dilation? 10 24 5 12 5 1 12 1 (or ) 10 2 24 2 k k 2. If you are enlarging a 4x6 photo by a scale factor of 4, what are the new dimensions? 4(3) = 12 6(3) = 18 New dimensions = 12x18 10 2 24 2
- 8. Examples Solve each proportion: 1. 2. 3 8 32 x 4 2 5x 3. 2 6 3 x x
- 9. Examples Solve each proportion: 1. 8x = 96 x = 12 2. 2x = 20 x = 10 3 8 32 x 4 2 5x 2x = 20 x = 10 3. 3x = 6(x – 2) 3x = 6x – 12 –3x = –12 x = 4 2 6 3 x x
- 10. Examples 4. The ratio of the angles of a triangle is 2: 2: 5. What is the measure of each angle?
- 11. Examples 4. The ratio of the angles of a triangle is 2: 2: 5. What is the measure of each angle? 2x + 2x + 5x = 180˚ 9x = 180˚ x = 20 220 = 40˚ 220 = 40˚ 520 = 100˚
- 12. composition ofcomposition ofcomposition ofcomposition of transformationstransformationstransformationstransformations – performing two or more transformations sequentially (one after another) to a figure. An example of a composition is a glideglideglideglide reflectionreflectionreflectionreflection: we reflect the figure and then translate it along a vector.
- 13. With most compositions, it is important to perform them in the order given. ReflectReflectReflectReflect across theacross theacross theacross the xxxx----axisaxisaxisaxis and then rotaterotaterotaterotate 90909090. RotateRotateRotateRotate 90909090 and then reflect across thereflect across thereflect across thereflect across the xxxx----axisaxisaxisaxis.
- 14. Examples Graph the transformations 1. (1, 4), (–2, 1), (–4, 1): Translate along the vector 〈–3, 1〉 and then reflect across the y-axis 2. (2, 1), (3, 5), (5, 2): Rotate 180° about the origin and then reflect across the line y = 2
- 15. Examples Graph the transformations 1. (1, 4), (–2, 1), (–4, 1): Translate along the vector 〈–3, 1〉 and then reflect across the y-axis
- 16. Examples Graph the transformations 2. (2, 1), (3, 5), (5, 2): Rotate 180° about the origin and then reflect across the line y = 2