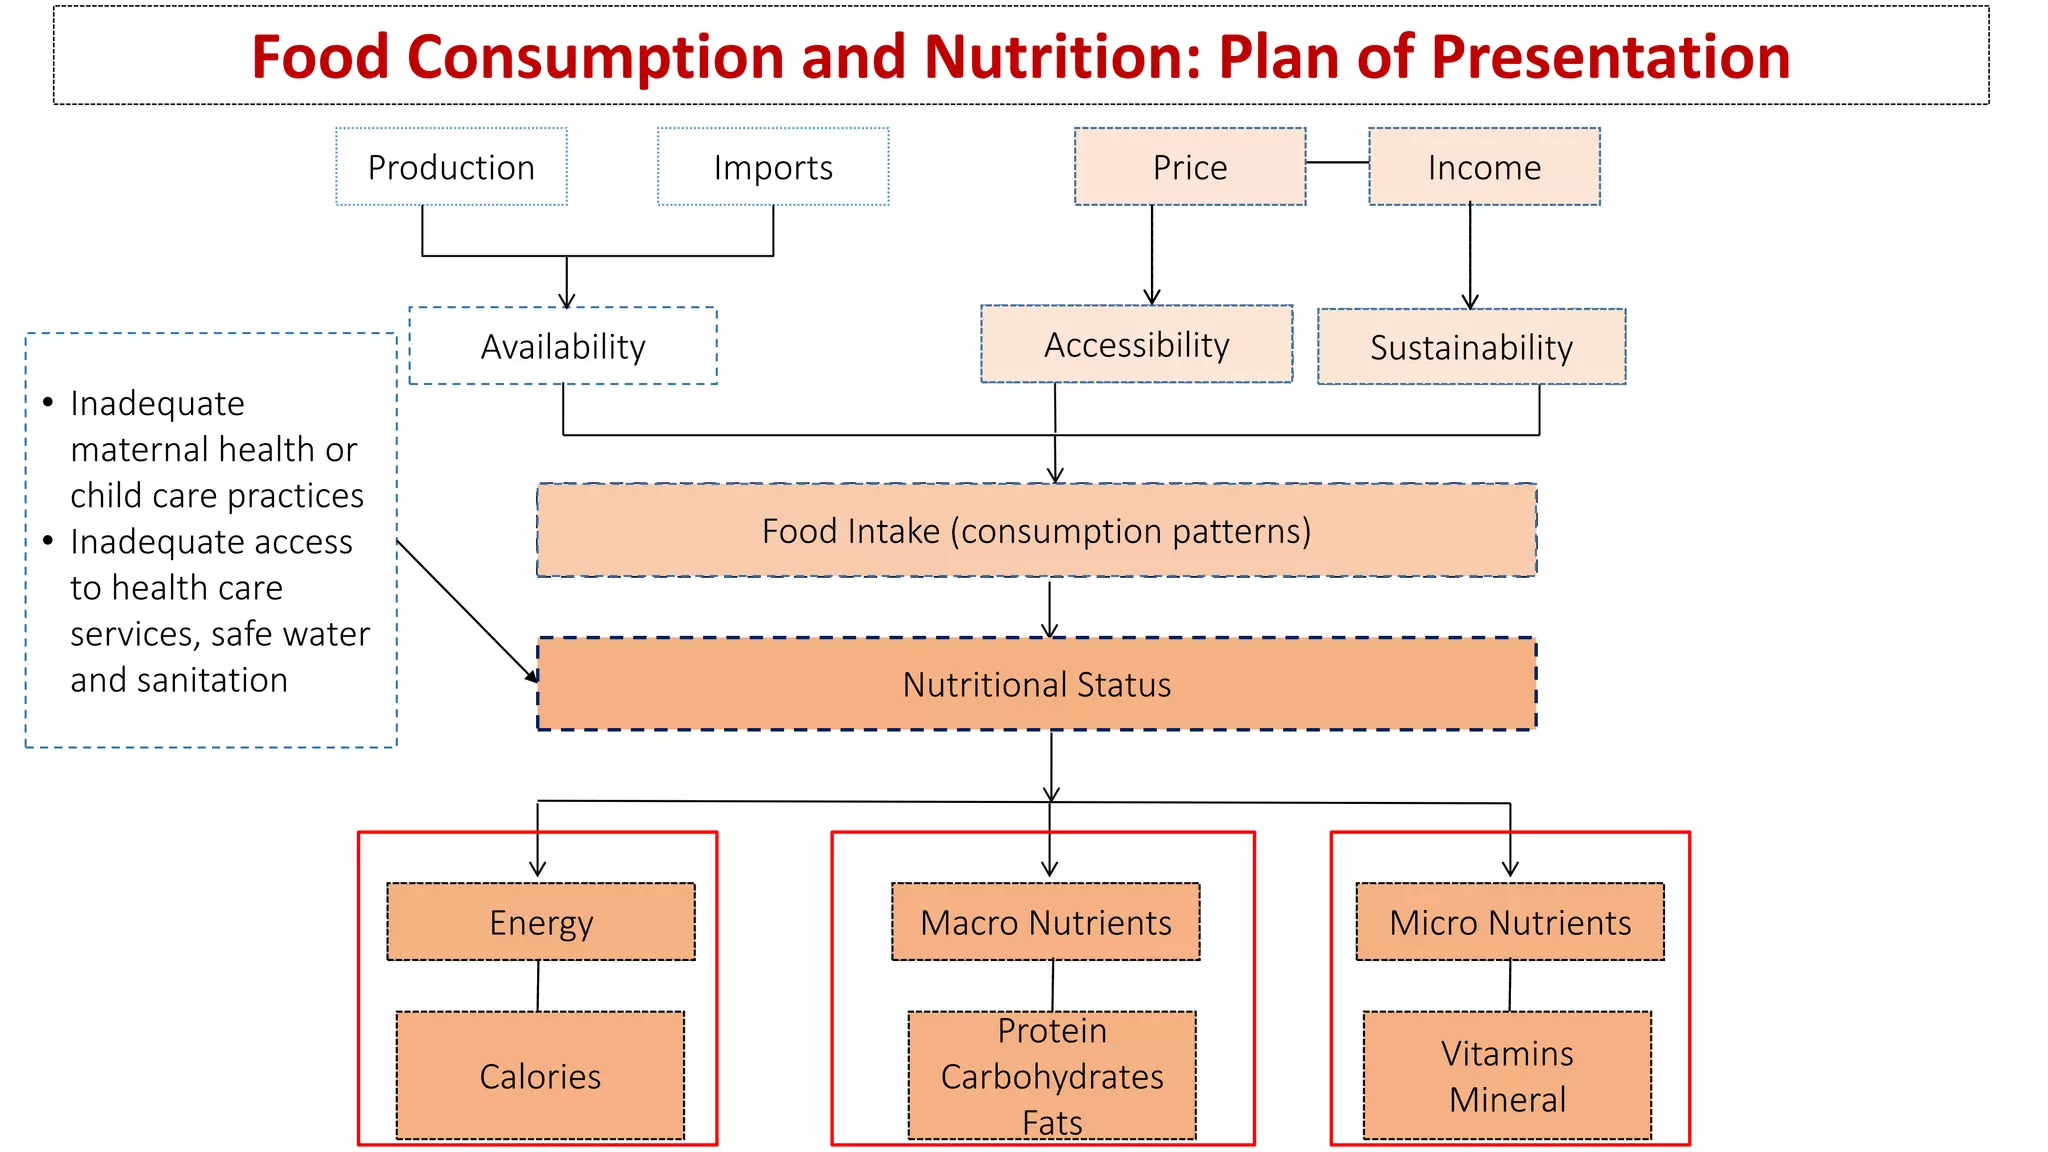
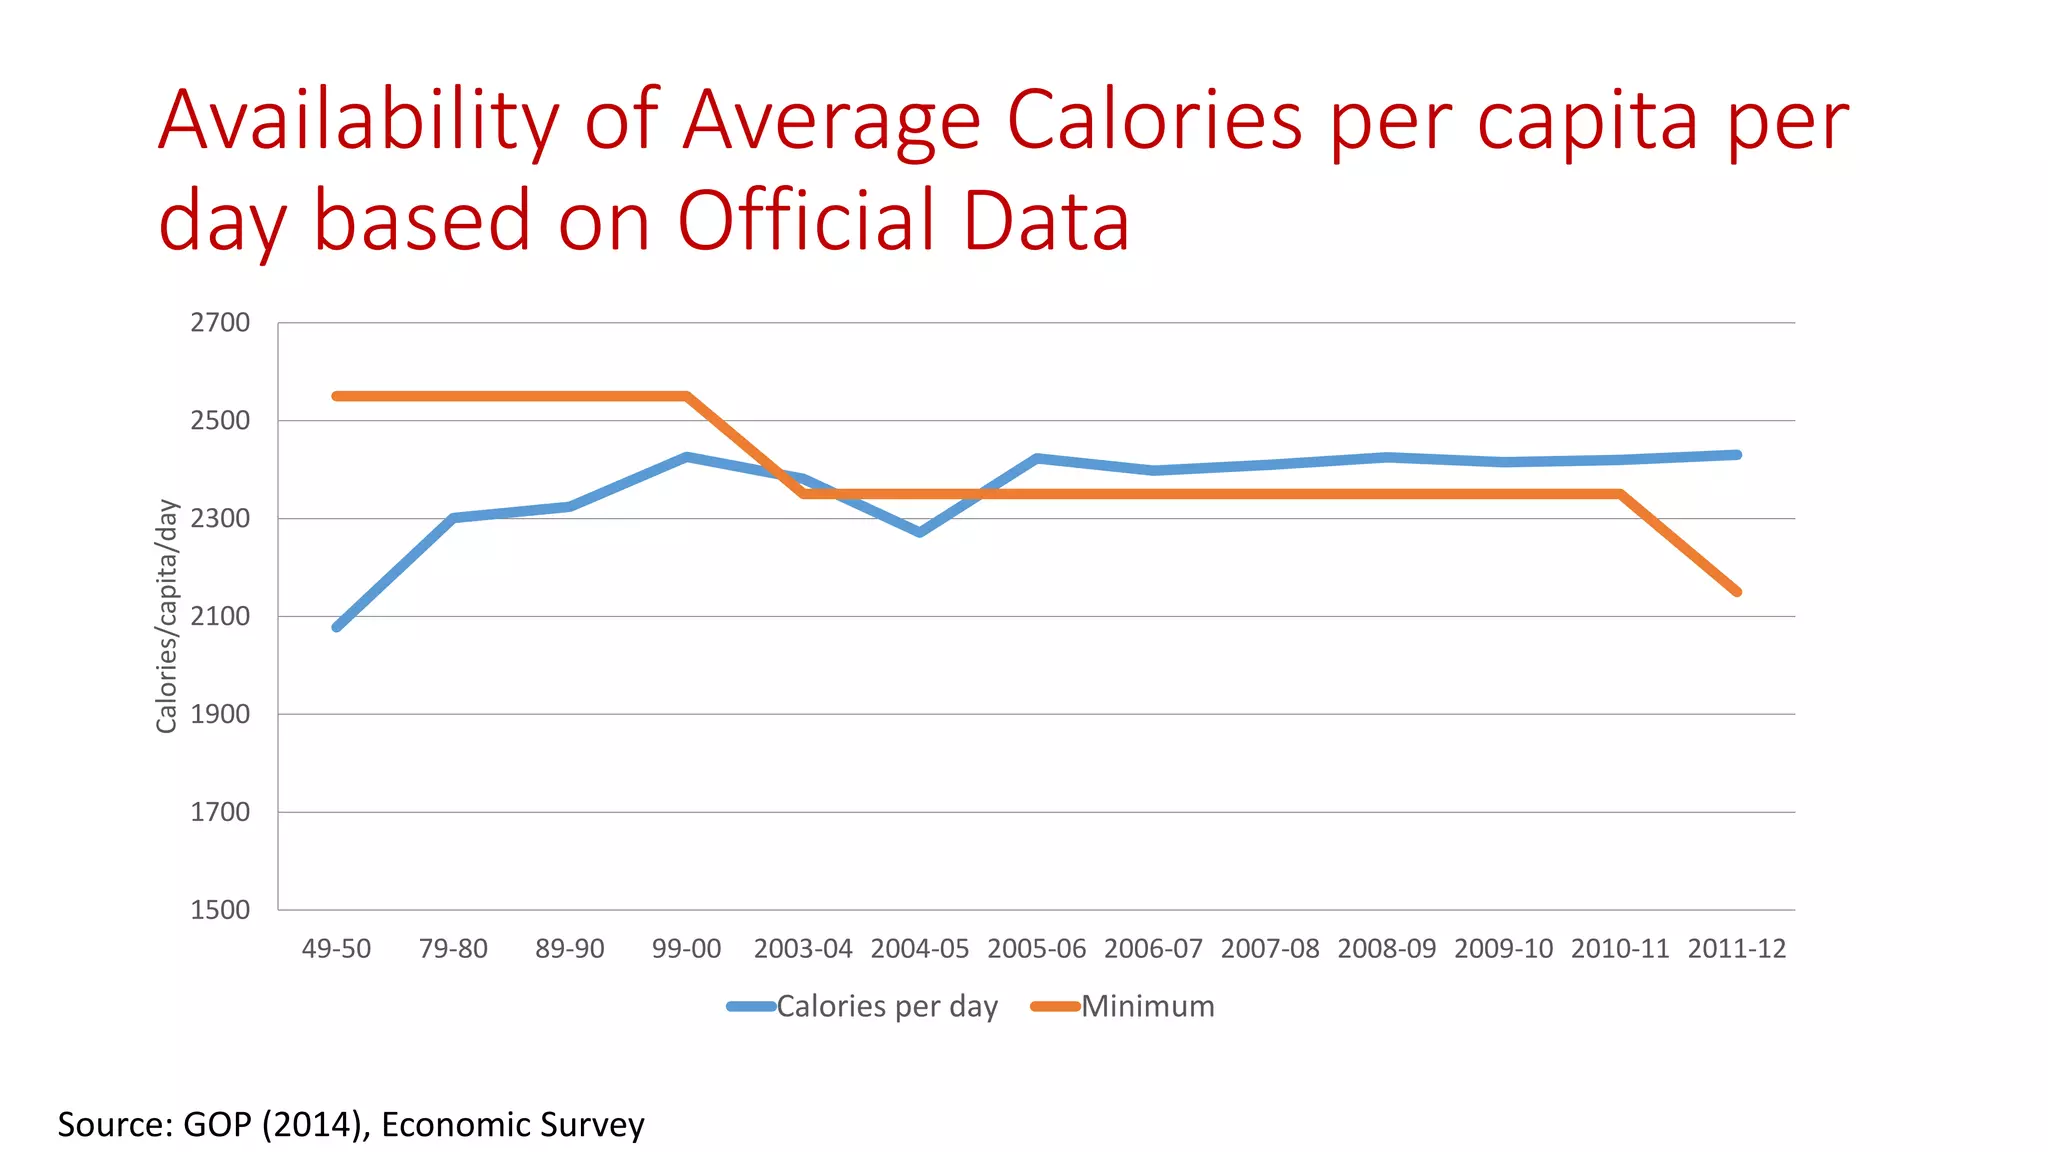
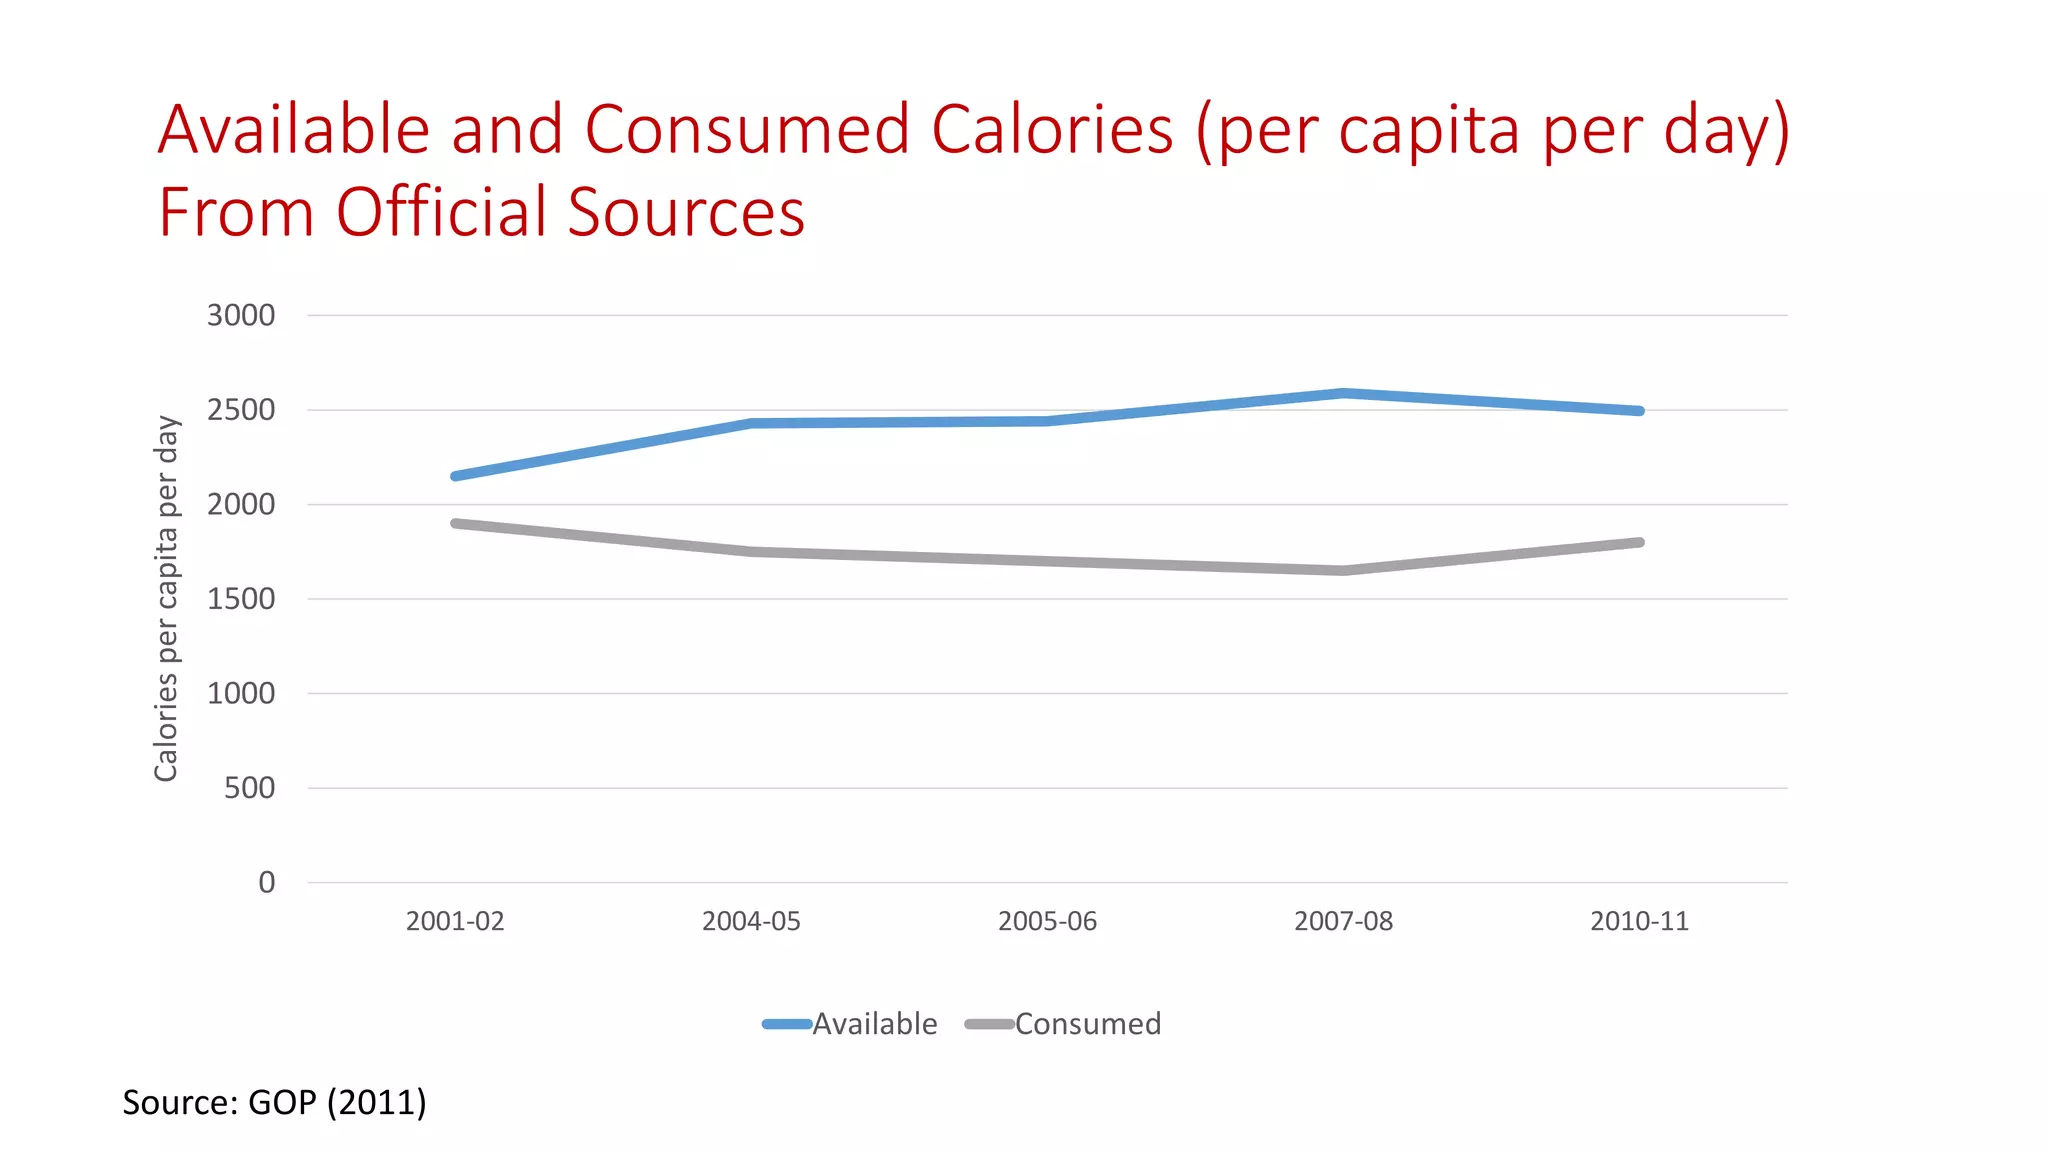
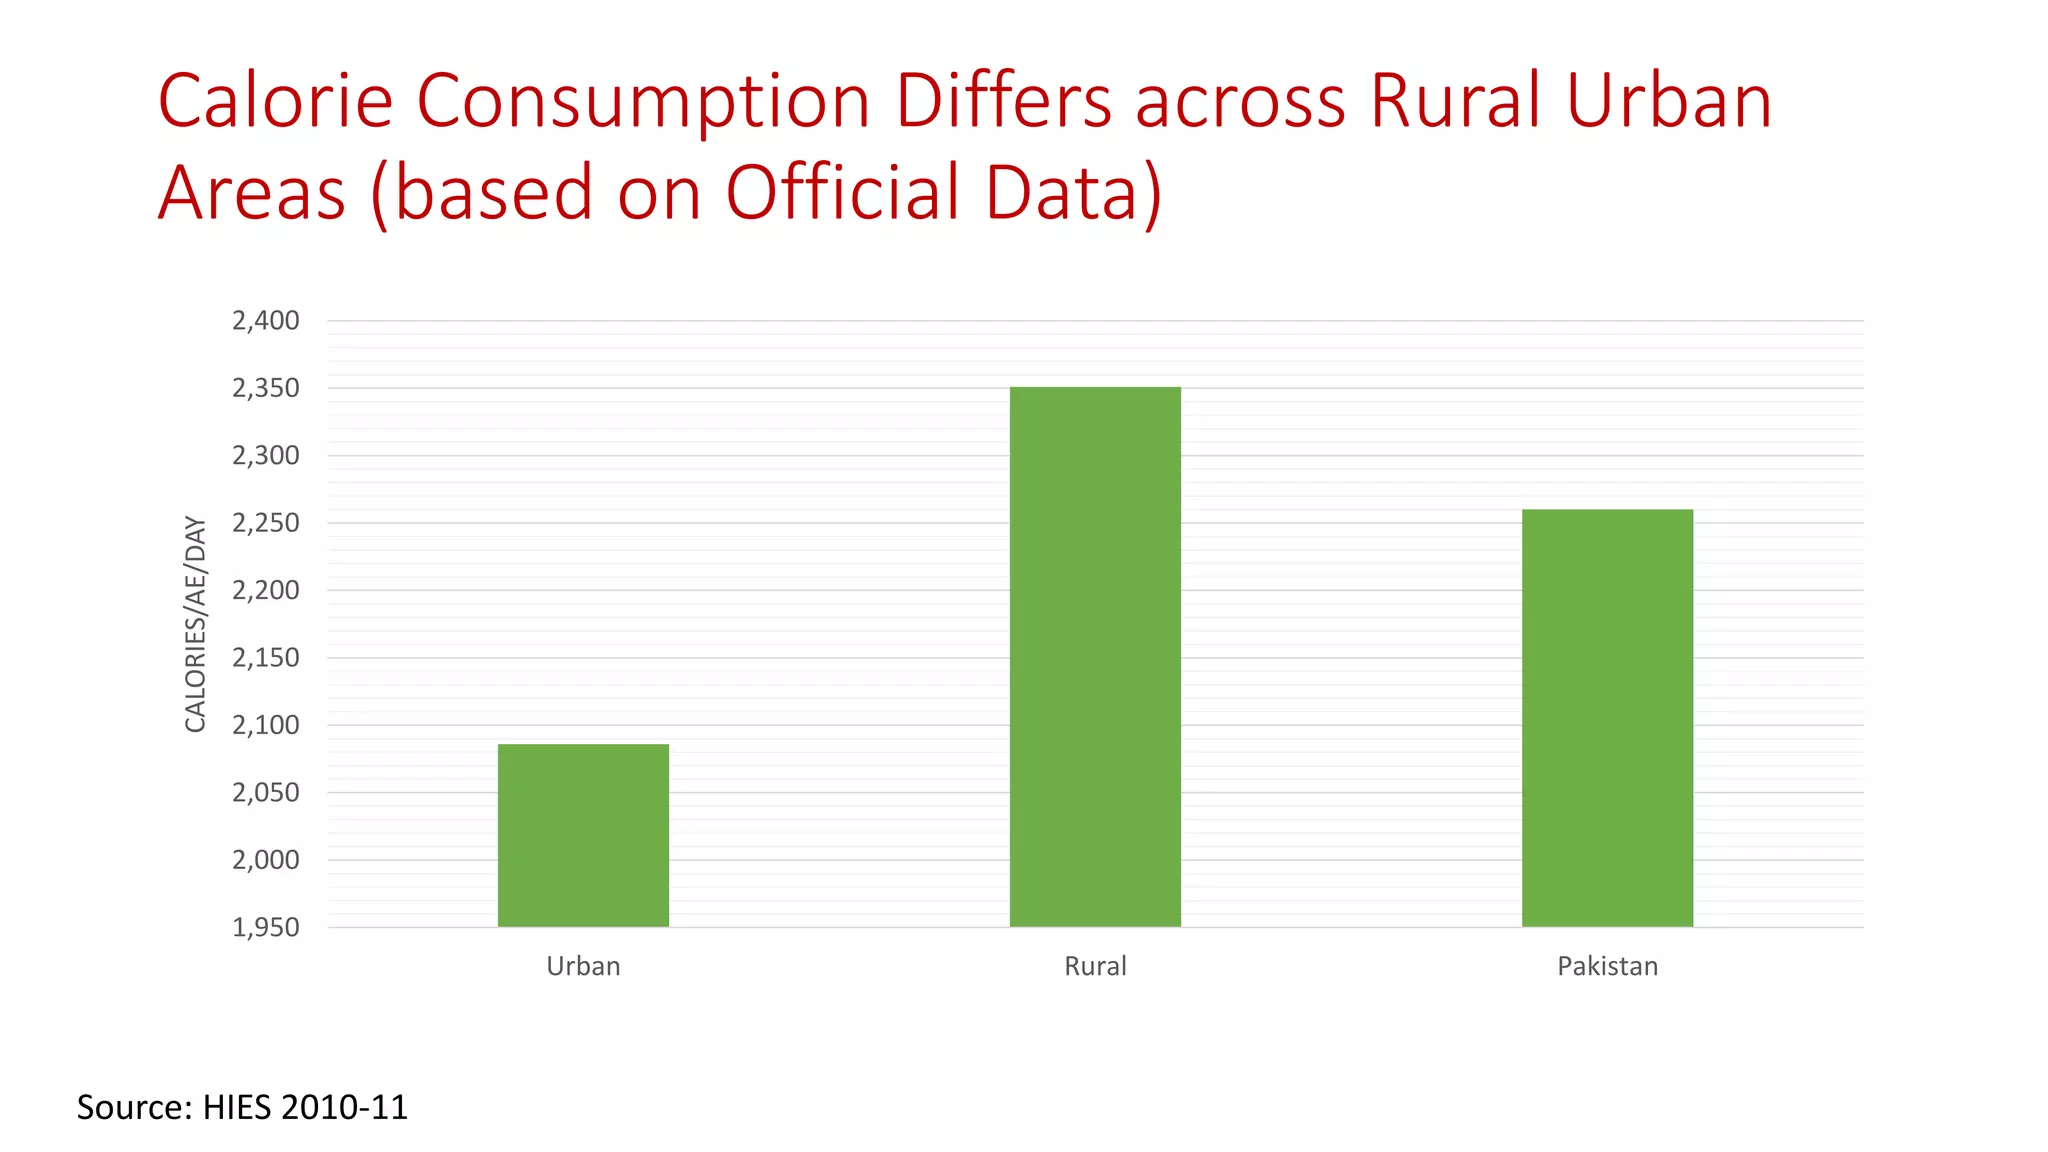
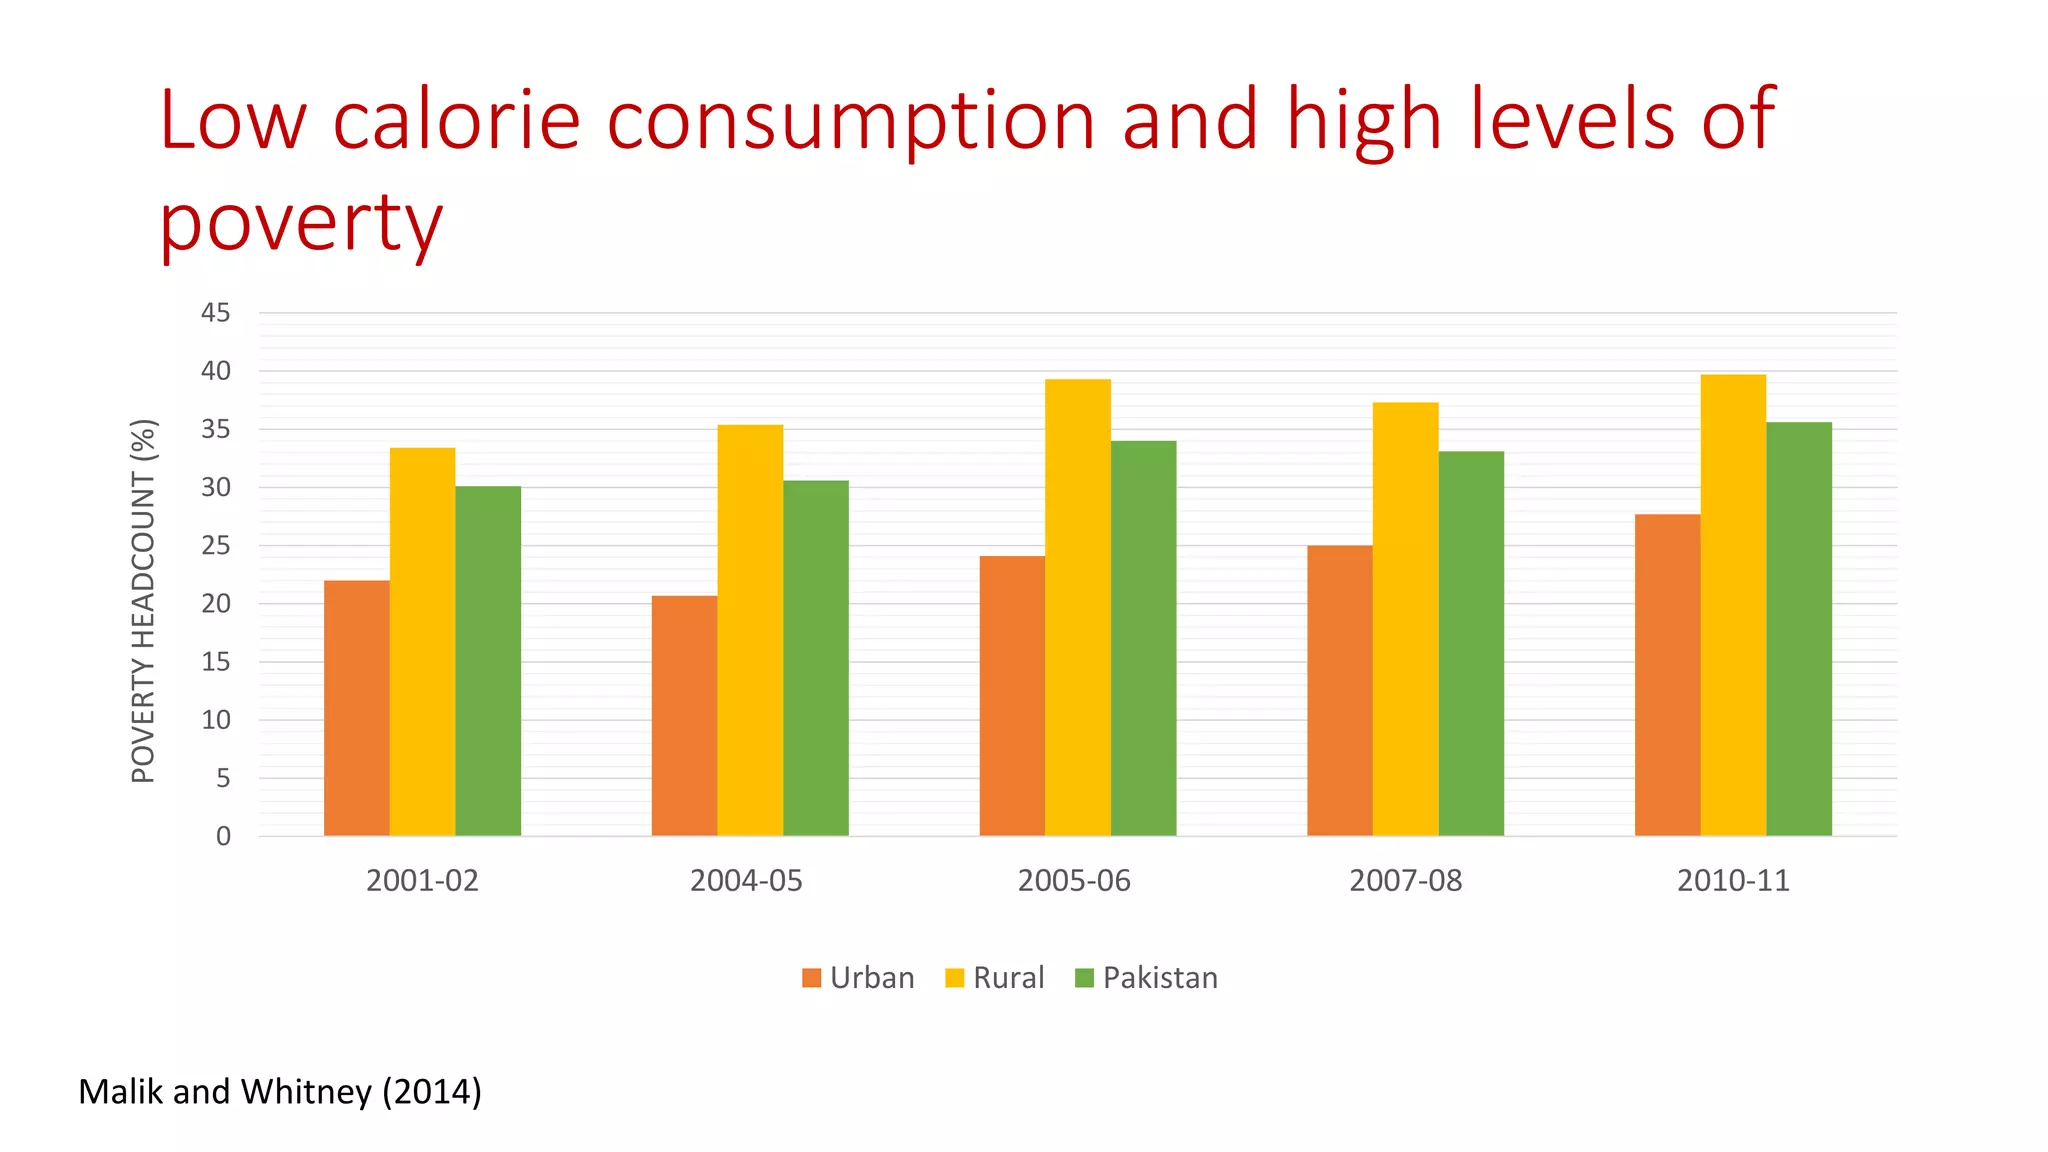
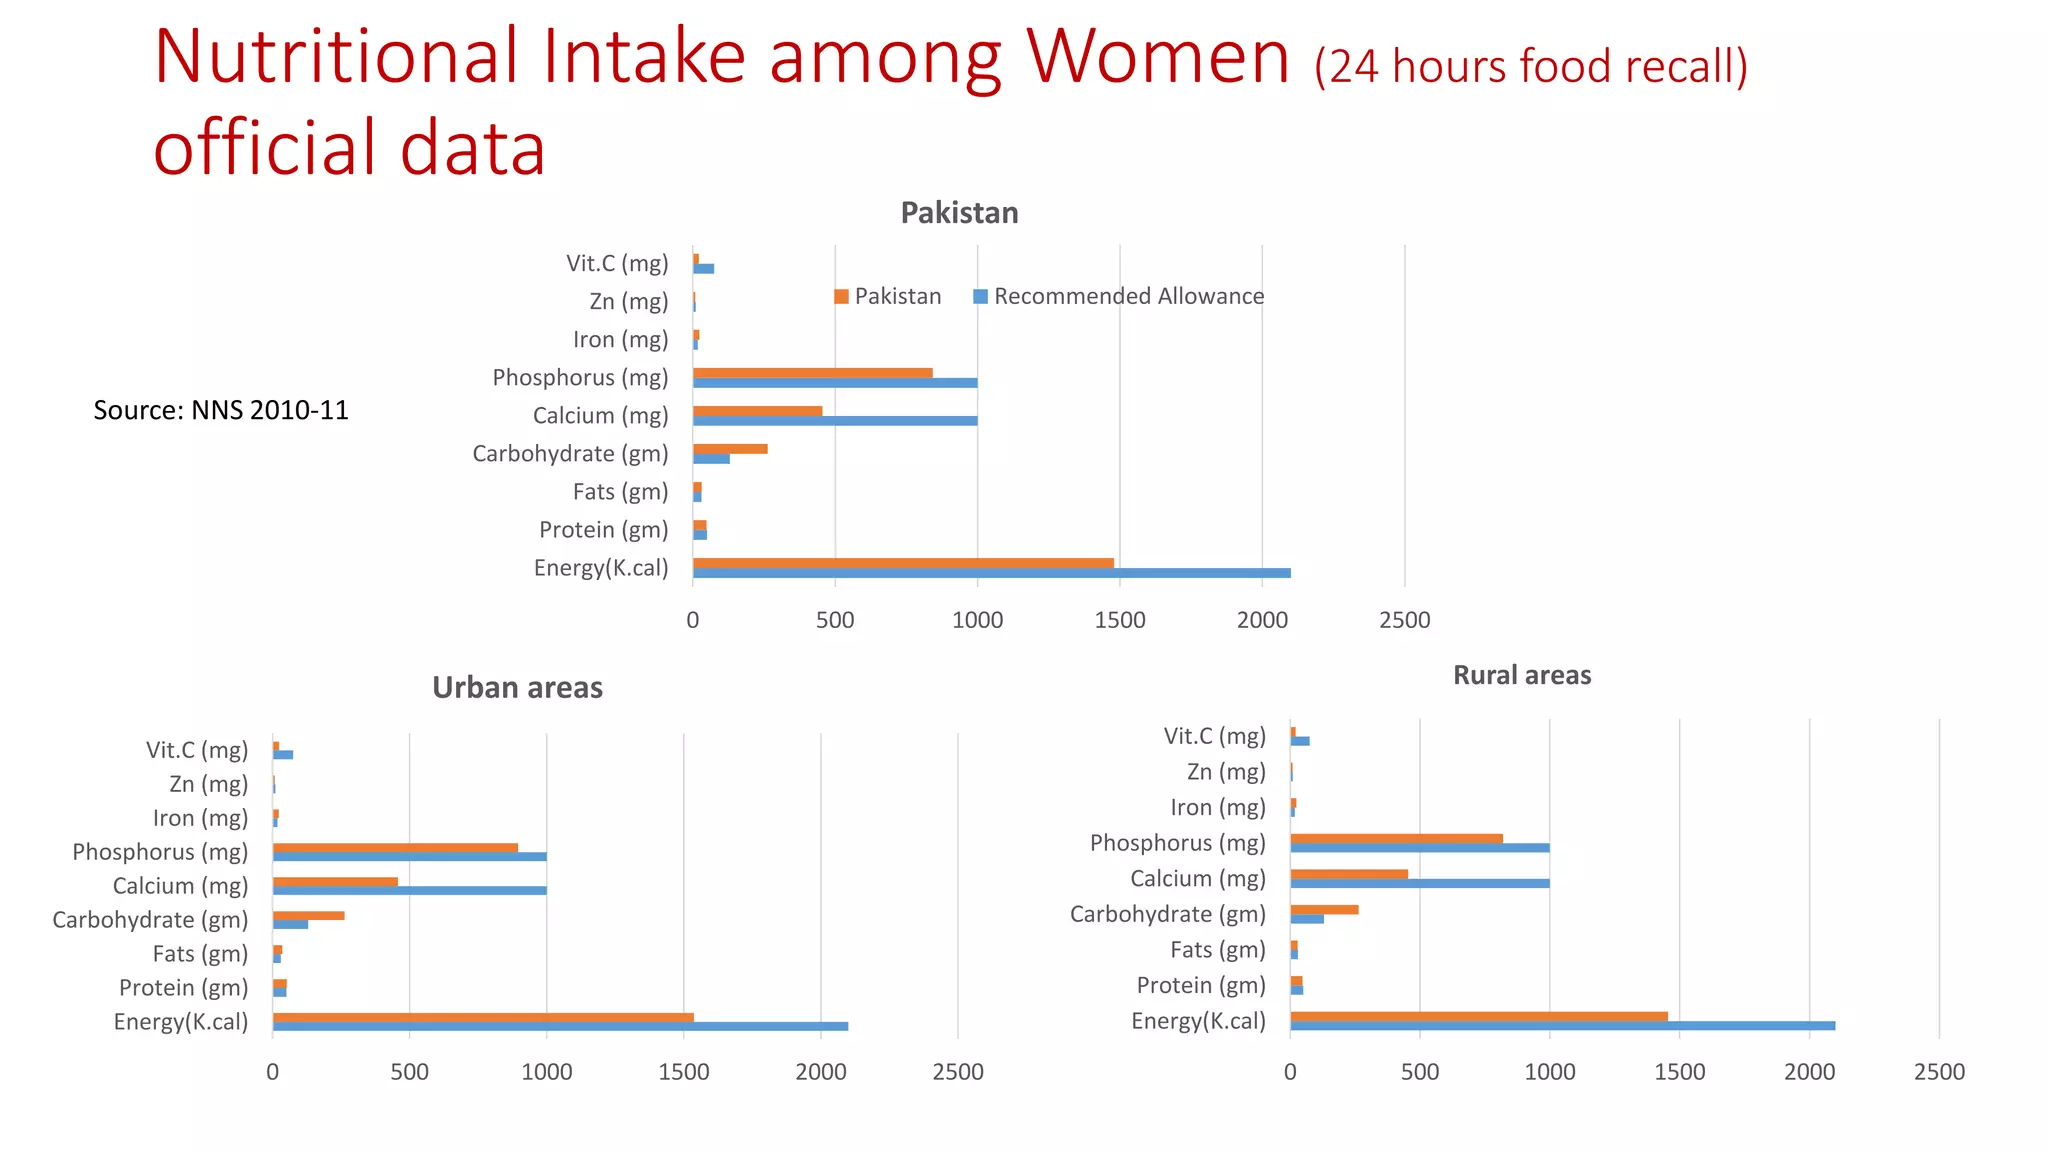
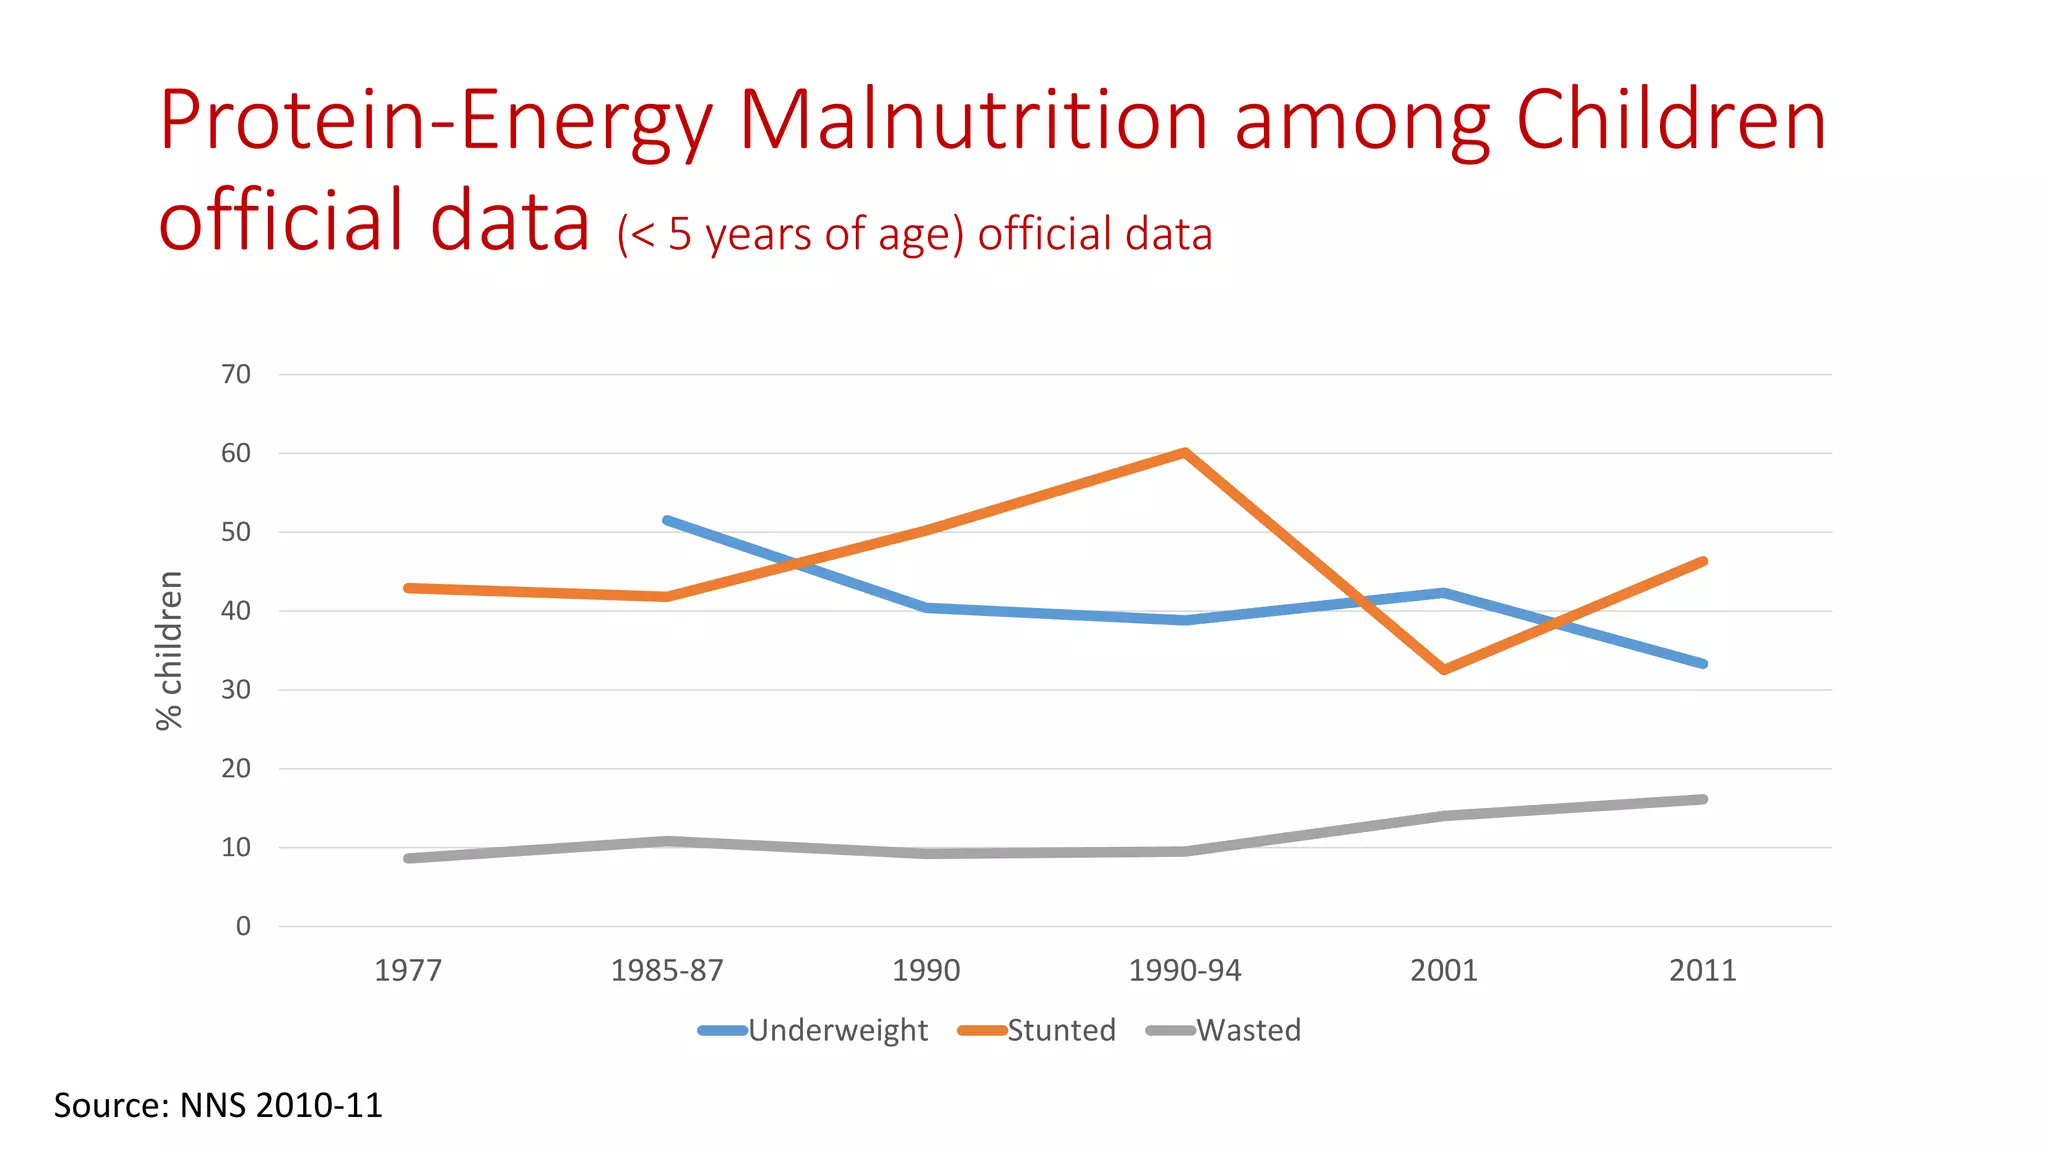
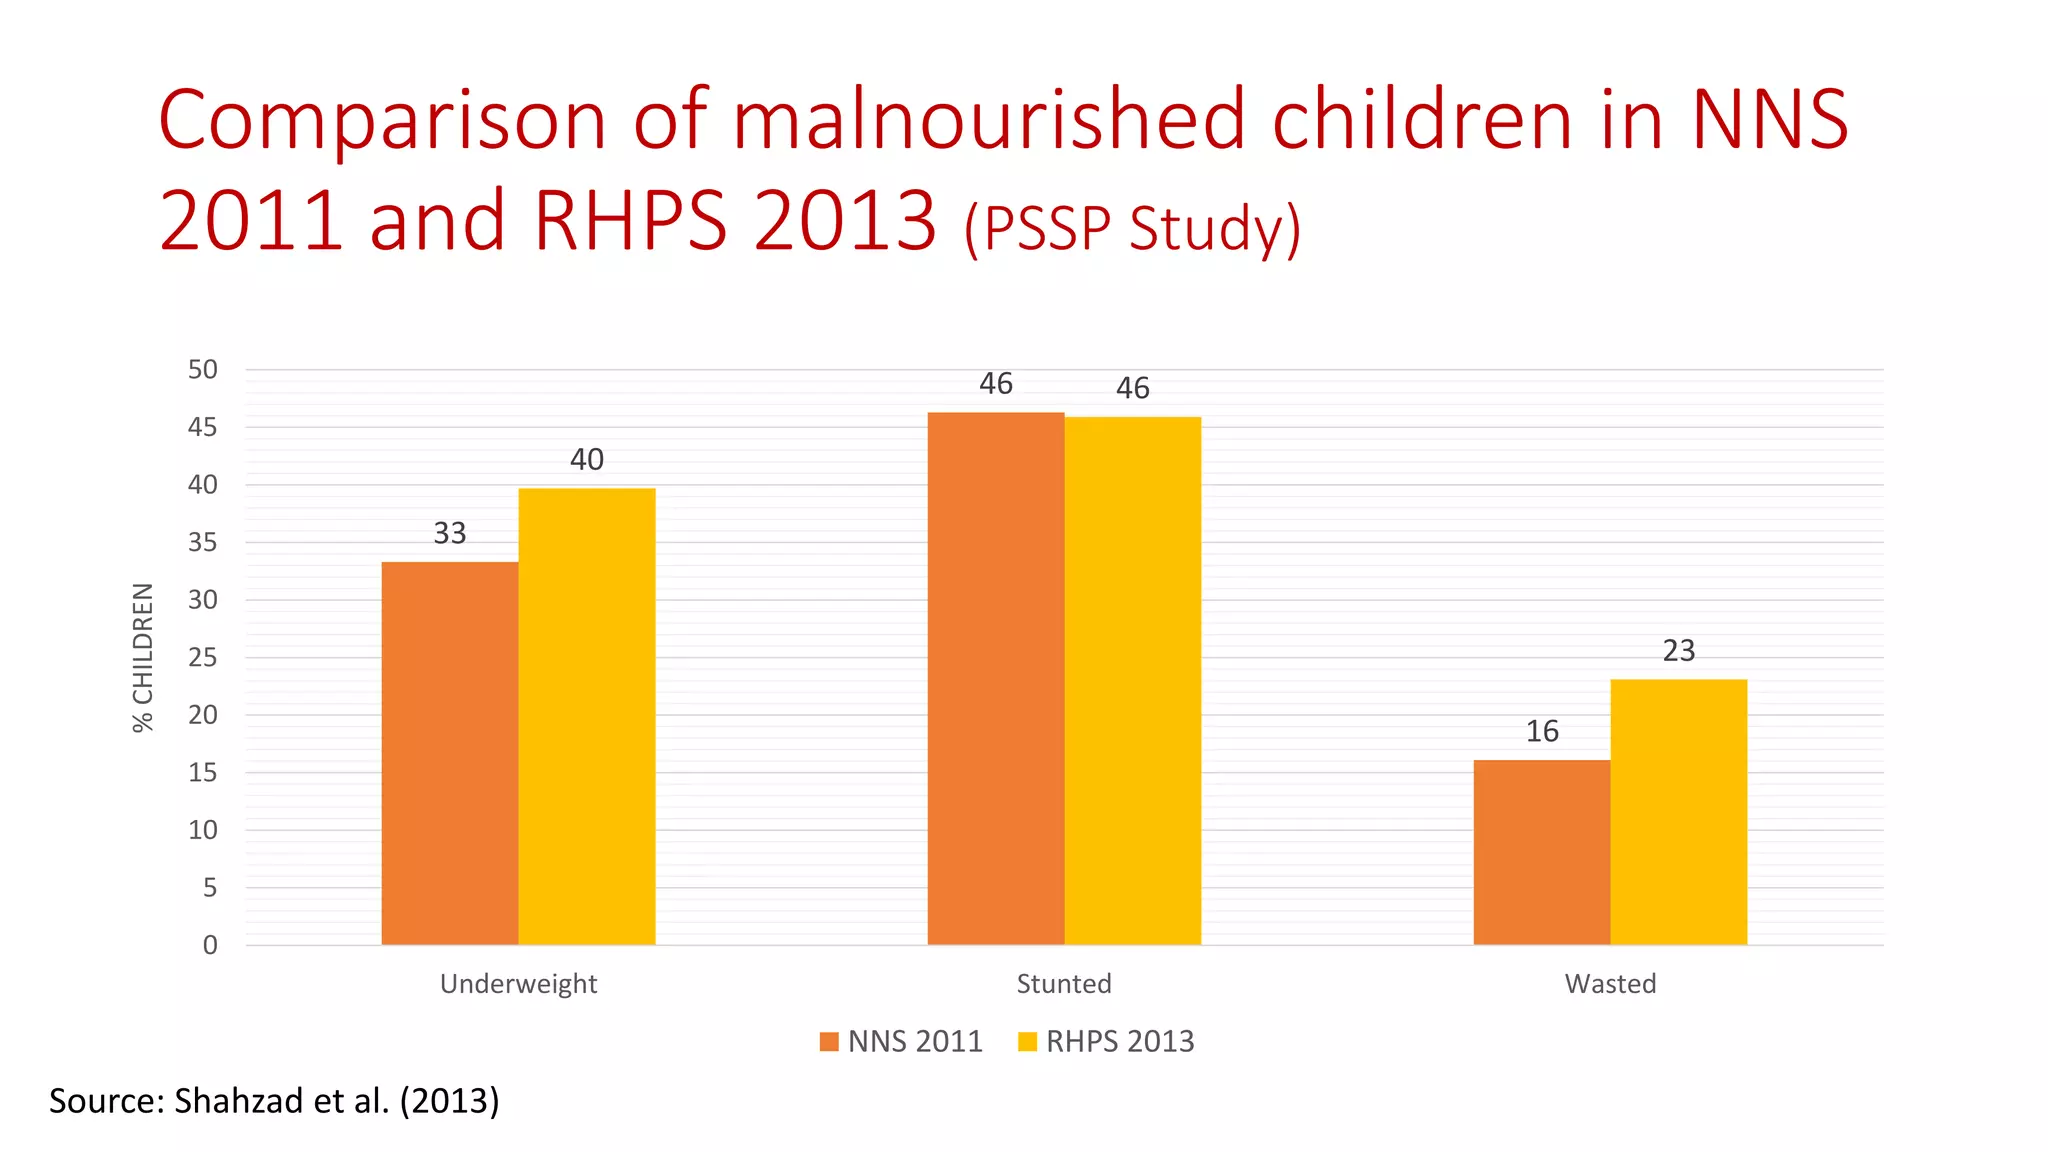
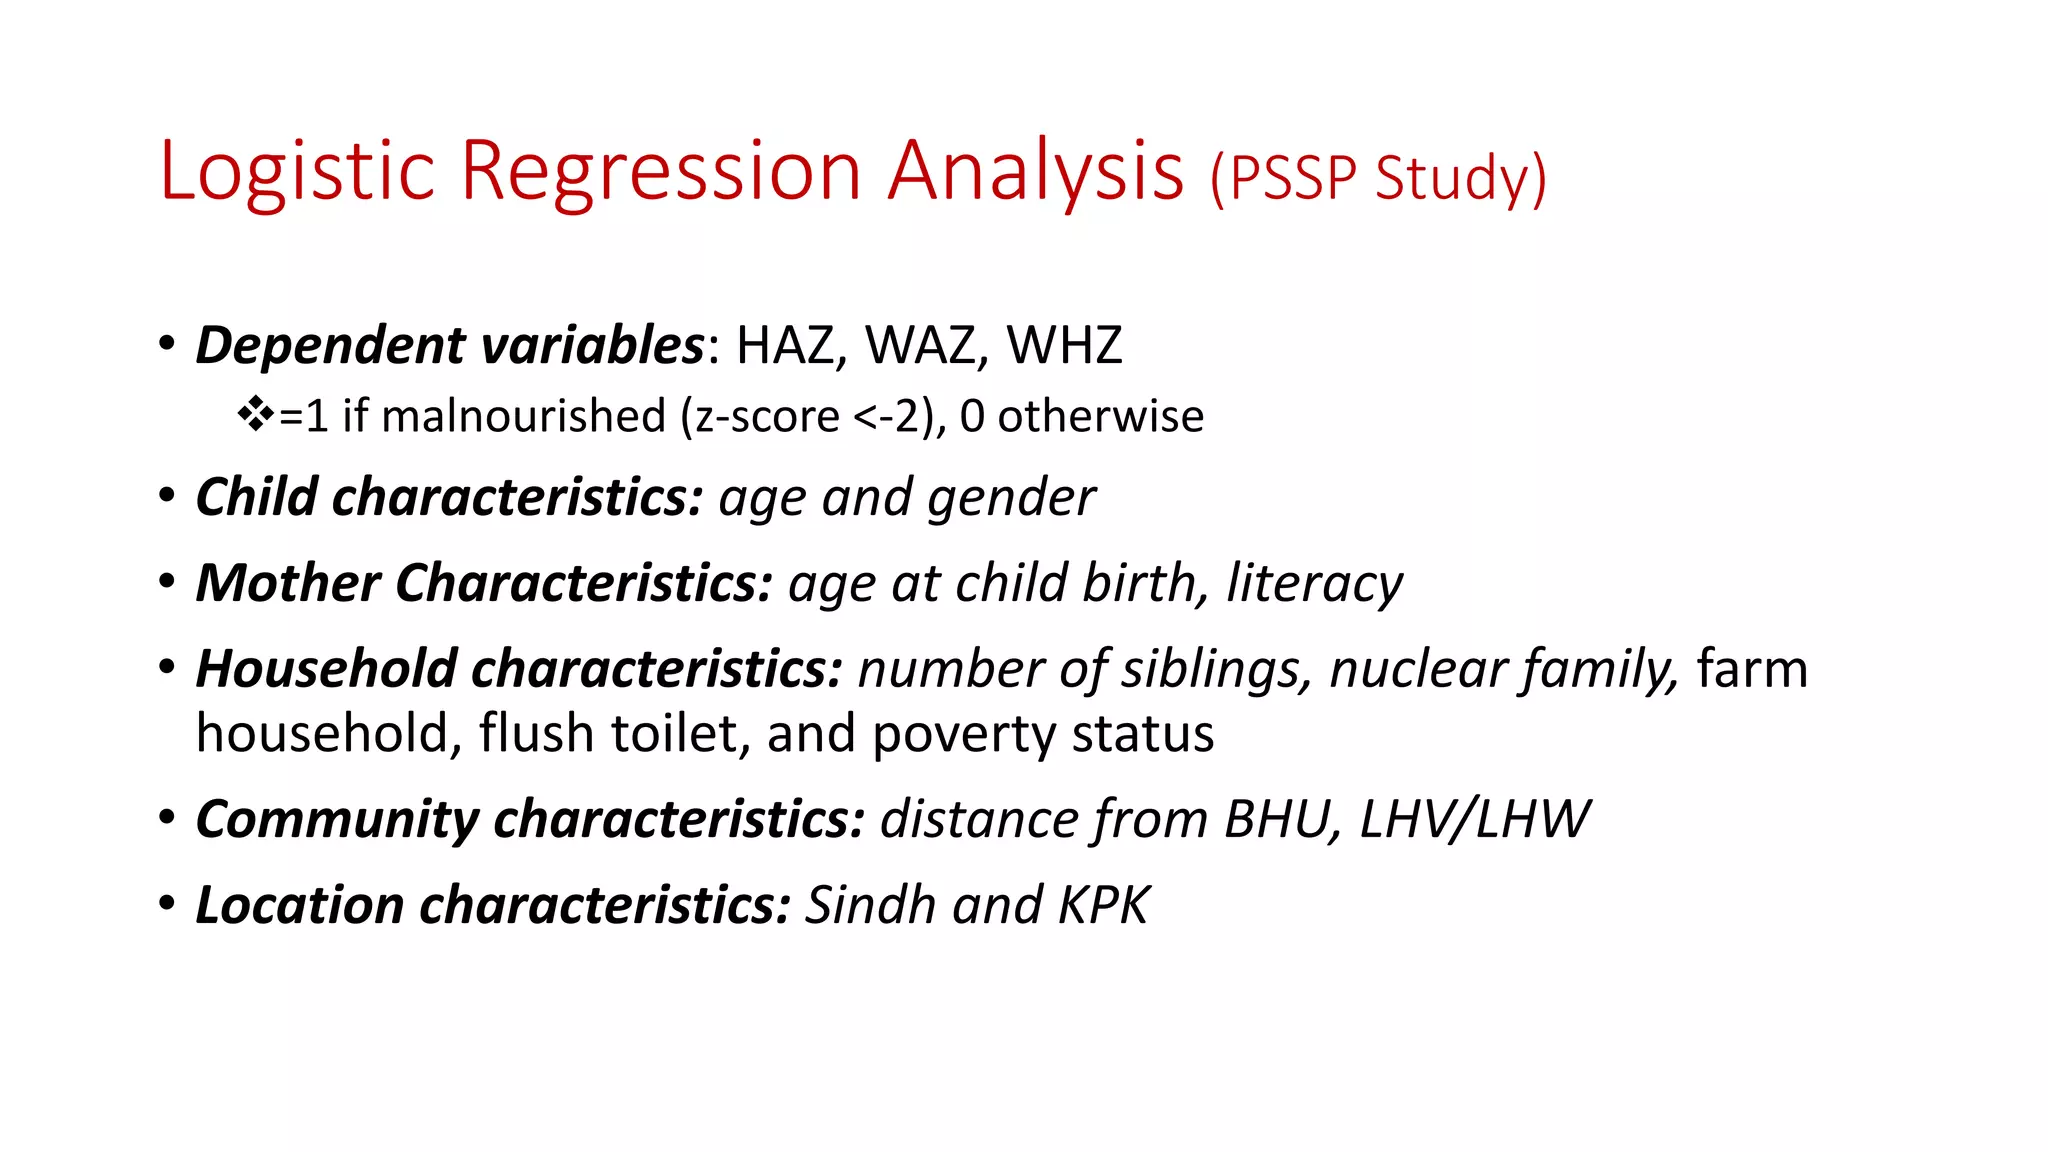
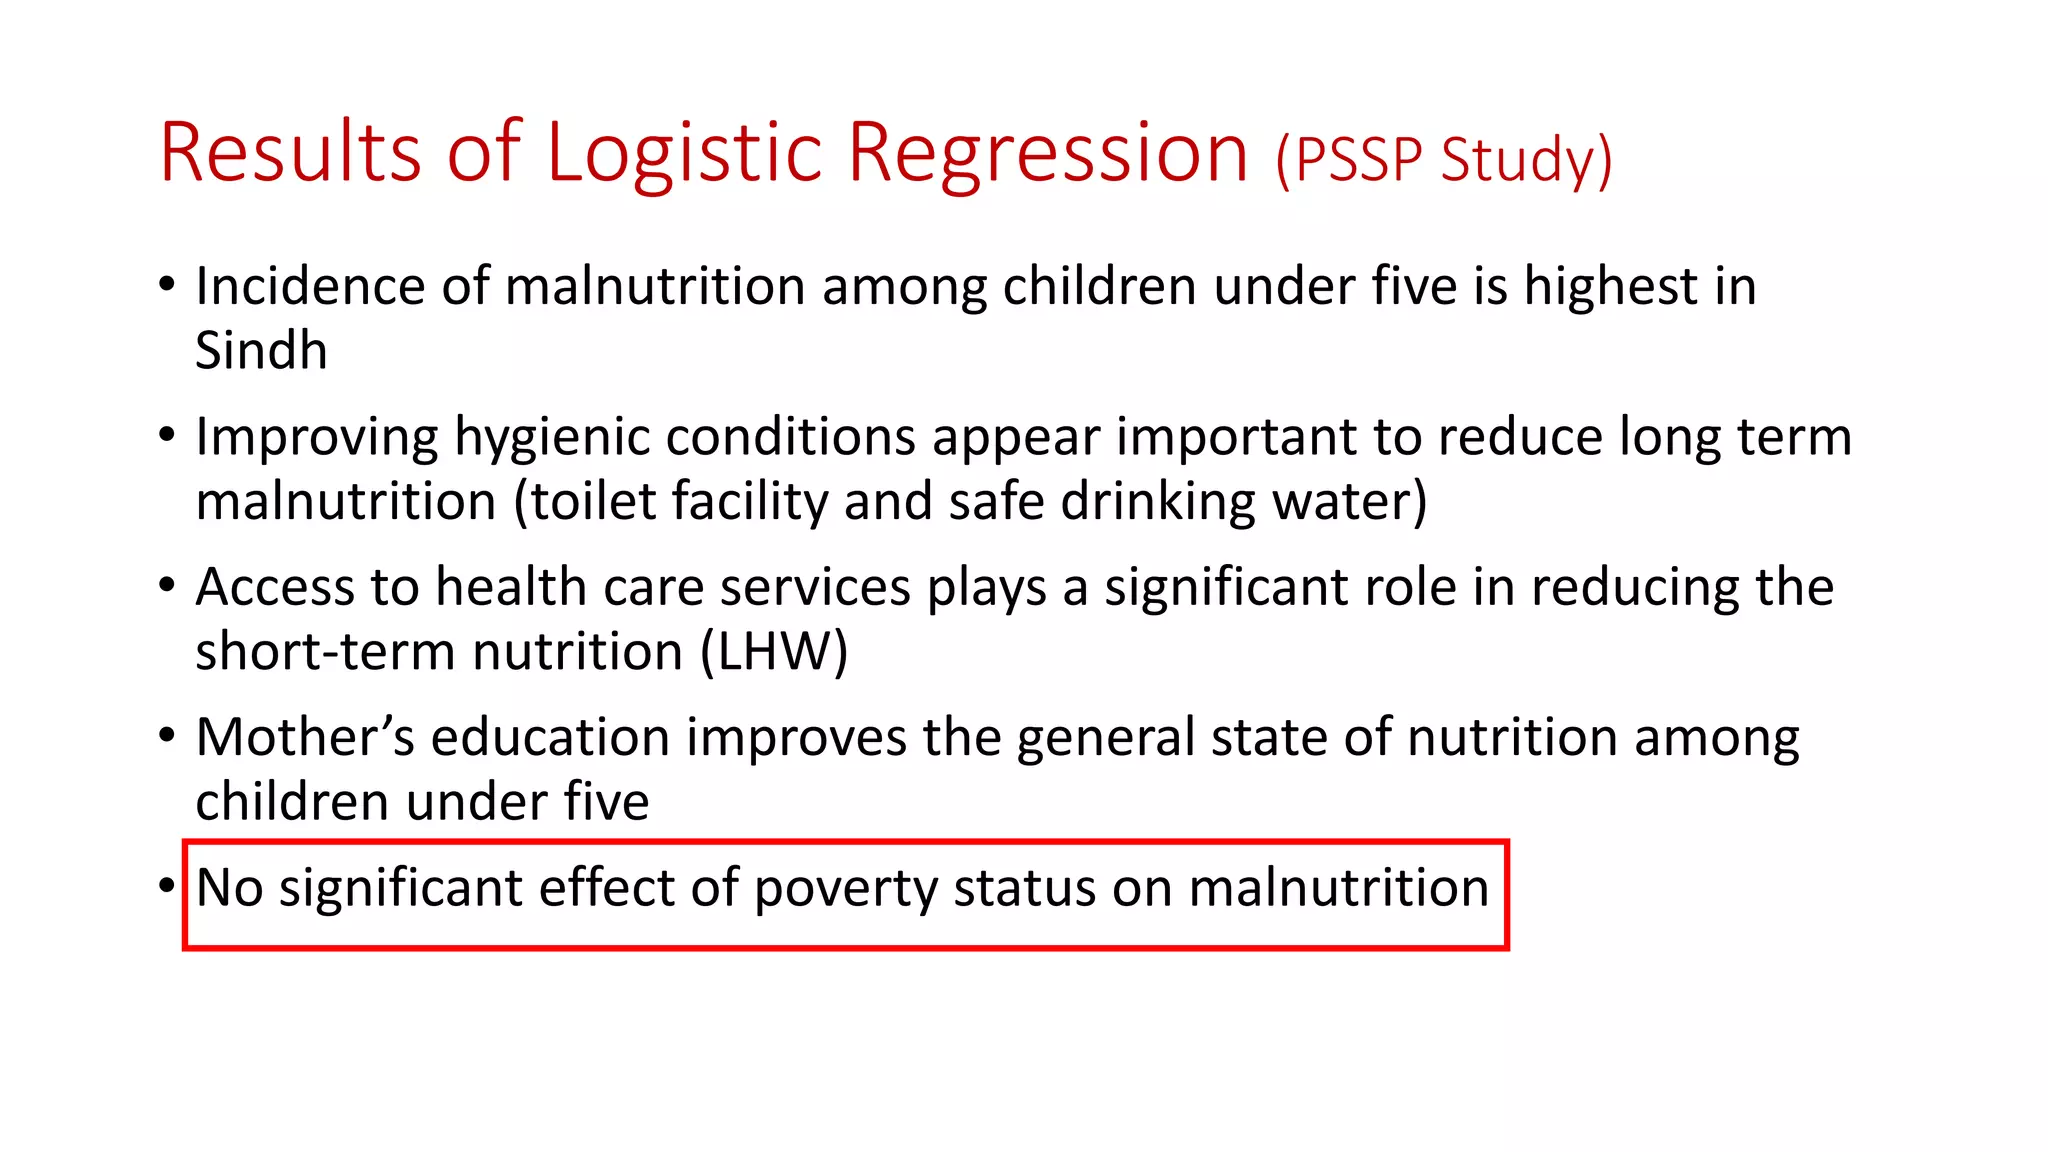
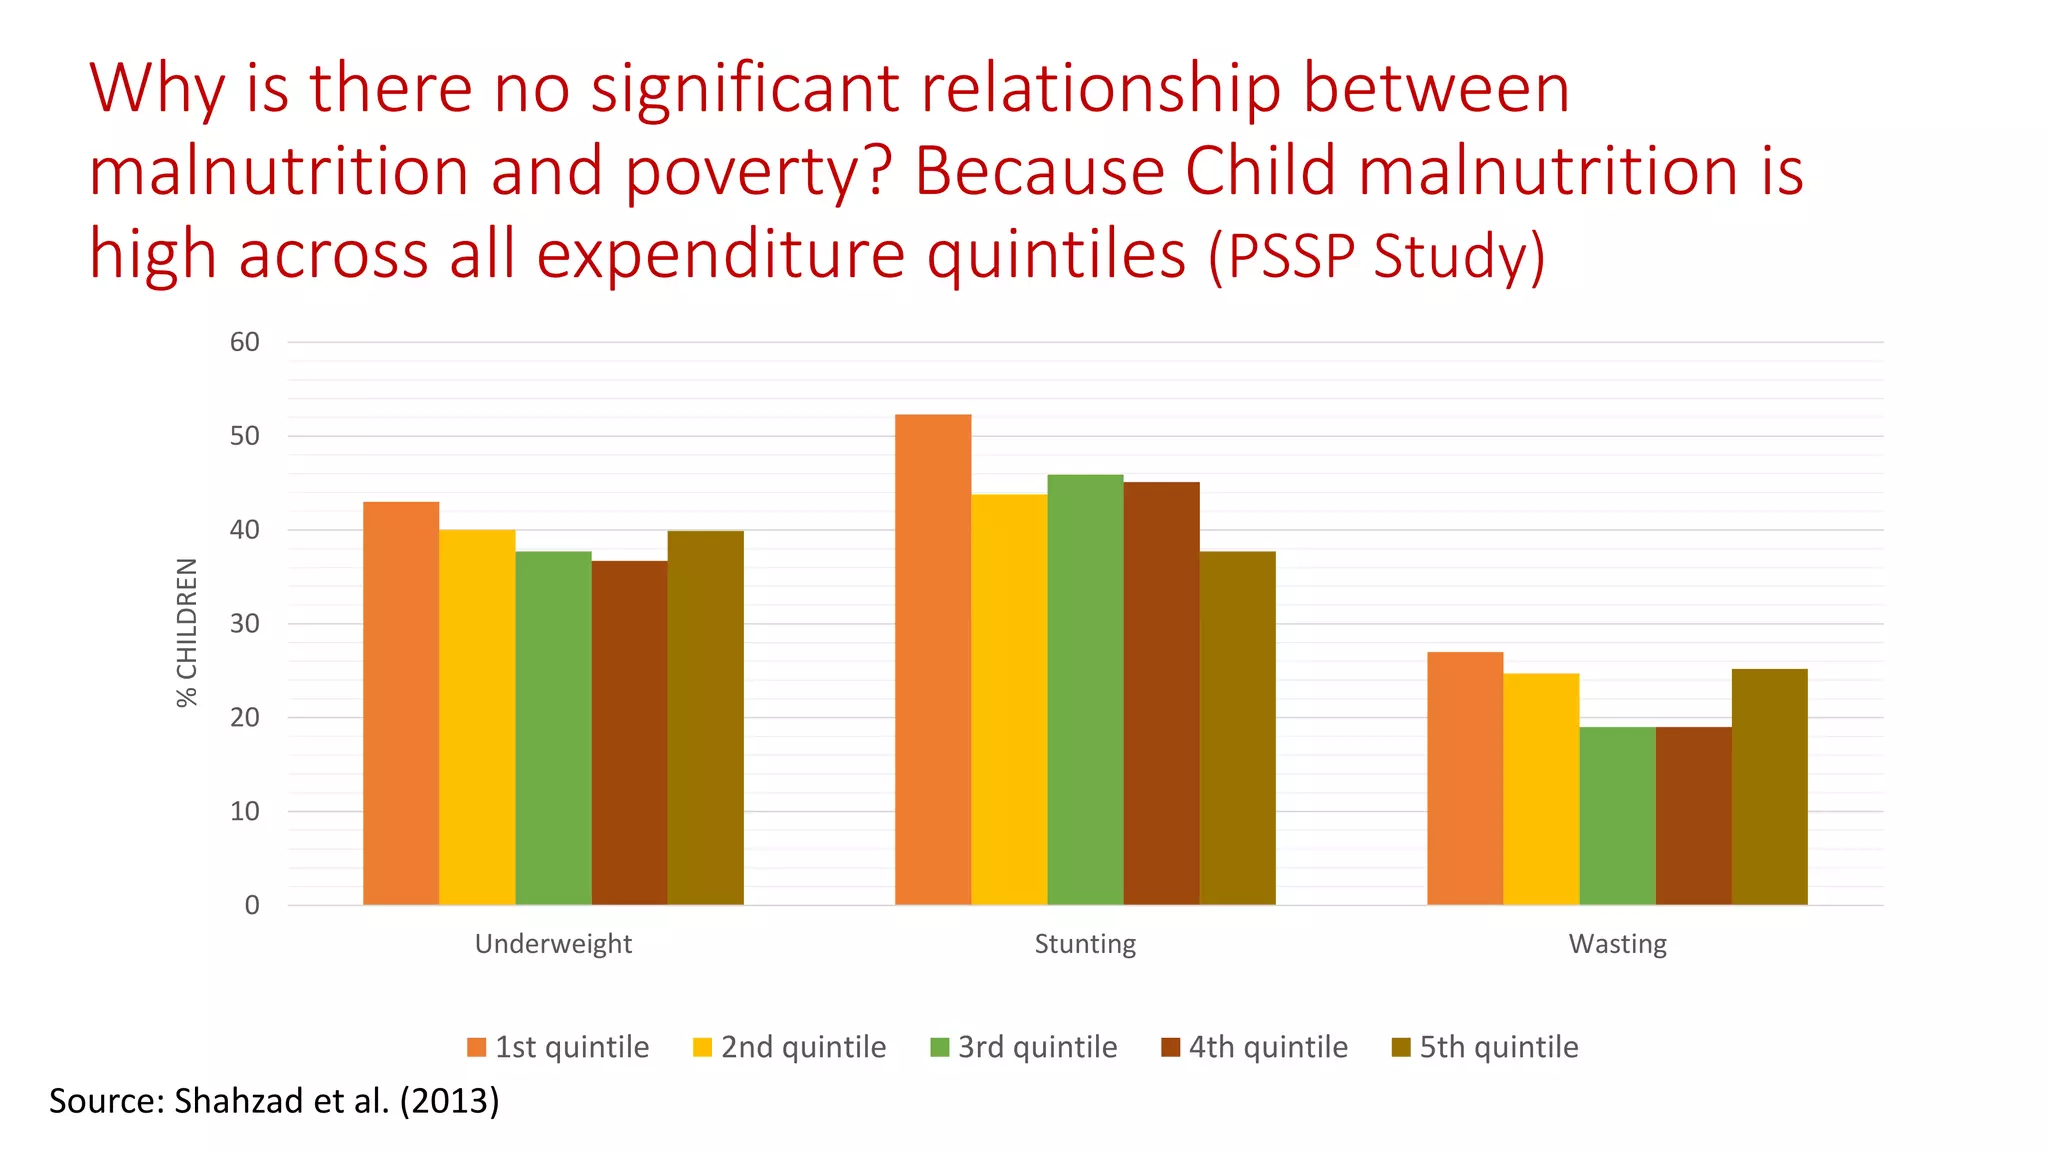
Presentation made by Hina Nazli, Amina Mehmood, and Asma Shahzad on October 2, 2014 in Islamabad, Pakistan at the policy seminar "Food Consumption Pattern and Nutritional Status in Pakistan."
Pakistan’s Multi-Sectoral Nutrition Strategy by Amna Ejaz, Research Analyst, IFPRI-Pakistan.
Presented at the ReSAKSS-Asia - MIID conference "Evolving Agrifood Systems in Asia: Achieving food and nutrition security by 2030" on Oct 30-31, 2019 in Yangon, Myanmar.
Pakistan’s Multi-Sectoral Nutrition Strategy by Amna Ejaz, Research Analyst, IFPRI-Pakistan.
Presented at the ReSAKSS-Asia - MIID conference "Evolving Agrifood Systems in Asia: Achieving food and nutrition security by 2030" on Oct 30-31, 2019 in Yangon, Myanmar.
BENISON MEDIA is publisher of “Think Grain Think Feed”. Monthly magazine for feed and feed technology. The magazine provides important information related to animal feed and nutrition industry covering feed crop, feed ingredients, additives and premixes, processing and storage technology for poultry, dairy and aqua sector.
Presented by IWMI's Ian Makin (Acting DDG of IWMI) to a group of European Union (EU) delegations in Asia at a discussion on 'Using research on agriculture climate and water to support sustainable food systems', held at IWMI Headquarters in Colombo, Sri Lanka, on June 8, 2016.
FAO/INFOODS Global Food Composition Database for PulsesFAO
www.fao.org/pulses-2016/en/ International Year of Pulses - Global Dialogue - The IYP Action Plan: major outputs - Ruth Charrondiere, Nutrition Officer, INFOODS coordinator. Nutrition and Food Systems Division, FAO
Gender and fish aquaculture: A seven country reviewWorldFish
This presentation, by WorldFish gender researchers Surendran Rajaratnam and Cynthia McDougall, looks at the gendered patterns of access to, and benefits from, small-scale aquaculture within and across seven countries that WorldFish works in (Egypt, Nigeria, Tanzania, Zambia, Bangladesh, Cambodia and Myanmar). The presentation was created for the 6th Global Symposium on Gender in Aquaculture and Fisheries on 3-7 August 2016 in Bangkok, Thailand.
Breakfast provides the body and brain with fuel after an overnight fast - that's where its name originates, breaking the fast! Without breakfast you are effectively running on empty, like trying to start the car with no petrol.The Weiser Kitchen provides gluten free and healthy breakfast recipes.
http://theweiserkitchen.com
Oh the wisdom of Moms. Remember how they insisted that you eat your breakfast? I used to tell my Mom that by the time my stomach wakes up it is was time for lunch but I always lost. Turns out breakfast is good for your health,
A gendered value chain analysis of post harvest losses in the Barotse floodpl...WorldFish
Do women or men in the Barotse floodplain in Zambia experience higher post harvest fish losses? Why? And what’s the impact – both financially and physically to the fish? The answers to these questions, shown in this presentation, are helping WorldFish design and test appropriate innovations, including ways to overcome harmful norms, behaviours and power relations in the post harvest losses context.
A N Sinha Institute of Social Science (ANSISS), and the International Food Policy Research Institute (IFPRI) organized a one day consulation on
‘A Food Secure Bihar: Challenges and Way Forward’ on August 06, 2014 at ANSISS, Patna, Bihar.
You are aware that National Food Security Act (NFSA) has been enacted with a view to ensure food security in India and Bihar is one of the state where ensuring food security is a major challenge. A better understanding of NFSA in the context of Bihar will be helpful for effective implementation of the NFSA. The main objective of the policy consultative workshop is to deliberate on the options and strategies for making NFSA efficient and effective in Bihar
POSHAN District Nutrition Profile_Katihar_BiharPOSHAN
POSHAN District Nutrition Profiles (DNPs) draw on diverse sources of data to compile a set of indicators on the state of nutrition and its cross-sectoral determinants. The profiles are intended to be conversation-starters at the district level and to enable discussions about why undernutrition levels are high, and which factors, at multiple levels, might need to be addressed to improve nutrition.
PLEASE NOTE that POSHAN is regularly tracking data sources as they are released and updating the profiles accordingly.
POSHAN District Nutrition Profile_Khagaria_BiharPOSHAN
POSHAN District Nutrition Profiles (DNPs) draw on diverse sources of data to compile a set of indicators on the state of nutrition and its cross-sectoral determinants. The profiles are intended to be conversation-starters at the district level and to enable discussions about why undernutrition levels are high, and which factors, at multiple levels, might need to be addressed to improve nutrition.
PLEASE NOTE that POSHAN is regularly tracking data sources as they are released and updating the profiles accordingly.
POSHAN District Nutrition Profile_Buxar_BiharPOSHAN
POSHAN District Nutrition Profiles (DNPs) draw on diverse sources of data to compile a set of indicators on the state of nutrition and its cross-sectoral determinants. The profiles are intended to be conversation-starters at the district level and to enable discussions about why undernutrition levels are high, and which factors, at multiple levels, might need to be addressed to improve nutrition.
PLEASE NOTE that POSHAN is regularly tracking data sources as they are released and updating the profiles accordingly.
POSHAN District Nutrition Profile_Bhojpur_BiharPOSHAN
POSHAN District Nutrition Profiles (DNPs) draw on diverse sources of data to compile a set of indicators on the state of nutrition and its cross-sectoral determinants. The profiles are intended to be conversation-starters at the district level and to enable discussions about why undernutrition levels are high, and which factors, at multiple levels, might need to be addressed to improve nutrition.
PLEASE NOTE that POSHAN is regularly tracking data sources as they are released and updating the profiles accordingly.
POSHAN District Nutrition Profile_Kishanganj_BiharPOSHAN
POSHAN District Nutrition Profiles (DNPs) draw on diverse sources of data to compile a set of indicators on the state of nutrition and its cross-sectoral determinants. The profiles are intended to be conversation-starters at the district level and to enable discussions about why undernutrition levels are high, and which factors, at multiple levels, might need to be addressed to improve nutrition.
PLEASE NOTE that POSHAN is regularly tracking data sources as they are released and updating the profiles accordingly.
POSHAN District Nutrition Profile_Gopalganj_BiharPOSHAN
POSHAN District Nutrition Profiles (DNPs) draw on diverse sources of data to compile a set of indicators on the state of nutrition and its cross-sectoral determinants. The profiles are intended to be conversation-starters at the district level and to enable discussions about why undernutrition levels are high, and which factors, at multiple levels, might need to be addressed to improve nutrition.
PLEASE NOTE that POSHAN is regularly tracking data sources as they are released and updating the profiles accordingly.
POSHAN District Nutrition Profile_Madhepura_BiharPOSHAN
POSHAN District Nutrition Profiles (DNPs) draw on diverse sources of data to compile a set of indicators on the state of nutrition and its cross-sectoral determinants. The profiles are intended to be conversation-starters at the district level and to enable discussions about why undernutrition levels are high, and which factors, at multiple levels, might need to be addressed to improve nutrition.
PLEASE NOTE that POSHAN is regularly tracking data sources as they are released and updating the profiles accordingly.
POSHAN District Nutrition Profile_Arwal_BiharPOSHAN
POSHAN District Nutrition Profiles (DNPs) draw on diverse sources of data to compile a set of indicators on the state of nutrition and its cross-sectoral determinants. The profiles are intended to be conversation-starters at the district level and to enable discussions about why undernutrition levels are high, and which factors, at multiple levels, might need to be addressed to improve nutrition.
PLEASE NOTE that POSHAN is regularly tracking data sources as they are released and updating the profiles accordingly.
POSHAN District Nutrition Profile_Aurangabad_BiharPOSHAN
POSHAN District Nutrition Profiles (DNPs) draw on diverse sources of data to compile a set of indicators on the state of nutrition and its cross-sectoral determinants. The profiles are intended to be conversation-starters at the district level and to enable discussions about why undernutrition levels are high, and which factors, at multiple levels, might need to be addressed to improve nutrition.
PLEASE NOTE that POSHAN is regularly tracking data sources as they are released and updating the profiles accordingly.
POSHAN District Nutrition Profile_Kaimur_BiharPOSHAN
POSHAN District Nutrition Profiles (DNPs) draw on diverse sources of data to compile a set of indicators on the state of nutrition and its cross-sectoral determinants. The profiles are intended to be conversation-starters at the district level and to enable discussions about why undernutrition levels are high, and which factors, at multiple levels, might need to be addressed to improve nutrition.
PLEASE NOTE that POSHAN is regularly tracking data sources as they are released and updating the profiles accordingly.
POSHAN District Nutrition Profile_Purnia_BiharPOSHAN
POSHAN District Nutrition Profiles (DNPs) draw on diverse sources of data to compile a set of indicators on the state of nutrition and its cross-sectoral determinants. The profiles are intended to be conversation-starters at the district level and to enable discussions about why undernutrition levels are high, and which factors, at multiple levels, might need to be addressed to improve nutrition.
PLEASE NOTE that POSHAN is regularly tracking data sources as they are released and updating the profiles accordingly.
POSHAN District Nutrition Profile_Jehanabad_BiharPOSHAN
POSHAN District Nutrition Profiles (DNPs) draw on diverse sources of data to compile a set of indicators on the state of nutrition and its cross-sectoral determinants. The profiles are intended to be conversation-starters at the district level and to enable discussions about why undernutrition levels are high, and which factors, at multiple levels, might need to be addressed to improve nutrition.
PLEASE NOTE that POSHAN is regularly tracking data sources as they are released and updating the profiles accordingly.
Johan Swinnen
POLICY SEMINAR
Agricultural and Food Systems Transformation for Better Food Security and Nutrition in Eurasia
Co-Organized by IFPRI, the World Bank, and CGIAR Research Program on Policies, Institutions, and Markets (PIM)
NOV 13, 2018 - 01:20 PM TO 02:20 PM EST
POSHAN District Nutrition Profile_Lakhisarai_BiharPOSHAN
POSHAN District Nutrition Profiles (DNPs) draw on diverse sources of data to compile a set of indicators on the state of nutrition and its cross-sectoral determinants. The profiles are intended to be conversation-starters at the district level and to enable discussions about why undernutrition levels are high, and which factors, at multiple levels, might need to be addressed to improve nutrition.
PLEASE NOTE that POSHAN is regularly tracking data sources as they are released and updating the profiles accordingly.
POSHAN District Nutrition Profile_Pashchimi Singhbhum_JharkhandPOSHAN
POSHAN District Nutrition Profiles (DNPs) draw on diverse sources of data to compile a set of indicators on the state of nutrition and its cross-sectoral determinants. The profiles are intended to be conversation-starters at the district level and to enable discussions about why undernutrition levels are high, and which factors, at multiple levels, might need to be addressed to improve nutrition.
PLEASE NOTE that POSHAN is regularly tracking data sources as they are released and updating the profiles accordingly.
Multi-Sectoral linkages to improve diet, nutrition and food security workIFPRIMaSSP
This Keynote address was presented by Dr. Alexander Kalimbira (Head of Nutrition Department at LUANAR) at the agriculture nutrition event on "Improving Food Security, Diets and Nutrition through Multisectoral Action" on 30 May, 2017 at Capital Hotel, Lilongwe.
Presented at the Pulses for Sustainable Agriculture and Human Health” on 31 May-1 June 2016 at NASC, New Delhi, India. The conference was jointly organised by the International Food Policy Research Institute (IFPRI), National Academy of Agricultural Sciences (NAAS), TCi of Cornell University (TCi-CU) and Agriculture Today.
POSHAN District Nutrition Profile_Jamui_BiharPOSHAN
POSHAN District Nutrition Profiles (DNPs) draw on diverse sources of data to compile a set of indicators on the state of nutrition and its cross-sectoral determinants. The profiles are intended to be conversation-starters at the district level and to enable discussions about why undernutrition levels are high, and which factors, at multiple levels, might need to be addressed to improve nutrition.
PLEASE NOTE that POSHAN is regularly tracking data sources as they are released and updating the profiles accordingly.
POSHAN District Nutrition Profile_Darbhanga_BiharPOSHAN
POSHAN District Nutrition Profiles (DNPs) draw on diverse sources of data to compile a set of indicators on the state of nutrition and its cross-sectoral determinants. The profiles are intended to be conversation-starters at the district level and to enable discussions about why undernutrition levels are high, and which factors, at multiple levels, might need to be addressed to improve nutrition.
PLEASE NOTE that POSHAN is regularly tracking data sources as they are released and updating the profiles accordingly.
Similar to Food consumption patterns and nutritional status in pakistan (20)
Presentation at the
International Food Policy Research Institute
Washington DC,
September 11th, 201
Dr Shakil Jehangir Malik
MBBS, MCPS(Psych), DPM (Eire), MCPS(Can),
Dip NLP(Lon), FRCPsych(Lon)
Senior Clinical Director & Consultant Psychiatrist
Sussex Partnership NHS Foundation & Teaching Trust
Senior Lecturer King’s College, University of Londo
Natural farming @ Dr. Siddhartha S. Jena.pptxsidjena70
A brief about organic farming/ Natural farming/ Zero budget natural farming/ Subash Palekar Natural farming which keeps us and environment safe and healthy. Next gen Agricultural practices of chemical free farming.
WRI’s brand new “Food Service Playbook for Promoting Sustainable Food Choices” gives food service operators the very latest strategies for creating dining environments that empower consumers to choose sustainable, plant-rich dishes. This research builds off our first guide for food service, now with industry experience and insights from nearly 350 academic trials.
Characterization and the Kinetics of drying at the drying oven and with micro...Open Access Research Paper
The objective of this work is to contribute to valorization de Nephelium lappaceum by the characterization of kinetics of drying of seeds of Nephelium lappaceum. The seeds were dehydrated until a constant mass respectively in a drying oven and a microwawe oven. The temperatures and the powers of drying are respectively: 50, 60 and 70°C and 140, 280 and 420 W. The results show that the curves of drying of seeds of Nephelium lappaceum do not present a phase of constant kinetics. The coefficients of diffusion vary between 2.09.10-8 to 2.98. 10-8m-2/s in the interval of 50°C at 70°C and between 4.83×10-07 at 9.04×10-07 m-8/s for the powers going of 140 W with 420 W the relation between Arrhenius and a value of energy of activation of 16.49 kJ. mol-1 expressed the effect of the temperature on effective diffusivity.
Artificial Reefs by Kuddle Life Foundation - May 2024punit537210
Situated in Pondicherry, India, Kuddle Life Foundation is a charitable, non-profit and non-governmental organization (NGO) dedicated to improving the living standards of coastal communities and simultaneously placing a strong emphasis on the protection of marine ecosystems.
One of the key areas we work in is Artificial Reefs. This presentation captures our journey so far and our learnings. We hope you get as excited about marine conservation and artificial reefs as we are.
Please visit our website: https://kuddlelife.org
Our Instagram channel:
@kuddlelifefoundation
Our Linkedin Page:
https://www.linkedin.com/company/kuddlelifefoundation/
and write to us if you have any questions:
info@kuddlelife.org
Willie Nelson Net Worth: A Journey Through Music, Movies, and Business Venturesgreendigital
Willie Nelson is a name that resonates within the world of music and entertainment. Known for his unique voice, and masterful guitar skills. and an extraordinary career spanning several decades. Nelson has become a legend in the country music scene. But, his influence extends far beyond the realm of music. with ventures in acting, writing, activism, and business. This comprehensive article delves into Willie Nelson net worth. exploring the various facets of his career that have contributed to his large fortune.
Follow us on: Pinterest
Introduction
Willie Nelson net worth is a testament to his enduring influence and success in many fields. Born on April 29, 1933, in Abbott, Texas. Nelson's journey from a humble beginning to becoming one of the most iconic figures in American music is nothing short of inspirational. His net worth, which estimated to be around $25 million as of 2024. reflects a career that is as diverse as it is prolific.
Early Life and Musical Beginnings
Humble Origins
Willie Hugh Nelson was born during the Great Depression. a time of significant economic hardship in the United States. Raised by his grandparents. Nelson found solace and inspiration in music from an early age. His grandmother taught him to play the guitar. setting the stage for what would become an illustrious career.
First Steps in Music
Nelson's initial foray into the music industry was fraught with challenges. He moved to Nashville, Tennessee, to pursue his dreams, but success did not come . Working as a songwriter, Nelson penned hits for other artists. which helped him gain a foothold in the competitive music scene. His songwriting skills contributed to his early earnings. laying the foundation for his net worth.
Rise to Stardom
Breakthrough Albums
The 1970s marked a turning point in Willie Nelson's career. His albums "Shotgun Willie" (1973), "Red Headed Stranger" (1975). and "Stardust" (1978) received critical acclaim and commercial success. These albums not only solidified his position in the country music genre. but also introduced his music to a broader audience. The success of these albums played a crucial role in boosting Willie Nelson net worth.
Iconic Songs
Willie Nelson net worth is also attributed to his extensive catalog of hit songs. Tracks like "Blue Eyes Crying in the Rain," "On the Road Again," and "Always on My Mind" have become timeless classics. These songs have not only earned Nelson large royalties but have also ensured his continued relevance in the music industry.
Acting and Film Career
Hollywood Ventures
In addition to his music career, Willie Nelson has also made a mark in Hollywood. His distinctive personality and on-screen presence have landed him roles in several films and television shows. Notable appearances include roles in "The Electric Horseman" (1979), "Honeysuckle Rose" (1980), and "Barbarosa" (1982). These acting gigs have added a significant amount to Willie Nelson net worth.
Television Appearances
Nelson's char
"Understanding the Carbon Cycle: Processes, Human Impacts, and Strategies for...MMariSelvam4
The carbon cycle is a critical component of Earth's environmental system, governing the movement and transformation of carbon through various reservoirs, including the atmosphere, oceans, soil, and living organisms. This complex cycle involves several key processes such as photosynthesis, respiration, decomposition, and carbon sequestration, each contributing to the regulation of carbon levels on the planet.
Human activities, particularly fossil fuel combustion and deforestation, have significantly altered the natural carbon cycle, leading to increased atmospheric carbon dioxide concentrations and driving climate change. Understanding the intricacies of the carbon cycle is essential for assessing the impacts of these changes and developing effective mitigation strategies.
By studying the carbon cycle, scientists can identify carbon sources and sinks, measure carbon fluxes, and predict future trends. This knowledge is crucial for crafting policies aimed at reducing carbon emissions, enhancing carbon storage, and promoting sustainable practices. The carbon cycle's interplay with climate systems, ecosystems, and human activities underscores its importance in maintaining a stable and healthy planet.
In-depth exploration of the carbon cycle reveals the delicate balance required to sustain life and the urgent need to address anthropogenic influences. Through research, education, and policy, we can work towards restoring equilibrium in the carbon cycle and ensuring a sustainable future for generations to come.
Food consumption patterns and nutritional status in pakistan
1. Food Consumption Patterns and Nutritional Status in Pakistan
By
Hina Nazli
AsmaShahzad
Amina Mehmood
October 2, 2014
2. Availability
Energy
Calories
Nutritional Status
Food Intake
Macro Nutrients
Protein
Carbohydrates
Fats
Micro Nutrients
Vitamins
Mineral
Production
Imports
Accessibility
Sustainability
Price
Income
FoodIntake (consumption patterns)
Food Consumption and Nutrition: Plan of Presentation
•Inadequate maternal health or child care practices
•Inadequate access to health care services, safe water and sanitation
3. Motivation
•PSSP (IFPRI) USAID funded set up to assist in building policy research capacity in Pakistan
•Agriculture, Rural Development, Poverty Reduction, Food Security and Nutrition are IFPRI areas of core competence globally and in Pakistan (1980s-90s)
•Analysis of existing data
•Generating own data
•Pakistan’s draft Agriculture and Food Security Policy aims to address the food and nutrition insecurities
•Pakistan Integrated Nutrition Strategy (PINS) aims to address the underlying causes of malnutrition (food diversification, WASH, school feeding, etc)
•Scaling Up Nutrition (SUN) program aims to identify the hurdles in access to food
•Issue of food security needs further research
•Little or no understanding in policy making of the determinants of food security and the relationship between food security, consumption behavior and nutritional outcomes
•Limited understanding and detailed analysis of nutritional status of the vulnerable and its variationacross gender and other demographic variables and other factors such as income and regional location etc
4. Data available to Examine Malnutrition in Pakistan
•Conducted by GOP
•Micro-nutrient Survey 1976-77 (Nutrition Cell, Planning and Development Division)
•National Nutrition Surveys (1985-87, 1991-94, 2000-01, 2010-11) (Aga Khan University’s Division of Women and Child Health, Pakistan’s Ministry of Health and UNICEF)
•Demographic and health survey (1990-91, 2006-07, 2012-13)(National Institute of Population Studies)
•Household Integrated Economic Survey (PBS)
•Conducted by research institutions
•IFPRI Panel Survey Years (1986-1991)
•World Bank/PIDE Pakistan Panel Household Survey (2001, 2004, 2010)
•PSSP (IFPRI) Rural Household Panel Survey (2012-2014)
5. Availability of Average Calories per capita per day based on Official Data
Source: GOP (2014), Economic Survey
1500
1700
1900
2100
2300
2500
2700
49-50
79-80
89-90
99-00
2003-04
2004-05
2005-06
2006-07
2007-08
2008-09
2009-10
2010-11
2011-12
Calories/capita/day
Calories per day
Minimum
6. Available and Consumed Calories (per capita per day) From Official Sources
0
500
1000
1500
2000
2500
3000
2001-02
2004-05
2005-06
2007-08
2010-11
Calories per capita per day
Available
Consumed
Source: GOP (2011)
7. Calorie Consumption Differs across Rural Urban Areas (based on Official Data)
1,950
2,000
2,050
2,100
2,150
2,200
2,250
2,300
2,350
2,400
Urban
Rural
Pakistan
CALORIES/AE/DAY
Source: HIES 2010-11
8. Low calorie consumption and high levels of poverty
Malik and Whitney (2014)
0
5
10
15
20
25
30
35
40
45
2001-02
2004-05
2005-06
2007-08
2010-11
POVERTY HEADCOUNT (%)
Urban
Rural
Pakistan
9. Calorie Consumption Differs across Poverty Status (based on Official Data)
Source: HIES 2010-11
0
500
1,000
1,500
2,000
2,500
3,000
Poor
Nonpoor
CALORIES/AE/DAY
Urban
Rural
Pakistan
10. 70% of food expenditure is spent on energy dense food based on Official Data(2010-11)
0
5
10
15
20
25
30
Dairy
Wheat
Oils
Sugars
Meats
SHARE OF FOOD EXPENDITURE (%)
Pakistan
Overall
Non-poor
Poor
0
5
10
15
20
25
30
Dairy
Wheat
Oils
Sugars
Meats
SHARE OF FOOD EXPENDITURE (%)
Urban areas
Overall
Non-poor
Poor
0
5
10
15
20
25
30
Dairy
Wheat
Oils
Sugars
Meats
SHARE OF FOOD EXPENDITURE (%)
Rural areas
Overall
Non-poor
Poor
Source: HIES 2010-11
11. Dietary Diversity in Rural Pakistan 2014 from PSSP Data: (% households reporting type of food items consumed in last 24 hours)
0
20
40
60
80
100
Wheat flour
Rice
Other cereals
Dairy products
Ghee/butter/oil
Sugar
Pulses
Dark green leafy vegetables
Vitamin A-rich vegetables
Tomato, onion, egg plant etc.
Roots and tubers (potatoes, turnip)
Fresh meat
Poultry
Eggs
Vitamin A-rich fruits
Other fruits
Spices, condiments
Source: RHPS (2014)
12. Food Frequency last seven days based on PSSP Data
0
1
2
3
4
5
6
7
Wheat flour
Rice
Other cereals
Dairy products
Ghee/butter/oil
Sugar
Pulses
Dark green leafy vegetables
Vitamin A-rich vegetables
Tomato, onion, egg plant etc.
Roots and tubers (potatoes, turnip)
Fresh meat
Poultry
Eggs
Vitamin A-rich fruits
Other fruits
Spices, condiments
Source: RHPS (2014)
13. Wheat is the major source of energy
0
10
20
30
40
50
60
Wheat
Oils
Dairy
Sugars
Meats
% SHARE IN TOTAL CALORIES
Overall
Non-Poor
Poor
Source: HIES 2010-11
14. Per Capita Availability and Consumption of Wheat
Source: GOP (2011)
0
20
40
60
80
100
120
140
2001-02
2004-05
2005-06
2006-07
2010-11
KG/capita/year
Available
Basket
Consumption
15. Sharp Increase in the Price of Wheat since 2007-08
0
5
10
15
20
25
30
35
2000-01
2001-02
2002-03
2003-04
2004-05
2005-06
2006-07
2007-08
2008-09
2009-10
2010-11
Rs/KG
Source: GOP (2014), Economic Survey 2013-14
16. The Kilograms of Wheat Flour that one Day’s Wages can Buy
0
5
10
15
20
25
30
35
2006
2007
2008
2009
2010
2011
2012
Kilograms of Flour per daily wage (Kgs)
Skilled Isamabad
Skilled Karachi
Skilled Lahore
Unskilled Islamabad
Unskilled Karachi
Unskilled Lahore
17. Calories consumed and the cost of calories – PSSP Study
Region or Population Group
Total Calories (per AE/day)
Food Expenditure (per AE/day) (Rs)
100 Calories cost Overall Food (Rs)
Calories from wheat (per AE/day)
Expenditure on Wheat (per AE/day) (Rs)
100 Calories cost from Wheat (Rs)
Rural Poor
1,882
36.8
1.95
1,007
8.2
0.81
Rural Non-Poor
2,664
67.0
2.52
1,208
7.7
0.64
Urban Poor
1,782
40.1
2.25
881
9.2
1.04
Urban Non-Poor
2,289
74.8
3.27
872
7.3
0.83
Pakistan
2,260
57.0
2.52
1,041
7.3
0.70
Source: Malik et al (2014), estimated from HIES (2010-11)
18. Change in Prices and Income and Demand for Wheat (2010-11): PSSP Study
Budget share on wheat
Expenditure elasticity
Own price uncompensated elasticity
Own price Compensated elasticity
Wheat-rice elasticity
Rural areas
18.6
0.79
-0.32
-0.209
0.006
Poor
22.9
0.84
-0.35
-0.165
-0.005
Non-poor
15.8
0.75
-0.35
-0.227
0.023
Urban areas
15.1
0.74
-0.31
-0.123
0.006
Poor
20.0
0.92
-0.36
-0.155
-0.001
Non-poor
11.8
0.67
-0.20
-0.107
-0.002
Pakistan
17.5
0.77
-0.32
-0.179
0.010
Poor
22.0
0.81
-0.21
-0.163
-0.012
Non-poor
14.5
0.76
-0.39
-0.173
0.021
Source: Malik et al (2014), estimated from HIES (2010-11)
20. Malnutrition among Women (BMI) based on official data
0
10
20
30
40
50
60
Underweight (<18.5)
Normal (18.5-24.9)
Overweight (25-29.9)
Obese (>29.9)
% WOMEN (15-49 YEARS)
Pakistan
Urban
Rural
Source: NNS 2010-11
21. Micronutrient Deficiency among Women (2001-2011) official data
0
10
20
30
40
50
60
Prevalence of Anemia
Vitamin A Deficiency
Zinc Deficiency
% WOMEN (15-49 YEARS)
Pakistan
2001
2011
0
10
20
30
40
50
60
Prevalence of Anemia
Vitamin A Deficiency
Zinc Deficiency
% WOMEN (15-49 YEARS)
Urban areas
2001
2011
0
10
20
30
40
50
60
Prevalence of Anemia
Vitamin A Deficiency
Zinc Deficiency
% WOMEN (15-49 YEARS)
Rural areas
2001
2011
Source: NNS 2010-11
22. Nutritional Intake among Women (24 hours food recall) official data
0
500
1000
1500
2000
2500
Energy(K.cal)
Protein (gm)
Fats (gm)
Carbohydrate (gm)
Calcium (mg)
Phosphorus (mg)
Iron (mg)
Zn (mg)
Vit.C (mg)
Pakistan
Pakistan
Recommended Allowance
0
500
1000
1500
2000
2500
Energy(K.cal)
Protein (gm)
Fats (gm)
Carbohydrate (gm)
Calcium (mg)
Phosphorus (mg)
Iron (mg)
Zn (mg)
Vit.C (mg)
Urban areas
0
500
1000
1500
2000
2500
Energy(K.cal)
Protein (gm)
Fats (gm)
Carbohydrate (gm)
Calcium (mg)
Phosphorus (mg)
Iron (mg)
Zn (mg)
Vit.C (mg)
Rural areas
Source: NNS 2010-11
23. Undernourished Females and Future Generation (World Bank, 2006)
•A malnourished woman is at higher risk of giving birth to an anemic or an underweight child (less than 2.5 kg)
•Such children have five times the risk of death in the first year and a high risk of growth failure during childhood
•Low birth weight may result in greater chronic diseases as an adult
•Severe iron deficiency anemia causes deaths during pregnancy and childbirth
•Iodine deficiency in pregnancy causes the birth of mentally impaired children
•Human and economic potential can be at risk by malnutrition
24. Results of Malnutrition
•Child mortality
•Low birth-weight babies (31.6% of live births in 2007) rank 3rdin 183 countries
•Under five mortality rate (89 per 1000 live births, 2008-2012)
•Infant mortality rate (74 per 1000 live births, 2008-2012)
•Neonatal mortality rate (55 per 1000 live births, 2008-2012)
•Disability
•About 2.65 % population was disabled in 2012 (based on the projections on 1998 Census), 2.54% was in 1998
•Of these, 43% are children (1-15 years)
•Of total disabled, 8.2% are blind, 7.5% deaf, 14% mentally retarded, 8.3% have multiple disabilities
•Probability of falling sick, loss in work days and income
Source: PDHS 2012-13
Source: UNICEF, State of the World's Children, Childinfo, and Demographic and Health Surveys by ICF International Source: Helping Hands for Relief and Development (2012). Persons with Disabilities (PWDs) Statistics in Pakistan 2012
25. Protein-Energy Malnutrition among Children official data (< 5 years of age) official data
0
10
20
30
40
50
60
70
1977
1985-87
1990
1990-94
2001
2011
% children
Underweight
Stunted
Wasted
Source: NNS 2010-11
26. Micronutrient Deficiency among Children (2001-2011) official data
0
10
20
30
40
50
60
70
Prevalence of Anemia
Vitamin A Deficiency
Zinc Deficiency
% CHILDREN
Pakistan
2001
2011
0
10
20
30
40
50
60
70
Prevalence of Anemia
Vitamin A Deficiency
Zinc Deficiency
% CHILDREN
Urban areas
2001
2011
0
10
20
30
40
50
60
70
Prevalence of Anemia
Vitamin A Deficiency
Zinc Deficiency
% CHILDREN
Rural areas
2001
2011
Source: NNS 2010-11
27. Nutritional Intake among Children 0-23 months(24 hours food recall) official data
0
200
400
600
800
1000
1200
Energy(K.cal)
Protein (gm)
Fats (gm)
Carbohydrate (gm)
Calcium (mg)
Phosphorus (mg)
Iron (mg)
Zn (mg)
Vit.C (mg)
Urban areas
0
200
400
600
800
1000
1200
Energy(K.cal)
Protein (gm)
Fats (gm)
Carbohydrate (gm)
Calcium (mg)
Phosphorus (mg)
Iron (mg)
Zn (mg)
Vit.C (mg)
Pakistan
Pakistan
Recommended Allowance
0
200
400
600
800
1000
1200
Energy(K.cal)
Protein (gm)
Fats (gm)
Carbohydrate (gm)
Calcium (mg)
Phosphorus (mg)
Iron (mg)
Zn (mg)
Vit.C (mg)
Rural areas
Source: NNS 2010-11
28. Mothers’ Knowledge about Child Nutrition (PSSP data)
23.59
25.59
14.06
0
5
10
15
20
25
30
Iron deficiency
Iodine Rich Food
Drinking Water Treatment
Percentage
Source: RHPS (2012)
29. Prevalence of Malnutrition (<–2SD) by Province and Rural Pakistan (2013)(PSSP Study)
40
46
23
35
41
22
52
59
28
31
38
16
0
10
20
30
40
50
60
70
Underweight
Stunting
Wasting
% CHILDREN
All Pakistan
Punjab
Sindh
KPK
Source: Shahzadet al. (2013)
30. Comparison of malnourished children in NNS 2011 and RHPS 2013 (PSSP Study)
33
46
16
40
46
23
0
5
10
15
20
25
30
35
40
45
50
Underweight
Stunted
Wasted
% CHILDREN
NNS 2011
RHPS 2013
Source: Shahzadet al. (2013)
31. Logistic Regression Analysis (PSSP Study)
•Dependent variables: HAZ, WAZ, WHZ
=1 if malnourished (z-score <-2), 0 otherwise
•Child characteristics: age and gender
•Mother Characteristics: age at child birth, literacy
•Household characteristics: number of siblings, nuclear family,farm household, flush toilet, and poverty status
•Community characteristics: distance from BHU, LHV/LHW
•Location characteristics: Sindh and KPK
32. Results of Logistic Regression (PSSP Study)
•Incidence of malnutrition among children under five is highest in Sindh
•Improving hygienic conditions appear important to reduce long term malnutrition (toilet facility and safe drinking water)
•Access to health care services plays a significant role in reducing the short-term nutrition (LHW)
•Mother’s education improves the general state of nutrition among children under five
•No significant effect of poverty status on malnutrition
33. Why is there no significant relationship between malnutrition and poverty? Because Child malnutrition is high across all expenditure quintiles (PSSP Study)
0
10
20
30
40
50
60
Underweight
Stunting
Wasting
% CHILDREN
1st quintile
2nd quintile
3rd quintile
4th quintile
5th quintile
Source: Shahzadet al. (2013)
34. PSSP Study: Poverty and malnutrition synonymous
•Overall levels of poverty are so high and calorie consumption is so low across the board that children in all expenditure categories are equally affected
•The data of RHPS (2013) shows that the average calories intake of 80 percent households (bottom 4 quintiles) is 2211 that is less than the recommended allowance of 2350 calories
•Poverty and malnutrition are determined by the same variables
•In fact malnutrition indicators are often used as a proxy for poverty in international studies (Reinhardand Wijayaratne, 2002; Setboonsarng, 2005; Heltberg, 2009; Klaver. 2010)
•The United Nation’s Millennium Development Goals conflate hunger and poverty in its first goal to “eradicate extreme poverty and hunger.” Undernourishment and malnutrition are among the indicators for this goal
35. Summing up
•Cereals, fats, sugars, and dairy products are the main sources of calories and macro-nutrients
•The consumption of micronutrient rich foods (vegetables and fruits) is very low
•Despite calorie-dense diet, average calorie consumption is lower than the recommended amount of 2350 or 2150 and is unbalanced in terms of micro- nutrients
•Wheat is the main source of calories, carbohydrate and fiber
•Little effect on the consumption of wheat with rising prices but at what cost (education, health care, etc.?)
•Focus of policies is on ensuring availability of wheat tonnage through production and import –limited action to other aspects such accessibility, sustainability and safety. That is why very little diversification away from four major crops.
36. Summing up
•Two main reasons of high prevalence of malnutrition in the country:
•Lack of resources at the household level to maintain the minimum daily allowance of essential nutrients; and
•Lack of awareness about balanced diet and maintaining good health
•Focus of previous research on estimating the numbers
•All the elements of Food Security not fully understood or integrated into policies
•Little work on understanding the linkages between food security, consumption behavior and nutritional outcomes and variations across socio-economic groups and regions
•Vey little prioritization or impact evaluation of any previous programs
37. Summing up
•Nutritional outcomes represent economic, health, education, demographic and cultural factors
•Nutritional Status is the most direct measure of the welfare of a people
•It can be measured directly and in physical terms
•not indirectly and through assumption based analysis such as those for money-metric measures of poverty which have proved very controversial in Pakistan
38. Some Recommendations
•Identification of malnourished population based on scientific method (mapping exercise)
•Strong and accessible database for analysis; consistency in measuring indicators
•Moving towards nutrition-sensitive agriculture
•Agricultural value chain
•Kitchen gardening
•Better storage facilities/techniques for agricultural products
•Improved infrastructure and well functioning institutions (credit, marketing, etc)
•Fortification and biofortification
•Creating awareness about nutritious diet (in schools, through media)
•Role of local institutions (e.g., LHW)
•Strengthen PINS and SUN through appropriate monitoring and evaluation
39. There is an urgent need for sound policy research and action
I was hungry,
and you formed a committee to investigate my hunger;
I was homeless,
and you filed a report on my plight;
I was sick,
and you held a seminar on the situation of the under-privileged;
You investigated all aspects of my plight
and yet I am still hungry, homeless and sick.