Downloaded 427 times


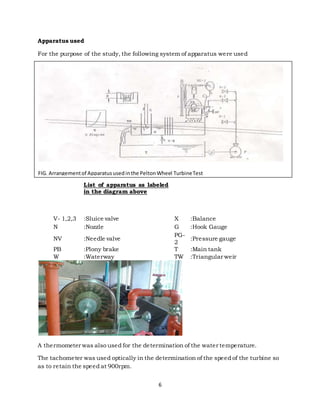


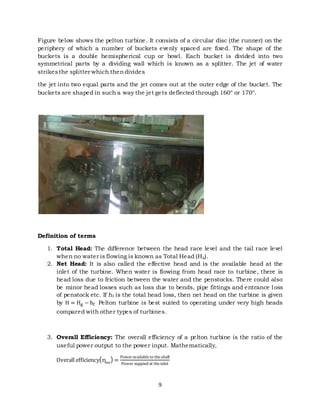


The document describes an experiment conducted to study the performance of a Pelton wheel turbine. The experiment varied the water discharge through the turbine while keeping the head constant. Measurements were taken of the turbine's power output and efficiency at different discharges. The results were analyzed and discussed to determine how the turbine's properties changed with discharge and if they agreed with theoretical predictions. The key components of a Pelton wheel turbine are also outlined, including the stationary nozzle, rotating buckets, and how water is directed by the nozzle onto the buckets.