Downloaded 839 times


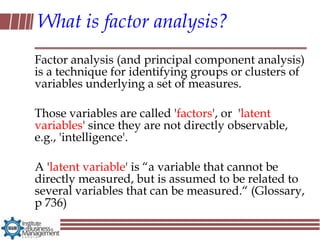
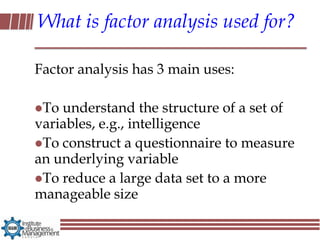
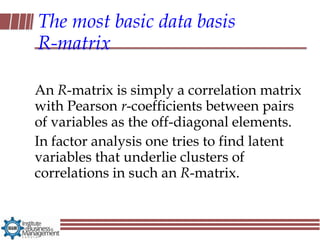
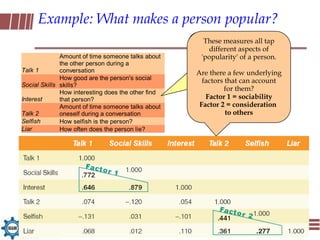
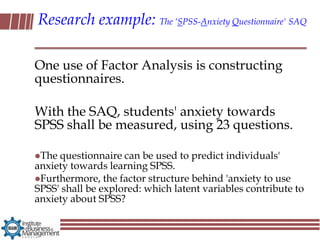
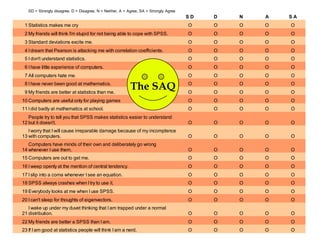
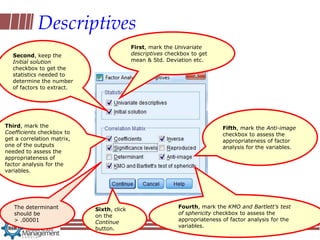
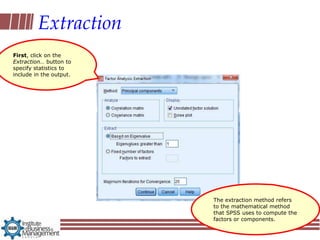
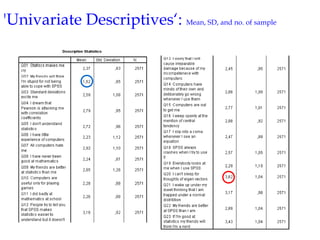
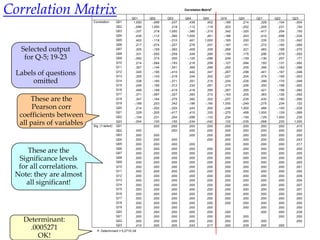
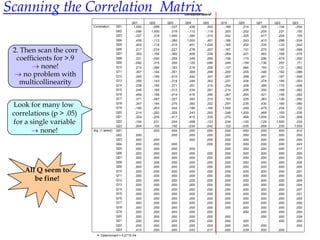
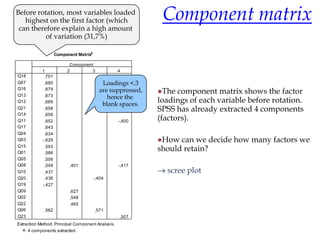
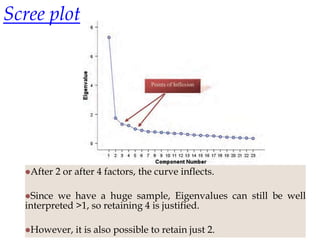
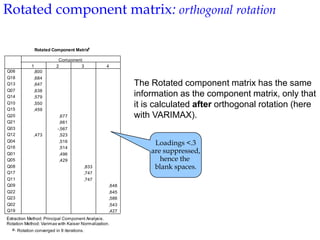
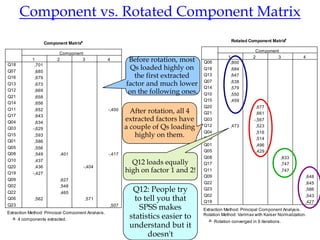

Exploratory factor analysis is a technique used to identify underlying factors or latent variables that explain the pattern of correlations within a set of observed variables. It has three main uses: to understand the structure of variables, to construct questionnaires, and to reduce large datasets. The example document describes constructing a questionnaire called the "SPSS-Anxiety Questionnaire" to measure anxiety towards learning the statistical software SPSS. It discusses initial considerations like sample size and data screening that are important before performing factor analysis.


