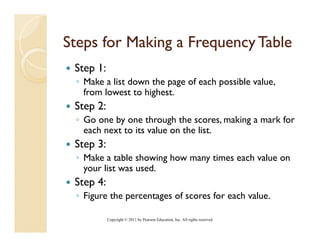
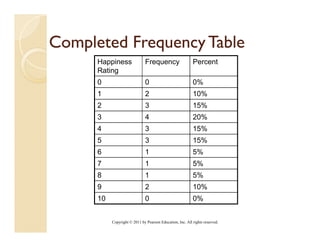
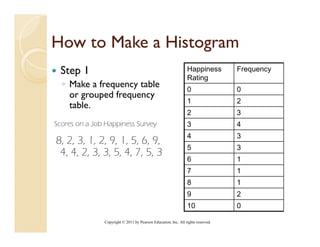
Statistics for the Behavioral and Social Sciences:
A Brief Course
Fifth Edition


Arthur Aron, Elaine N. Aron, Elliot Coups
       Aron,           Aron,


                                      Prepared by:
                                    Genna Hymowitz
                                 Stony Brook University
                                     y                y
              This multimedia product and its contents are protected under copyright law.
                                The following are prohibited by law:

        -any public performance or display, including transmission of any image over a network;
    -preparation of any derivative work, including the extraction, in whole or in part, of any images;
                              -any rental, lease, or lending of the program.
                                        l l          l di     f h


                   Copyright © 2011 by Pearson Education, Inc. All rights reserved.
Displaying the Order in a Group of Numbers
Using Tables and Graphs


                  Chapter 1


           Copyright © 2011 by Pearson Education, Inc. All rights reserved.
Chapter Outline
The Two Branches of Statistical Methods
Some Basic Concepts
Kinds of Variables
Frequency Tables
Histograms
Shapes of Frequency Distributions
   p          q    y
Frequency Tables and Histograms in Research
Articles


              Copyright © 2011 by Pearson Education, Inc. All rights reserved.
Why Learn Statistics?
 Increase your understanding of research
          y                g
 articles
 Help you learn how to do your own
   ep       ea   ow     o you ow
 research
 Can improve your reasoning and intuition
 ◦ Help you make sound decisions


       Copyright © 2011 by Pearson Education, Inc. All rights reserved.
What is Statistics?
 A branch of mathematics that focuses on the
 organization, analysis, and interpretation of a
 group of numbers
 Two Main Branches of Statistics
 ◦ descriptive statistics:
     used to summarize and describe a group of numbers from a
     research study
 ◦ inferential statistics:
     procedures for drawing conclusions based on the scores
     collected in a research study but going beyond them


          Copyright © 2011 by Pearson Education, Inc. All rights reserved.
Basic Concepts
           p
 Variable
 ◦ characteristic or condition that can have different
   values
     e.g., level of stress
     age
     Gender
 Value
 ◦ possible number or category a score can have
     e.g., 0–10
     35
     Male
 Score
 ◦ particular person’s value
     e.g., a study participant rates her current level of stress as a 5 on
     a scale of 0–10
                 0 10

            Copyright © 2011 by Pearson Education, Inc. All rights reserved.
Kinds of Variables
 Numeric (Quantitative)Variable
         (            )
 ◦ variable that has values that are numbers

 Nominal (Categorical)Variable
 ◦ variable that has values that are names or
   categories
    e.g., gender, religion, ethnicity
      g g             g             y


         Copyright © 2011 by Pearson Education, Inc. All rights reserved.
Level of Measurement
        Type of underlying numerical information
        provided by a measure
        ◦ equal-interval
              numeric variable in which differences between values
              correspond to differences in the underlying thing being
              measured
                interval – a scale in which the units of measurement
                (intervals) between the numbers are all equal in size but there
                is no absolute zero.
                  e.g. , intelligence, temperature
                ratio – in addition to order and equal units of measurement
                                                                measurement,
Not in text     there is an absolute zero that indicates an absence of the
                variable being measured.
                  e.g. , height, weight


                       Copyright © 2011 by Pearson Education, Inc. All rights reserved.
Level of Measurement
Type of underlying numerical information
provided by a measure
◦ rank-order (ordinal)
    numeric variable in which values correspond to the relative
                                                p
    position of things measured
    e.g., class standing, birth order, position in a race


          Copyright © 2011 by Pearson Education, Inc. All rights reserved.
Level of Measurement
Type of underlying numerical information
provided by a measure
◦ nominal
   variable in which values are categories
     e.g., gender, religion, ethnicity


             Copyright © 2011 by Pearson Education, Inc. All rights reserved.
How Are You Doing?
 You are conducting a study to evaluate how happy
 p p
 people are in their j
                     job.
     •     For this study, you ask people to indicate their job
           title.
1)       What is your variable of interest?
2)       Is your variable
           a) numeric
           b) nominal
                 i l
3)       What level of measurement are you using?
           a)   ratio
           b)   interval
           c)   rank-order variable
           d)   nominal


                   Copyright © 2011 by Pearson Education, Inc. All rights reserved.
How Are You Doing?
 You are conducting a study to evaluate how happy
 p p
 people are in their j .
                     job.
     •     For this study, you ask people to rate their level of
           happiness on a scale of 0–10.
1)       What is your variable of interest?
2)       Is your variable
           a) numeric
           b) nominal
                 i l
3)       What level of measurement are you using?
           a)   ratio
           b)   interval
           c)   rank-ordered
           d)   nominal


                   Copyright © 2011 by Pearson Education, Inc. All rights reserved.
How Are You Doing?
     You are conducting a study to evaluate how happy
     p p
     people are in their job.
                         j
      •     For this study, you ask people to rate their level of
            happiness as “very happy”, “happy”, “unhappy”, “very
            unhappy”.
1)        What is your variable of interest?
2)        Is your variable
            a)
             )   numeric
            b)   nominal
3)        What level of measurement are you using?
            a)
             )   ratio
            b)   interval
            c)   rank-ordered
            d)   nominal


                    Copyright © 2011 by Pearson Education, Inc. All rights reserved.
http://www.edugamer.net/app/playGame.asp
http://www edugamer net/app/playGame asp
  x?userGameId=4213
Frequency
 Given a set of numbers, how can we make
 sense of them?


    Scores on a Job Happiness Survey
 8, 2, 3, 1, 2, 9, 1, 5, 6, 9, 4, 4, 2, 3, 3, 5, 4, 7, 5, 3


         Copyright © 2011 by Pearson Education, Inc. All rights reserved.
Frequency
 Given a set of numbers, how can we make
 sense of them?
 ◦ frequency
    number of scores with a particular value
     If 5 students reported that their level of happiness on the
     job was a 2 on a 0–10 scale, the frequency for a rating of 2
     would b 5.
           ld be 5
 ◦ frequency table
     a table displaying the pattern of frequencies over
    different values


        Copyright © 2011 by Pearson Education, Inc. All rights reserved.
Steps for Making a Frequency Table
 Step 1:
 ◦ Make a list down the page of each possible value,
   from lowest to highest.
 Step 2:
 ◦ Go one by one through the scores, making a mark for
   each next to its value on the list.
 Step 3:
 ◦ Make a table showing how many times each value on
   your list was used
                 used.
 Step 4:
 ◦ Figure the percentages of scores for each value.

           Copyright © 2011 by Pearson Education, Inc. All rights reserved.
Frequency Table Step 1
 Your research study used a happiness scale that ranges from 0 (not
 at all happy) to 10 (extremely happy)
                                happy).
                         Happiness Rating


                         0
                         1
                         2
                         3
                         4
                         5
                         6
                         7
                         8
                         9
                         10


               Copyright © 2011 by Pearson Education, Inc. All rights reserved.
Frequency Table Step 2
     q    y          p
• Your study resulted in the following scores:
  •   823129156194423354753

                       Happiness                 Frequency
                       Rating                    Tally
                       0
                       1                         II
                       2                         III
                       3                         IIII
                       4                         III
                       5                         III
                       6                         I
                       7                         I
                       8                         I
                       9                         II
                       10

                   Copyright © 2011 by Pearson Education, Inc. All rights reserved.
Frequency Table Step 3
      Happiness               Frequency                    Frequency
      Rating                  Tally
      0                                                    0
      1                       II                           2
      2                       III                          3
      3                       IIII                         4
      4                       III                          3
      5                       III                          3
      6                       I                            1
      7                       I                            1
      8                       I                            1
      9                       II                           2
      10                                                   0


           Copyright © 2011 by Pearson Education, Inc. All rights reserved.
Frequency Table Step 4
 Figure the percentage of scores for each
 value.
 ◦ Take the frequency of the value divide it by the
                             value,
   total number of scores, and multiply by 100.


            Copyright © 2011 by Pearson Education, Inc. All rights reserved.
Completed Frequency Table
      Happiness               Frequency                    Percent
      Rating
      0                       0                            0%
      1                       2                            10%
      2                       3                            15%
                                                            5%
      3                       4                            20%
      4                       3                            15%
      5                       3                            15%
      6                       1                            5%
      7                       1                            5%
      8                       1                            5%
      9                       2                            10%
      10                      0                            0%


           Copyright © 2011 by Pearson Education, Inc. All rights reserved.
Another Example:

4        3         10

5        4         2

9        6         8

3        1         7

5        5         6

2        5         4

6        7         8

7        3         5
Frequency Tables for Nominal
Variables
 Follow the same four steps that you would
 for a numeric variable.
 ◦ Remember that the values in which you are
                                      y
   interested are names or categories rather than
   numbers.
    Major                      Frequency                         Percent
    Psychology                 5                                 25

    Sociology                  8                                 40

    Anthropology               3                                 15

    Political Science
    P liti l S i               4                                 20

             Copyright © 2011 by Pearson Education, Inc. All rights reserved.
Another Example:
 Psychology majors?
   y     gy j
 Sociology majors?
 CJ majors?
 Other majors?
Grouped Frequency Table
  A frequency table that uses intervals of values
  Lists the number of participants for each
  interval of values
  If the list of possible values ranges from 0 10 a
                  ossible al es ran es       0–10,
  possible set of intervals is:
   0–1
   2–3
   4–5
   6–7
   8–9
   10 11
   10–11

           Copyright © 2011 by Pearson Education, Inc. All rights reserved.
Histogram
 Graph of the information on a frequency
 table
 ◦ The height of each bar is the frequency of
   each value in the frequency table
                               table.


       Copyright © 2011 by Pearson Education, Inc. All rights reserved.
Histogram
 Graph of the information on a frequency
     p                            q    y
 table
 ◦ The height of each bar is the frequency of
          g                         q    y
   each value in the frequency table.
      8

      7

      6

      5

      4

      3

      2

      1

      0
               0        1       2        3       4       5        6          7   8   9   10

          Copyright © 2011 by Pearson Education, Inc. All rights reserved.
How to Make a Histogram
 Step 1                                                         Happiness         Frequency
                                                                Rating
  ◦ Make a frequency table                                      0                 0
    or grouped frequency
                                                                1                 2
    table.
                                                                2                 3
Scores on a Job Happiness Survey                                3                 4
                                                                4                 3
8, 2 3 1, 2 9, 1, 5 6, 9,
8 2, 3, 1 2, 9 1 5, 6 9
                                                                5                 3
 4, 4, 2, 3, 3, 5, 4, 7, 5, 3
                                                                6                 1
                                                                7                 1
                                                                8                 1
                                                                9                 2
                                                                10                0

               Copyright © 2011 by Pearson Education, Inc. All rights reserved.
How to Make a Histogram
 Step 2
 ◦ Put the values at the bottom of the page going from left to right,
    from l
    f    lowest to hi h
                   highest
 Step 3
 ◦ Make a scale of frequencies along the left edge of the page (0 will
    be
    b at the bottom and the highest value will be at the top).
           h b          d h hi h       l     ill b    h      )


      6

      5

      4

      3

      2

      1

      0
          0   1           2         3        4         5         6         7         8   9   10

                  Copyright © 2011 by Pearson Education, Inc. All rights reserved.
How to Make a Histogram
 Step 4
 ◦ Make a bar for each value.


     6


     5


     4


     3


     2


     1


     0
         0   1         2         3          4         5         6          7    8   9   10


             Copyright © 2011 by Pearson Education, Inc. All rights reserved.
Frequency Distributions
   Show the pattern of frequencies over the
   various values (how the frequencies are spread
   out).
       8


       7


       6


       5


       4


       3


       2


       1


       0
           0        1         2         3        4         5        6         7   8   9   10
           Copyright © 2011 by Pearson Education, Inc. All rights reserved.
Frequency Distributions

      8


      7


      6


      5


      4


      3


      2


      1


      0
          0       1         2        3         4        5         6          7   8   9   10


          Copyright © 2011 by Pearson Education, Inc. All rights reserved.
Frequency Distributions
   q    y
   Show the pattern of frequencies over the various values
   (how the frequencies are spread out).
   ◦ unimodal distribution - a histogram with one very high
     area


            8

            7

            6

            5

            4

            3

            2

            1

            0
                0        1        2       3        4        5        6       7     8   9   10
                Copyright © 2011 by Pearson Education, Inc. All rights reserved.
Frequency Distributions
   ◦ bimodal distribution
      a distribution with two fairly equal high points

      8


      7


      6


      5


      4


      3


      2


      1


      0
          0         1         2         3        4         5        6            7   8   9   10

              Copyright © 2011 by Pearson Education, Inc. All rights reserved.
Frequency Distributions
   ◦ multimodal distribution
      a distribution with two or more high points
      8


      7


      6


      5


      4


      3


      2


      1


      0
          0         1         2         3        4         5        6            7   8   9   10


              Copyright © 2011 by Pearson Education, Inc. All rights reserved.
Frequency Distributions
   ◦ rectangular distribution
        when all values h
         h    ll l      have approximately th same f
                                   i t l the       frequency


    3

    2

    1

    0
        0     1         2         3         4        5         6         7     8   9   10


            Copyright © 2011 by Pearson Education, Inc. All rights reserved.
Symmetrical and Skewed Distributions
 y
    In the social and behavioral sciences, most scores are
    symmetrically distributed.
    ◦ They have approximately the same number of scores on both
      sides of the distribution.


          8

          7

          6

          5

          4

          3

          2

          1

          0
                0        1        2        3         4        5        6         7   8   9   10

              Copyright © 2011 by Pearson Education, Inc. All rights reserved.
Symmetrical and Skewed Distributions
 y
   Skewed distributions are distributions where the
   scores pile up on one side of the middle.
   ◦ characterized b the side of th distribution where scores
      h     t i d by th id f the di t ib ti       h
     are more spread out (tail)
   ◦ negatively skewed distribution
       tail is to the left


           8

           7

           6

           5

           4

           3

           2

           1

           0
                0        1        2       3        4        5       6        7    8   9   10

               Copyright © 2011 by Pearson Education, Inc. All rights reserved.
Skewed Distributions

   positively skewed distribution
   ◦ tail is to the right

        8

        7

        6

        5

        4

        3

        2

        1

        0
            0       1        2       3        4        5       6        7          8   9   10


                Copyright © 2011 by Pearson Education, Inc. All rights reserved.
Floor and Ceiling Effects
   Floor Effect
   ◦ Scores pile toward the lower end of the
     distribution because it is not possible to have
     a lower score (e g number of children).
                    (e.g.,           children)

        8

        7

        6

        5

        4

        3

        2

        1

        0
            0      1        2       3        4        5       6        7       8   9   10

            Copyright © 2011 by Pearson Education, Inc. All rights reserved.
Floor and Ceiling Effects
   Ceiling Effect
         g
   ◦ Scores pile toward the upper end of the distribution
     because it is not possible to have a higher score (e.g.,
     scores on a very easy statistics t t)
                             t ti ti test).

         8

         7

         6

         5

         4

         3

         2

         1

         0
             0      1        2       3        4        5       6        7       8   9   10

             Copyright © 2011 by Pearson Education, Inc. All rights reserved.
Normal, Heavy-Tailed, and Light-Tailed
         Heavy-           Light-
Distributions
    Normal Curve
    ◦ bell-shaped, unimodal, and symmetrical
    Light-Tailed Distribution
    ◦ There are fe sc res in the tails (the tails are thin)
                few scores                            thin).
    Heavy-Tailed Distribution
    ◦ There are many scores in the tails (the tails are thick).


            Copyright © 2011 by Pearson Education, Inc. All rights reserved.
Key Points
  y
  Descriptive statistics are used to describe and summarize a group of numbers
  from a research study.
  A value is a number or category; a variable is a characteristic that can have
  different values; a score is a particular person’s value on the variable.
  Some numeric variables are rank-ordered and some variables are names or
  categories and not numbers.
  Af frequency table organizes the scores i
                  bl        i     h          into a table that li each possible
                                                      bl h lists      h     ibl
  value from lowest to highest along with the frequency of each value.
  A grouped frequency table is used when there are many different values.
  Intervals are given for a range of values.
  A histogram visually displays the information in a frequency table.
  The general shape of a histogram can be unimodal, bimodal, multimodal, or
  rectangular, and the distribution can be symmetrical, skewed to the right, or
  skewed to the left
                   left.
  Frequency tables, when used in research articles, are used to summarize the
  characteristics of study participants. Histograms almost never appear in
  articles, but the shapes of the distribution are sometimes described in words.


                Copyright © 2011 by Pearson Education, Inc. All rights reserved.

Aron chpt 1 ed (1)

  • 1.
    Statistics for theBehavioral and Social Sciences: A Brief Course Fifth Edition Arthur Aron, Elaine N. Aron, Elliot Coups Aron, Aron, Prepared by: Genna Hymowitz Stony Brook University y y This multimedia product and its contents are protected under copyright law. The following are prohibited by law: -any public performance or display, including transmission of any image over a network; -preparation of any derivative work, including the extraction, in whole or in part, of any images; -any rental, lease, or lending of the program. l l l di f h Copyright © 2011 by Pearson Education, Inc. All rights reserved.
  • 2.
    Displaying the Orderin a Group of Numbers Using Tables and Graphs Chapter 1 Copyright © 2011 by Pearson Education, Inc. All rights reserved.
  • 3.
    Chapter Outline The TwoBranches of Statistical Methods Some Basic Concepts Kinds of Variables Frequency Tables Histograms Shapes of Frequency Distributions p q y Frequency Tables and Histograms in Research Articles Copyright © 2011 by Pearson Education, Inc. All rights reserved.
  • 4.
    Why Learn Statistics? Increase your understanding of research y g articles Help you learn how to do your own ep ea ow o you ow research Can improve your reasoning and intuition ◦ Help you make sound decisions Copyright © 2011 by Pearson Education, Inc. All rights reserved.
  • 5.
    What is Statistics? A branch of mathematics that focuses on the organization, analysis, and interpretation of a group of numbers Two Main Branches of Statistics ◦ descriptive statistics: used to summarize and describe a group of numbers from a research study ◦ inferential statistics: procedures for drawing conclusions based on the scores collected in a research study but going beyond them Copyright © 2011 by Pearson Education, Inc. All rights reserved.
  • 6.
    Basic Concepts p Variable ◦ characteristic or condition that can have different values e.g., level of stress age Gender Value ◦ possible number or category a score can have e.g., 0–10 35 Male Score ◦ particular person’s value e.g., a study participant rates her current level of stress as a 5 on a scale of 0–10 0 10 Copyright © 2011 by Pearson Education, Inc. All rights reserved.
  • 7.
    Kinds of Variables Numeric (Quantitative)Variable ( ) ◦ variable that has values that are numbers Nominal (Categorical)Variable ◦ variable that has values that are names or categories e.g., gender, religion, ethnicity g g g y Copyright © 2011 by Pearson Education, Inc. All rights reserved.
  • 8.
    Level of Measurement Type of underlying numerical information provided by a measure ◦ equal-interval numeric variable in which differences between values correspond to differences in the underlying thing being measured interval – a scale in which the units of measurement (intervals) between the numbers are all equal in size but there is no absolute zero. e.g. , intelligence, temperature ratio – in addition to order and equal units of measurement measurement, Not in text there is an absolute zero that indicates an absence of the variable being measured. e.g. , height, weight Copyright © 2011 by Pearson Education, Inc. All rights reserved.
  • 9.
    Level of Measurement Typeof underlying numerical information provided by a measure ◦ rank-order (ordinal) numeric variable in which values correspond to the relative p position of things measured e.g., class standing, birth order, position in a race Copyright © 2011 by Pearson Education, Inc. All rights reserved.
  • 10.
    Level of Measurement Typeof underlying numerical information provided by a measure ◦ nominal variable in which values are categories e.g., gender, religion, ethnicity Copyright © 2011 by Pearson Education, Inc. All rights reserved.
  • 11.
    How Are YouDoing? You are conducting a study to evaluate how happy p p people are in their j job. • For this study, you ask people to indicate their job title. 1) What is your variable of interest? 2) Is your variable a) numeric b) nominal i l 3) What level of measurement are you using? a) ratio b) interval c) rank-order variable d) nominal Copyright © 2011 by Pearson Education, Inc. All rights reserved.
  • 12.
    How Are YouDoing? You are conducting a study to evaluate how happy p p people are in their j . job. • For this study, you ask people to rate their level of happiness on a scale of 0–10. 1) What is your variable of interest? 2) Is your variable a) numeric b) nominal i l 3) What level of measurement are you using? a) ratio b) interval c) rank-ordered d) nominal Copyright © 2011 by Pearson Education, Inc. All rights reserved.
  • 13.
    How Are YouDoing? You are conducting a study to evaluate how happy p p people are in their job. j • For this study, you ask people to rate their level of happiness as “very happy”, “happy”, “unhappy”, “very unhappy”. 1) What is your variable of interest? 2) Is your variable a) ) numeric b) nominal 3) What level of measurement are you using? a) ) ratio b) interval c) rank-ordered d) nominal Copyright © 2011 by Pearson Education, Inc. All rights reserved.
  • 14.
  • 15.
    Frequency Given aset of numbers, how can we make sense of them? Scores on a Job Happiness Survey 8, 2, 3, 1, 2, 9, 1, 5, 6, 9, 4, 4, 2, 3, 3, 5, 4, 7, 5, 3 Copyright © 2011 by Pearson Education, Inc. All rights reserved.
  • 16.
    Frequency Given aset of numbers, how can we make sense of them? ◦ frequency number of scores with a particular value If 5 students reported that their level of happiness on the job was a 2 on a 0–10 scale, the frequency for a rating of 2 would b 5. ld be 5 ◦ frequency table a table displaying the pattern of frequencies over different values Copyright © 2011 by Pearson Education, Inc. All rights reserved.
  • 17.
    Steps for Makinga Frequency Table Step 1: ◦ Make a list down the page of each possible value, from lowest to highest. Step 2: ◦ Go one by one through the scores, making a mark for each next to its value on the list. Step 3: ◦ Make a table showing how many times each value on your list was used used. Step 4: ◦ Figure the percentages of scores for each value. Copyright © 2011 by Pearson Education, Inc. All rights reserved.
  • 18.
    Frequency Table Step1 Your research study used a happiness scale that ranges from 0 (not at all happy) to 10 (extremely happy) happy). Happiness Rating 0 1 2 3 4 5 6 7 8 9 10 Copyright © 2011 by Pearson Education, Inc. All rights reserved.
  • 19.
    Frequency Table Step2 q y p • Your study resulted in the following scores: • 823129156194423354753 Happiness Frequency Rating Tally 0 1 II 2 III 3 IIII 4 III 5 III 6 I 7 I 8 I 9 II 10 Copyright © 2011 by Pearson Education, Inc. All rights reserved.
  • 20.
    Frequency Table Step3 Happiness Frequency Frequency Rating Tally 0 0 1 II 2 2 III 3 3 IIII 4 4 III 3 5 III 3 6 I 1 7 I 1 8 I 1 9 II 2 10 0 Copyright © 2011 by Pearson Education, Inc. All rights reserved.
  • 21.
    Frequency Table Step4 Figure the percentage of scores for each value. ◦ Take the frequency of the value divide it by the value, total number of scores, and multiply by 100. Copyright © 2011 by Pearson Education, Inc. All rights reserved.
  • 22.
    Completed Frequency Table Happiness Frequency Percent Rating 0 0 0% 1 2 10% 2 3 15% 5% 3 4 20% 4 3 15% 5 3 15% 6 1 5% 7 1 5% 8 1 5% 9 2 10% 10 0 0% Copyright © 2011 by Pearson Education, Inc. All rights reserved.
  • 23.
    Another Example: 4 3 10 5 4 2 9 6 8 3 1 7 5 5 6 2 5 4 6 7 8 7 3 5
  • 24.
    Frequency Tables forNominal Variables Follow the same four steps that you would for a numeric variable. ◦ Remember that the values in which you are y interested are names or categories rather than numbers. Major Frequency Percent Psychology 5 25 Sociology 8 40 Anthropology 3 15 Political Science P liti l S i 4 20 Copyright © 2011 by Pearson Education, Inc. All rights reserved.
  • 25.
    Another Example: Psychologymajors? y gy j Sociology majors? CJ majors? Other majors?
  • 26.
    Grouped Frequency Table A frequency table that uses intervals of values Lists the number of participants for each interval of values If the list of possible values ranges from 0 10 a ossible al es ran es 0–10, possible set of intervals is: 0–1 2–3 4–5 6–7 8–9 10 11 10–11 Copyright © 2011 by Pearson Education, Inc. All rights reserved.
  • 27.
    Histogram Graph ofthe information on a frequency table ◦ The height of each bar is the frequency of each value in the frequency table table. Copyright © 2011 by Pearson Education, Inc. All rights reserved.
  • 28.
    Histogram Graph ofthe information on a frequency p q y table ◦ The height of each bar is the frequency of g q y each value in the frequency table. 8 7 6 5 4 3 2 1 0 0 1 2 3 4 5 6 7 8 9 10 Copyright © 2011 by Pearson Education, Inc. All rights reserved.
  • 29.
    How to Makea Histogram Step 1 Happiness Frequency Rating ◦ Make a frequency table 0 0 or grouped frequency 1 2 table. 2 3 Scores on a Job Happiness Survey 3 4 4 3 8, 2 3 1, 2 9, 1, 5 6, 9, 8 2, 3, 1 2, 9 1 5, 6 9 5 3 4, 4, 2, 3, 3, 5, 4, 7, 5, 3 6 1 7 1 8 1 9 2 10 0 Copyright © 2011 by Pearson Education, Inc. All rights reserved.
  • 30.
    How to Makea Histogram Step 2 ◦ Put the values at the bottom of the page going from left to right, from l f lowest to hi h highest Step 3 ◦ Make a scale of frequencies along the left edge of the page (0 will be b at the bottom and the highest value will be at the top). h b d h hi h l ill b h ) 6 5 4 3 2 1 0 0 1 2 3 4 5 6 7 8 9 10 Copyright © 2011 by Pearson Education, Inc. All rights reserved.
  • 31.
    How to Makea Histogram Step 4 ◦ Make a bar for each value. 6 5 4 3 2 1 0 0 1 2 3 4 5 6 7 8 9 10 Copyright © 2011 by Pearson Education, Inc. All rights reserved.
  • 32.
    Frequency Distributions Show the pattern of frequencies over the various values (how the frequencies are spread out). 8 7 6 5 4 3 2 1 0 0 1 2 3 4 5 6 7 8 9 10 Copyright © 2011 by Pearson Education, Inc. All rights reserved.
  • 33.
    Frequency Distributions 8 7 6 5 4 3 2 1 0 0 1 2 3 4 5 6 7 8 9 10 Copyright © 2011 by Pearson Education, Inc. All rights reserved.
  • 34.
    Frequency Distributions q y Show the pattern of frequencies over the various values (how the frequencies are spread out). ◦ unimodal distribution - a histogram with one very high area 8 7 6 5 4 3 2 1 0 0 1 2 3 4 5 6 7 8 9 10 Copyright © 2011 by Pearson Education, Inc. All rights reserved.
  • 35.
    Frequency Distributions ◦ bimodal distribution a distribution with two fairly equal high points 8 7 6 5 4 3 2 1 0 0 1 2 3 4 5 6 7 8 9 10 Copyright © 2011 by Pearson Education, Inc. All rights reserved.
  • 36.
    Frequency Distributions ◦ multimodal distribution a distribution with two or more high points 8 7 6 5 4 3 2 1 0 0 1 2 3 4 5 6 7 8 9 10 Copyright © 2011 by Pearson Education, Inc. All rights reserved.
  • 37.
    Frequency Distributions ◦ rectangular distribution when all values h h ll l have approximately th same f i t l the frequency 3 2 1 0 0 1 2 3 4 5 6 7 8 9 10 Copyright © 2011 by Pearson Education, Inc. All rights reserved.
  • 38.
    Symmetrical and SkewedDistributions y In the social and behavioral sciences, most scores are symmetrically distributed. ◦ They have approximately the same number of scores on both sides of the distribution. 8 7 6 5 4 3 2 1 0 0 1 2 3 4 5 6 7 8 9 10 Copyright © 2011 by Pearson Education, Inc. All rights reserved.
  • 39.
    Symmetrical and SkewedDistributions y Skewed distributions are distributions where the scores pile up on one side of the middle. ◦ characterized b the side of th distribution where scores h t i d by th id f the di t ib ti h are more spread out (tail) ◦ negatively skewed distribution tail is to the left 8 7 6 5 4 3 2 1 0 0 1 2 3 4 5 6 7 8 9 10 Copyright © 2011 by Pearson Education, Inc. All rights reserved.
  • 40.
    Skewed Distributions positively skewed distribution ◦ tail is to the right 8 7 6 5 4 3 2 1 0 0 1 2 3 4 5 6 7 8 9 10 Copyright © 2011 by Pearson Education, Inc. All rights reserved.
  • 41.
    Floor and CeilingEffects Floor Effect ◦ Scores pile toward the lower end of the distribution because it is not possible to have a lower score (e g number of children). (e.g., children) 8 7 6 5 4 3 2 1 0 0 1 2 3 4 5 6 7 8 9 10 Copyright © 2011 by Pearson Education, Inc. All rights reserved.
  • 42.
    Floor and CeilingEffects Ceiling Effect g ◦ Scores pile toward the upper end of the distribution because it is not possible to have a higher score (e.g., scores on a very easy statistics t t) t ti ti test). 8 7 6 5 4 3 2 1 0 0 1 2 3 4 5 6 7 8 9 10 Copyright © 2011 by Pearson Education, Inc. All rights reserved.
  • 43.
    Normal, Heavy-Tailed, andLight-Tailed Heavy- Light- Distributions Normal Curve ◦ bell-shaped, unimodal, and symmetrical Light-Tailed Distribution ◦ There are fe sc res in the tails (the tails are thin) few scores thin). Heavy-Tailed Distribution ◦ There are many scores in the tails (the tails are thick). Copyright © 2011 by Pearson Education, Inc. All rights reserved.
  • 44.
    Key Points y Descriptive statistics are used to describe and summarize a group of numbers from a research study. A value is a number or category; a variable is a characteristic that can have different values; a score is a particular person’s value on the variable. Some numeric variables are rank-ordered and some variables are names or categories and not numbers. Af frequency table organizes the scores i bl i h into a table that li each possible bl h lists h ibl value from lowest to highest along with the frequency of each value. A grouped frequency table is used when there are many different values. Intervals are given for a range of values. A histogram visually displays the information in a frequency table. The general shape of a histogram can be unimodal, bimodal, multimodal, or rectangular, and the distribution can be symmetrical, skewed to the right, or skewed to the left left. Frequency tables, when used in research articles, are used to summarize the characteristics of study participants. Histograms almost never appear in articles, but the shapes of the distribution are sometimes described in words. Copyright © 2011 by Pearson Education, Inc. All rights reserved.