Download to read offline

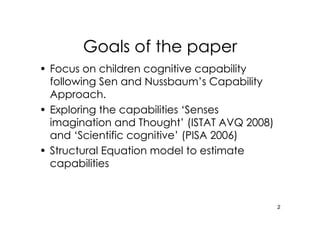
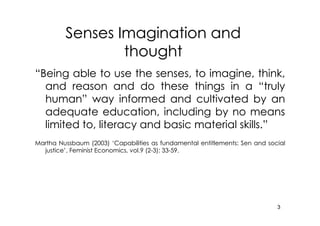
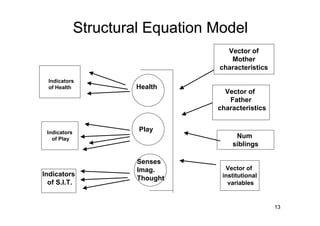
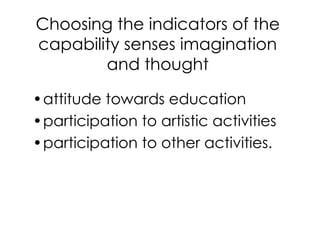

The paper examines children's cognitive capabilities by applying the capability approach of Sen and Nussbaum, focusing on the senses of imagination, thought, and scientific cognitive skills. It highlights Italy's low ranking in children's educational well-being and employs structural equation modeling to analyze various factors influencing child development. The study utilizes data from ISTAT and PISA surveys to investigate the relationships between educational factors, regional variability, and gender disparities in capabilities.