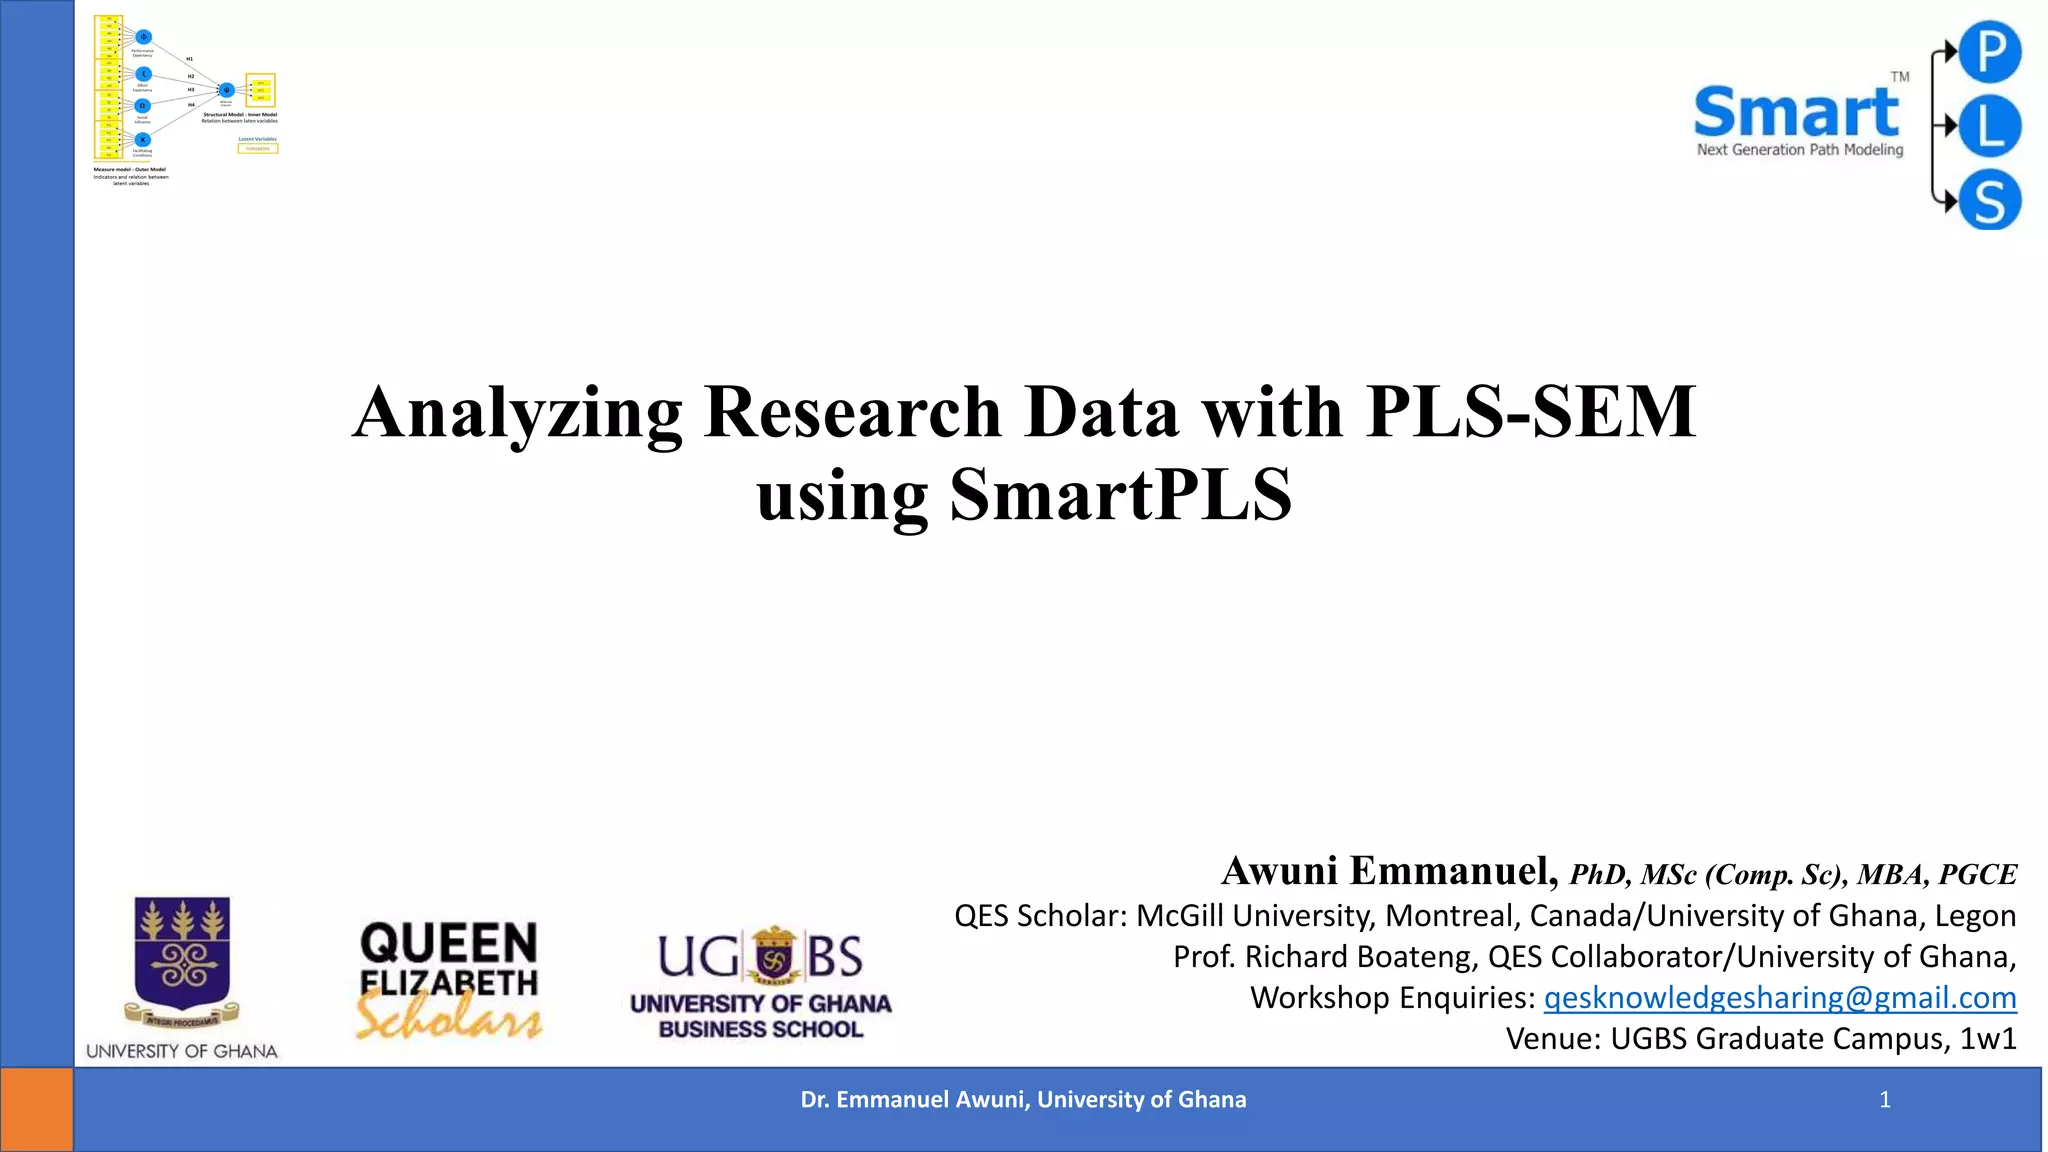
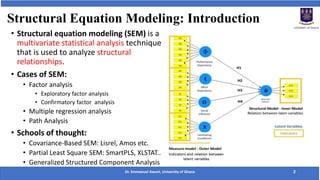
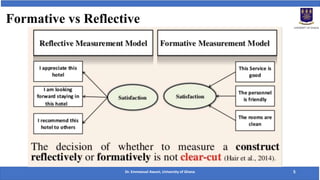
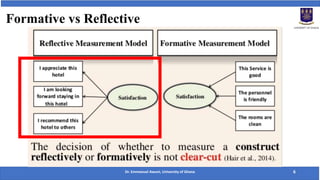
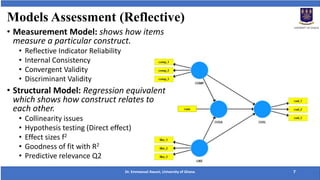
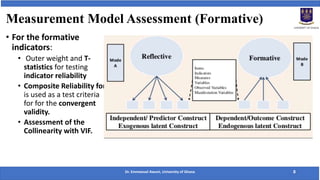
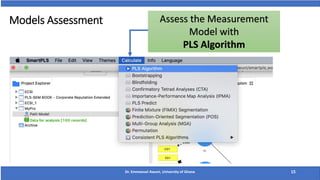
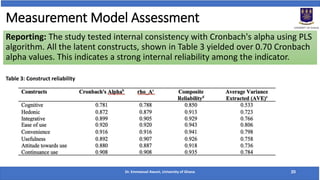
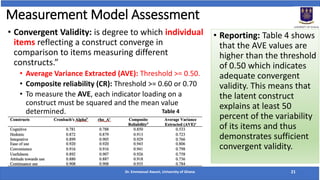
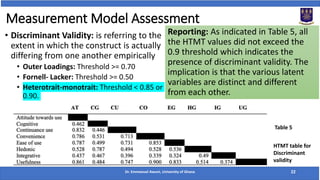
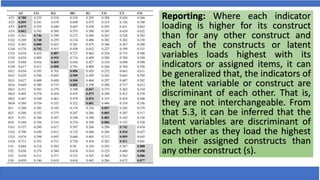
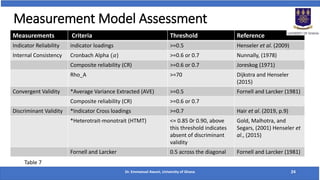
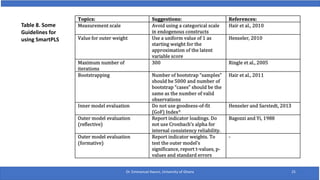
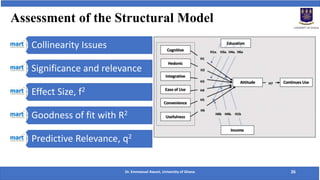
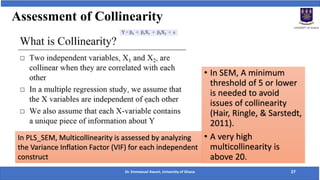
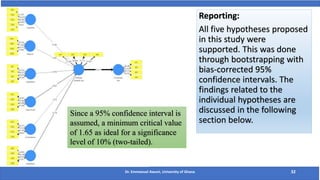
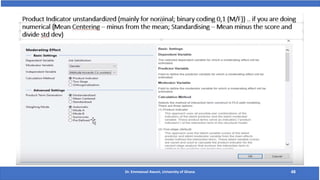
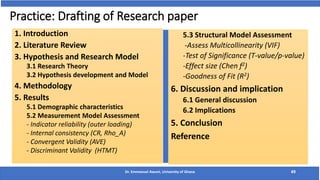
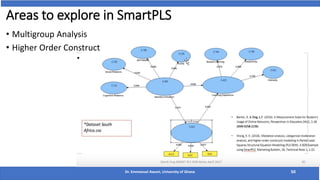
Analyzing Research Data with PLS-SEM
using SmartPLS
Awuni Emmanuel, PhD, MSc (Comp. Sc), MBA, PGCE
QES Scholar: McGill University, Montreal, Canada/University of Ghana, Legon
Prof. Richard Boateng, QES Collaborator/University of Ghana,
Workshop Enquiries: qesknowledgesharing@gmail.com
Venue: UGBS Graduate Campus, 1w1
Dr. Emmanuel Awuni, University of Ghana 1
Structural Equation Modeling: Introduction
• Structural equation modeling (SEM) is a
multivariate statistical analysis technique
that is used to analyze structural
relationships.
• Cases of SEM:
• Factor analysis
• Exploratory factor analysis
• Confirmatory factor analysis
• Multiple regression analysis
• Path Analysis
• Schools of thought:
• Covariance-Based SEM: Lisrel, Amos etc.
• Partial Least Square SEM: SmartPLS, XLSTAT..
• Generalized Structured Component Analysis
Dr. Emmanuel Awuni, University of Ghana 2
Dr. Emmanuel Awuni, University of Ghana 3
Developers
of SmartPLS
for PLS_SEM
Model Element
Dr. Emmanuel Awuni, University of Ghana 4
Formative vs Reflective
Dr. Emmanuel Awuni, University of Ghana 5
Formative vs Reflective
Dr. Emmanuel Awuni, University of Ghana 6
Models Assessment (Reflective)
• Measurement Model: shows how items
measure a particular construct.
• Reflective Indicator Reliability
• Internal Consistency
• Convergent Validity
• Discriminant Validity
• Structural Model: Regression equivalent
which shows how construct relates to
each other.
• Collinearity issues
• Hypothesis testing (Direct effect)
• Effect sizes f2
• Goodness of fit with R2
• Predictive relevance Q2
Dr. Emmanuel Awuni, University of Ghana 7
Measurement Model Assessment (Formative)
• For the formative
indicators:
• Outer weight and T-
statistics for testing
indicator reliability
• Composite Reliability for
is used as a test criteria
for for the convergent
validity.
• Assessment of the
Collinearity with VIF.
Dr. Emmanuel Awuni, University of Ghana 8
SmartPLS: An overview
• WHY PLS?
• The sample size is small and/or the data are
non-normally distributed.
• PLS enhances sampling distribution to
approach normality
• For theory development and prediction
• Models can use fewer indicators (1 or 2
• Model can(up to 50+)
• All variances including errors are useful for
testing the causal relationships.
SmartPLS is a software with
graphical user interface for
variance-based structural
equation modeling using the
Partial Least Squares path
modeling method.
Dr. Emmanuel Awuni, University of Ghana 9
Dr. Emmanuel Awuni, University of Ghana 10
1. First: Download and
Install Java Runtime
>>Download
SmartPLS
https://www.smartpls.com/downloads
Dr. Emmanuel Awuni, University of Ghana 11
>>Download
SmartPLS
https://www.smartpls.com/downloads
Dr. Emmanuel Awuni, University of Ghana 12
Dr. Emmanuel Awuni, University of Ghana 13
Dr. Emmanuel Awuni, University of Ghana 14
Conceptual Model
for Effect of
Gratification on
user attitude and
continuance use of
Mobile Money
services in Ghana
using Uses and
Gratification Theory
with income and
Education as a
Moderating factors.
Example of a Conceptual Model
Dr. Emmanuel Awuni, University of Ghana 15
Assess the Measurement
Model with
PLS Algorithm
Models Assessment
Measurement Model Assessment
• Indicator Reliability : is the
proportion of Indicator
variance that is explained by
the Latent variable.
• Criterion: Outer loading:
Threshold> .70
• Indicator reliability is the extent
to which a variable or set of
variables is consistent regarding
what it intends to measure.
Dr. Emmanuel Awuni, University of Ghana 16
• Click on the outer loading after running
the PLS algorithm
• Click on the Construct Reliability and
validly for all the measurements regarding
the measurement assessment
Dr. Emmanuel Awuni, University of Ghana 17
Measurement Model Assessment
Dr. Emmanuel Awuni, University of Ghana 18
Reporting Indicator Reliability: The
study assessed indicator loading using
PLS algorithm. The result, as indicated
in Table 1, shows all the indicators
loaded well into their construct.
However, CG3 was deleted after first
running the PLS algorithms. This is
because the indicator loaded weakly
below the 0.70 threshold.
Table 1
Measurement Model Assessment
• Internal Consistency: refers to the general agreement between
multiple items (often Likert scale items) that make-up a composite
score of a survey measurement of a given construct.
• This agreement is generally measured by the correlation between
items.
Dr. Emmanuel Awuni, University of Ghana 19
CRITERIA
Threshold:
• Cronbach alpha (𝛼): Threshold> .70
• Composite Reliability (CR):
Threshold> .70
Table 2
Measurement Model Assessment
Dr. Emmanuel Awuni, University of Ghana 20
Reporting: The study tested internal consistency with Cronbach's alpha using PLS
algorithm. All the latent constructs, shown in Table 3 yielded over 0.70 Cronbach
alpha values. This indicates a strong internal reliability among the indicator.
Table 3: Construct reliability
Measurement Model Assessment
• Convergent Validity: is degree to which individual
items reflecting a construct converge in
comparison to items measuring different
constructs.”
• Average Variance Extracted (AVE): Threshold >= 0.50.
• Composite reliability (CR): Threshold >= 0.60 or 0.70
• To measure the AVE, each indicator loading on a
construct must be squared and the mean value
determined.
Dr. Emmanuel Awuni, University of Ghana 21
• Reporting: Table 4 shows
that the AVE values are
higher than the threshold
of 0.50 which indicates
adequate convergent
validity. This means that
the latent construct
explains at least 50
percent of the variability
of its items and thus
demonstrates sufficient
convergent validity.
Table 4
Measurement Model Assessment
• Discriminant Validity: is referring to the
extent in which the construct is actually
differing from one another empirically
• Outer Loadings: Threshold >= 0.70
• Fornell- Lacker: Threshold >= 0.50
• Heterotrait-monotrait: Threshold < 0.85 or
0.90.
Dr. Emmanuel Awuni, University of Ghana 22
Reporting: As indicated in Table 5, all
the HTMT values did not exceed the
0.9 threshold which indicates the
presence of discriminant validity. The
implication is that the various latent
variables are distinct and different
from each other.
HTMT table for
Discriminant
validity
Table 5
Dr. Emmanuel Awuni, University of Ghana 23
Reporting: Where each indicator
loading is higher for its construct
than for any other construct and
each of the constructs or latent
variables loads highest with its
indicators or assigned items, it can
be generalized that, the indicators of
the latent variable or construct are
discriminant of each other. That is,
they are not interchangeable. From
that 5.3, it can be inferred that the
latent variables are discriminant of
each other as they load the highest
on their assigned constructs than
any other construct (s).
Measurement Model Assessment
Measurements Criteria Threshold Reference
Indicator Reliability indicator loadings >=0.5 Henseler et al. (2009)
Internal Consistency Cronbach Alpha (𝛼) >=0.6 or 0.7 Nunnally, (1978)
Composite reliability (CR) >=0.6 or 0.7 Joreskog (1971)
Rho_A >=70 Dijkstra and Henseler
(2015)
Convergent Validity *Average Variance Extracted (AVE) >=0.5 Fornell and Larcker (1981)
Composite reliability (CR) >=0.6 or 0.7
Discriminant Validity *Indicator Cross loadings >=0.7 Hair et al. (2019, p.9)
*Heterotrait-monotrait (HTMT) <= 0.85 0r 0.90, above
this threshold indicates
absent of discriminant
validity
Gold, Malhotra, and
Segars, (2001) Henseler et
al., (2015)
Fornell and Larcker 0.5 across the diagonal Fornell and Larcker (1981)
Dr. Emmanuel Awuni, University of Ghana 24
Table 7
Dr. Emmanuel Awuni, University of Ghana 25
Table 8. Some
Guidelines for
using SmartPLS
Assessment of the Structural Model
Dr. Emmanuel Awuni, University of Ghana 26
Collinearity Issues
Significance and relevance
Effect Size, f2
Goodness of fit with R2
Predictive Relevance, q2
Assessment of Collinearity
• In SEM, A minimum
threshold of 5 or lower
is needed to avoid
issues of collinearity
(Hair, Ringle, & Sarstedt,
2011).
• A very high
multicollinearity is
above 20.
In PLS_SEM, Multicollinearity is assessed by analyzing
the Variance Inflation Factor (VIF) for each independent
construct
Dr. Emmanuel Awuni, University of Ghana 27
Assessing Multicollinearity
• After running the PLS algorithm click on the VIF beneath.
Dr. Emmanuel Awuni, University of Ghana 28
From Table 9, all VIF values are below the value of 5, indicating that there
are no issues with collinearity. That latent variables are independent of each
other and that change in one does not affect the other variables and vice
versa.
Reporting Multicollinearity
Dr. Emmanuel Awuni, University of Ghana 29
Table 9
Hypothesis testing: Bootstrapping for Direct effect
• Bootstrap estimates the spread, shape and bias of the sampling distribution
of the population from which the sample under study is drawn from.
Bootstrapping is
non-parametric
procedure that
allows testing
the statistical
significance of
various
PLS_SEM results
such as Path co-
efficient etc.
Dr. Emmanuel Awuni, University of Ghana 30
Reporting test of significance (Direct effect)
In order to test the hypothesis for significance,
bootstrapping procedure is performed using a two-tailed t-
distribution. The bootstrapping was run using 5000
iterations (subsamples). The result is presented in Table 9.
NOTE:
Sample mean
after the running
bootstrapping
algorithm is the
Standardized beta
(std. beta)
Standard
deviation after the
running
bootstrapping
algorithm is the
standard error
(std. error) on the
table.
Dr. Emmanuel Awuni, University of Ghana 31
Table 9
Reporting:
All five hypotheses proposed
in this study were
supported. This was done
through bootstrapping with
bias-corrected 95%
confidence intervals. The
findings related to the
individual hypotheses are
discussed in the following
section below.
Since a 95% confidence interval is
assumed, a minimum critical value
of 1.65 as ideal for a significance
level of 10% (two-tailed).
Dr. Emmanuel Awuni, University of Ghana 32
Effect Size, Cohen’s f2
Dr. Emmanuel Awuni, University of Ghana 33
• The effect size shows how much an exogenous
latent variable contributes to an endogenous
latent variable’s R2 value.
• In simple terms, effect size assesses the
magnitude or strength of relationship between
the latent variables.
• Effect size helps researchers to assess the overall
contribution of a research study.
Dr. Emmanuel Awuni, University of Ghana 34
Run the PLS Algorithm
Algorithm for the effect
size and make changes
here to give your results
on the indirect effect
Effect Size, Cohen’s f2
Reporting: From Table 10, the independent constructs such as cognitive,
convenience, ease of use, hedonic and integrative are found to have a small
effect on attitude towards use. In addition, usefulness as an independent
construct has a moderating effect on Attitude towards use. Attitude towards
use is termed to have a large effect on continuance use intention.
Dr. Emmanuel Awuni, University of Ghana 35
Table 10
Assessing Goodness of Fit with R-Squared
Dr. Emmanuel Awuni, University of Ghana 36
• The assessment of the goodness of fit
indicates whether the model is well-fitted or
ill-fitted.
• The GOF test helps the researcher to identify
misspecifications of the measurement and
structural model.
• R2 measures the model’s explanatory power.
• It represents the combined effects of the
exogenous latent variables on the
endogenous latent variable.
• R2 varies from 0 to 1
0.25: weak
0.50: moderate
0.75: Strong or
substantial
Assessing Goodness of Fit with R-Squared
Dr. Emmanuel Awuni, University of Ghana 37
Find the R2
Reporting Goodness of Fit
Dr. Emmanuel Awuni, University of Ghana 38
• From Table 11, the R2 of the model
is 0.649 and 0.556. This implies that
the combined exogenous latent
variables account for 65%
endogenous factor variations
(Attitude) and and 56% of the
Attitude on continuance use. This
indicates that the model is well
fitted given that it is beyond the
acceptable threshold of 0.5.
Table 11
Mediation
Dr. Emmanuel Awuni, University of Ghana 39
• Direct Effect: Relationship linking two constructs with a single arrow
• Indirect Effect (also Mediating effect): A sequence of relationships with at
least one intervening construct involved
Students IQ
Classroom
Academic
performance
x1
x2 x3
Mediation
• Mediation explains the relationship between the
constructs/latent variables (exogeneous and endogenous)
• Conditions:
• Exogeneous variations account for the variations in
endogenous construct
• Exogeneous variations account for the variations in Mediator
• Mediator accounts for the variations in endogenous construct
• When mediator is added to the model the relationship
between the Exogeneous and endogenous constructs
decreases.
Dr. Emmanuel Awuni, University of Ghana 40
Mediating Effect
Dr. Emmanuel Awuni, University of Ghana 41
Run the Bootstrapping
Algorithm for the
Mediating effect and
make changes here to
give your results on the
indirect effect
Moderation
• Moderation changes the strength or direction of the relationship between
the constructs/latent variables (exogeneous and endogenous).
• They do not explain why there is a relationship between the constructs.
Dr. Emmanuel Awuni, University of Ghana 42
Hedonic Hedonic
Income Education Gender
• Does income increase or decrease the relationship between hedonic and Attitude
• Does education increase or decrease the relationship between hedonic and Attitude
• Does Gender play role in the relationship between hedonic and Attitude
Moderation
• Two types:
• Categorical moderation
• Continuous moderation
Dr. Emmanuel Awuni, University of Ghana 43
Moderation Effect
Dr. Emmanuel Awuni, University of Ghana 44
1. Add the moderating variable by
connecting formatively to the
dependent variable.
2. Run the Bootstrapping Algorithm
for the Moderating effect
Moderation Effect
Dr. Emmanuel Awuni, University of Ghana 45
1. Add the moderating variable
by connecting formatively to
the dependent variable.
2. Right click on the dependent
variable and select
moderating effect.
3. Make changes to add the
moderating effect.
4. If the variable is Categorical
make these changes in the
figure.
5. Run the Bootstrapping
Algorithm for the
Moderating effect
Moderation Effect
Dr. Emmanuel Awuni, University of Ghana 46
1. If the variable is Categorical
make these changes in the
figure.
2. After that run the
Bootstrapping Algorithm for
the Moderating effect
Mediating Effect
Dr. Emmanuel Awuni, University of Ghana 47
Run the
Bootstrapping
Algorithm for
the
Moderating
effect
Dr. Emmanuel Awuni, University of Ghana 48
Practice: Drafting of Research paper
1. Introduction
2. Literature Review
3. Hypothesis and Research Model
3.1 Research Theory
3.2 Hypothesis development and Model
4. Methodology
5. Results
5.1 Demographic characteristics
5.2 Measurement Model Assessment
- Indicator reliability (outer loading)
- Internal consistency (CR, Rho_A)
- Convergent Validity (AVE)
- Discriminant Validity (HTMT)
Dr. Emmanuel Awuni, University of Ghana 49
5.3 Structural Model Assessment
-Assess Multicollinearity (VIF)
-Test of Significance (T-value/p-value)
-Effect size (Chen f2)
-Goodness of Fit (R2)
6. Discussion and implication
6.1 General discussion
6.2 Implications
5. Conclusion
Reference
Areas to explore in SmartPLS
• Multigroup Analysis
• Higher Order Construct
Dr. Emmanuel Awuni, University of Ghana 50
Areas to Explore in SmartPLS
Analyzing Data with
Data Mining and Machine Learning
Dr. Emmanuel Awuni, University of Ghana 51
Dr. Emmanuel Awuni, University of Ghana 52

Doing Research with PLS_SEM using SmartPLS

  • 1.
    Analyzing Research Datawith PLS-SEM using SmartPLS Awuni Emmanuel, PhD, MSc (Comp. Sc), MBA, PGCE QES Scholar: McGill University, Montreal, Canada/University of Ghana, Legon Prof. Richard Boateng, QES Collaborator/University of Ghana, Workshop Enquiries: qesknowledgesharing@gmail.com Venue: UGBS Graduate Campus, 1w1 Dr. Emmanuel Awuni, University of Ghana 1
  • 2.
    Structural Equation Modeling:Introduction • Structural equation modeling (SEM) is a multivariate statistical analysis technique that is used to analyze structural relationships. • Cases of SEM: • Factor analysis • Exploratory factor analysis • Confirmatory factor analysis • Multiple regression analysis • Path Analysis • Schools of thought: • Covariance-Based SEM: Lisrel, Amos etc. • Partial Least Square SEM: SmartPLS, XLSTAT.. • Generalized Structured Component Analysis Dr. Emmanuel Awuni, University of Ghana 2
  • 3.
    Dr. Emmanuel Awuni,University of Ghana 3 Developers of SmartPLS for PLS_SEM
  • 4.
    Model Element Dr. EmmanuelAwuni, University of Ghana 4
  • 5.
    Formative vs Reflective Dr.Emmanuel Awuni, University of Ghana 5
  • 6.
    Formative vs Reflective Dr.Emmanuel Awuni, University of Ghana 6
  • 7.
    Models Assessment (Reflective) •Measurement Model: shows how items measure a particular construct. • Reflective Indicator Reliability • Internal Consistency • Convergent Validity • Discriminant Validity • Structural Model: Regression equivalent which shows how construct relates to each other. • Collinearity issues • Hypothesis testing (Direct effect) • Effect sizes f2 • Goodness of fit with R2 • Predictive relevance Q2 Dr. Emmanuel Awuni, University of Ghana 7
  • 8.
    Measurement Model Assessment(Formative) • For the formative indicators: • Outer weight and T- statistics for testing indicator reliability • Composite Reliability for is used as a test criteria for for the convergent validity. • Assessment of the Collinearity with VIF. Dr. Emmanuel Awuni, University of Ghana 8
  • 9.
    SmartPLS: An overview •WHY PLS? • The sample size is small and/or the data are non-normally distributed. • PLS enhances sampling distribution to approach normality • For theory development and prediction • Models can use fewer indicators (1 or 2 • Model can(up to 50+) • All variances including errors are useful for testing the causal relationships. SmartPLS is a software with graphical user interface for variance-based structural equation modeling using the Partial Least Squares path modeling method. Dr. Emmanuel Awuni, University of Ghana 9
  • 10.
    Dr. Emmanuel Awuni,University of Ghana 10 1. First: Download and Install Java Runtime >>Download SmartPLS https://www.smartpls.com/downloads
  • 11.
    Dr. Emmanuel Awuni,University of Ghana 11 >>Download SmartPLS https://www.smartpls.com/downloads
  • 12.
    Dr. Emmanuel Awuni,University of Ghana 12
  • 13.
    Dr. Emmanuel Awuni,University of Ghana 13
  • 14.
    Dr. Emmanuel Awuni,University of Ghana 14 Conceptual Model for Effect of Gratification on user attitude and continuance use of Mobile Money services in Ghana using Uses and Gratification Theory with income and Education as a Moderating factors. Example of a Conceptual Model
  • 15.
    Dr. Emmanuel Awuni,University of Ghana 15 Assess the Measurement Model with PLS Algorithm Models Assessment
  • 16.
    Measurement Model Assessment •Indicator Reliability : is the proportion of Indicator variance that is explained by the Latent variable. • Criterion: Outer loading: Threshold> .70 • Indicator reliability is the extent to which a variable or set of variables is consistent regarding what it intends to measure. Dr. Emmanuel Awuni, University of Ghana 16 • Click on the outer loading after running the PLS algorithm • Click on the Construct Reliability and validly for all the measurements regarding the measurement assessment
  • 17.
    Dr. Emmanuel Awuni,University of Ghana 17
  • 18.
    Measurement Model Assessment Dr.Emmanuel Awuni, University of Ghana 18 Reporting Indicator Reliability: The study assessed indicator loading using PLS algorithm. The result, as indicated in Table 1, shows all the indicators loaded well into their construct. However, CG3 was deleted after first running the PLS algorithms. This is because the indicator loaded weakly below the 0.70 threshold. Table 1
  • 19.
    Measurement Model Assessment •Internal Consistency: refers to the general agreement between multiple items (often Likert scale items) that make-up a composite score of a survey measurement of a given construct. • This agreement is generally measured by the correlation between items. Dr. Emmanuel Awuni, University of Ghana 19 CRITERIA Threshold: • Cronbach alpha (𝛼): Threshold> .70 • Composite Reliability (CR): Threshold> .70 Table 2
  • 20.
    Measurement Model Assessment Dr.Emmanuel Awuni, University of Ghana 20 Reporting: The study tested internal consistency with Cronbach's alpha using PLS algorithm. All the latent constructs, shown in Table 3 yielded over 0.70 Cronbach alpha values. This indicates a strong internal reliability among the indicator. Table 3: Construct reliability
  • 21.
    Measurement Model Assessment •Convergent Validity: is degree to which individual items reflecting a construct converge in comparison to items measuring different constructs.” • Average Variance Extracted (AVE): Threshold >= 0.50. • Composite reliability (CR): Threshold >= 0.60 or 0.70 • To measure the AVE, each indicator loading on a construct must be squared and the mean value determined. Dr. Emmanuel Awuni, University of Ghana 21 • Reporting: Table 4 shows that the AVE values are higher than the threshold of 0.50 which indicates adequate convergent validity. This means that the latent construct explains at least 50 percent of the variability of its items and thus demonstrates sufficient convergent validity. Table 4
  • 22.
    Measurement Model Assessment •Discriminant Validity: is referring to the extent in which the construct is actually differing from one another empirically • Outer Loadings: Threshold >= 0.70 • Fornell- Lacker: Threshold >= 0.50 • Heterotrait-monotrait: Threshold < 0.85 or 0.90. Dr. Emmanuel Awuni, University of Ghana 22 Reporting: As indicated in Table 5, all the HTMT values did not exceed the 0.9 threshold which indicates the presence of discriminant validity. The implication is that the various latent variables are distinct and different from each other. HTMT table for Discriminant validity Table 5
  • 23.
    Dr. Emmanuel Awuni,University of Ghana 23 Reporting: Where each indicator loading is higher for its construct than for any other construct and each of the constructs or latent variables loads highest with its indicators or assigned items, it can be generalized that, the indicators of the latent variable or construct are discriminant of each other. That is, they are not interchangeable. From that 5.3, it can be inferred that the latent variables are discriminant of each other as they load the highest on their assigned constructs than any other construct (s).
  • 24.
    Measurement Model Assessment MeasurementsCriteria Threshold Reference Indicator Reliability indicator loadings >=0.5 Henseler et al. (2009) Internal Consistency Cronbach Alpha (𝛼) >=0.6 or 0.7 Nunnally, (1978) Composite reliability (CR) >=0.6 or 0.7 Joreskog (1971) Rho_A >=70 Dijkstra and Henseler (2015) Convergent Validity *Average Variance Extracted (AVE) >=0.5 Fornell and Larcker (1981) Composite reliability (CR) >=0.6 or 0.7 Discriminant Validity *Indicator Cross loadings >=0.7 Hair et al. (2019, p.9) *Heterotrait-monotrait (HTMT) <= 0.85 0r 0.90, above this threshold indicates absent of discriminant validity Gold, Malhotra, and Segars, (2001) Henseler et al., (2015) Fornell and Larcker 0.5 across the diagonal Fornell and Larcker (1981) Dr. Emmanuel Awuni, University of Ghana 24 Table 7
  • 25.
    Dr. Emmanuel Awuni,University of Ghana 25 Table 8. Some Guidelines for using SmartPLS
  • 26.
    Assessment of theStructural Model Dr. Emmanuel Awuni, University of Ghana 26 Collinearity Issues Significance and relevance Effect Size, f2 Goodness of fit with R2 Predictive Relevance, q2
  • 27.
    Assessment of Collinearity •In SEM, A minimum threshold of 5 or lower is needed to avoid issues of collinearity (Hair, Ringle, & Sarstedt, 2011). • A very high multicollinearity is above 20. In PLS_SEM, Multicollinearity is assessed by analyzing the Variance Inflation Factor (VIF) for each independent construct Dr. Emmanuel Awuni, University of Ghana 27
  • 28.
    Assessing Multicollinearity • Afterrunning the PLS algorithm click on the VIF beneath. Dr. Emmanuel Awuni, University of Ghana 28
  • 29.
    From Table 9,all VIF values are below the value of 5, indicating that there are no issues with collinearity. That latent variables are independent of each other and that change in one does not affect the other variables and vice versa. Reporting Multicollinearity Dr. Emmanuel Awuni, University of Ghana 29 Table 9
  • 30.
    Hypothesis testing: Bootstrappingfor Direct effect • Bootstrap estimates the spread, shape and bias of the sampling distribution of the population from which the sample under study is drawn from. Bootstrapping is non-parametric procedure that allows testing the statistical significance of various PLS_SEM results such as Path co- efficient etc. Dr. Emmanuel Awuni, University of Ghana 30
  • 31.
    Reporting test ofsignificance (Direct effect) In order to test the hypothesis for significance, bootstrapping procedure is performed using a two-tailed t- distribution. The bootstrapping was run using 5000 iterations (subsamples). The result is presented in Table 9. NOTE: Sample mean after the running bootstrapping algorithm is the Standardized beta (std. beta) Standard deviation after the running bootstrapping algorithm is the standard error (std. error) on the table. Dr. Emmanuel Awuni, University of Ghana 31 Table 9
  • 32.
    Reporting: All five hypothesesproposed in this study were supported. This was done through bootstrapping with bias-corrected 95% confidence intervals. The findings related to the individual hypotheses are discussed in the following section below. Since a 95% confidence interval is assumed, a minimum critical value of 1.65 as ideal for a significance level of 10% (two-tailed). Dr. Emmanuel Awuni, University of Ghana 32
  • 33.
    Effect Size, Cohen’sf2 Dr. Emmanuel Awuni, University of Ghana 33 • The effect size shows how much an exogenous latent variable contributes to an endogenous latent variable’s R2 value. • In simple terms, effect size assesses the magnitude or strength of relationship between the latent variables. • Effect size helps researchers to assess the overall contribution of a research study.
  • 34.
    Dr. Emmanuel Awuni,University of Ghana 34 Run the PLS Algorithm Algorithm for the effect size and make changes here to give your results on the indirect effect
  • 35.
    Effect Size, Cohen’sf2 Reporting: From Table 10, the independent constructs such as cognitive, convenience, ease of use, hedonic and integrative are found to have a small effect on attitude towards use. In addition, usefulness as an independent construct has a moderating effect on Attitude towards use. Attitude towards use is termed to have a large effect on continuance use intention. Dr. Emmanuel Awuni, University of Ghana 35 Table 10
  • 36.
    Assessing Goodness ofFit with R-Squared Dr. Emmanuel Awuni, University of Ghana 36 • The assessment of the goodness of fit indicates whether the model is well-fitted or ill-fitted. • The GOF test helps the researcher to identify misspecifications of the measurement and structural model. • R2 measures the model’s explanatory power. • It represents the combined effects of the exogenous latent variables on the endogenous latent variable. • R2 varies from 0 to 1 0.25: weak 0.50: moderate 0.75: Strong or substantial
  • 37.
    Assessing Goodness ofFit with R-Squared Dr. Emmanuel Awuni, University of Ghana 37 Find the R2
  • 38.
    Reporting Goodness ofFit Dr. Emmanuel Awuni, University of Ghana 38 • From Table 11, the R2 of the model is 0.649 and 0.556. This implies that the combined exogenous latent variables account for 65% endogenous factor variations (Attitude) and and 56% of the Attitude on continuance use. This indicates that the model is well fitted given that it is beyond the acceptable threshold of 0.5. Table 11
  • 39.
    Mediation Dr. Emmanuel Awuni,University of Ghana 39 • Direct Effect: Relationship linking two constructs with a single arrow • Indirect Effect (also Mediating effect): A sequence of relationships with at least one intervening construct involved Students IQ Classroom Academic performance x1 x2 x3
  • 40.
    Mediation • Mediation explainsthe relationship between the constructs/latent variables (exogeneous and endogenous) • Conditions: • Exogeneous variations account for the variations in endogenous construct • Exogeneous variations account for the variations in Mediator • Mediator accounts for the variations in endogenous construct • When mediator is added to the model the relationship between the Exogeneous and endogenous constructs decreases. Dr. Emmanuel Awuni, University of Ghana 40
  • 41.
    Mediating Effect Dr. EmmanuelAwuni, University of Ghana 41 Run the Bootstrapping Algorithm for the Mediating effect and make changes here to give your results on the indirect effect
  • 42.
    Moderation • Moderation changesthe strength or direction of the relationship between the constructs/latent variables (exogeneous and endogenous). • They do not explain why there is a relationship between the constructs. Dr. Emmanuel Awuni, University of Ghana 42 Hedonic Hedonic Income Education Gender • Does income increase or decrease the relationship between hedonic and Attitude • Does education increase or decrease the relationship between hedonic and Attitude • Does Gender play role in the relationship between hedonic and Attitude
  • 43.
    Moderation • Two types: •Categorical moderation • Continuous moderation Dr. Emmanuel Awuni, University of Ghana 43
  • 44.
    Moderation Effect Dr. EmmanuelAwuni, University of Ghana 44 1. Add the moderating variable by connecting formatively to the dependent variable. 2. Run the Bootstrapping Algorithm for the Moderating effect
  • 45.
    Moderation Effect Dr. EmmanuelAwuni, University of Ghana 45 1. Add the moderating variable by connecting formatively to the dependent variable. 2. Right click on the dependent variable and select moderating effect. 3. Make changes to add the moderating effect. 4. If the variable is Categorical make these changes in the figure. 5. Run the Bootstrapping Algorithm for the Moderating effect
  • 46.
    Moderation Effect Dr. EmmanuelAwuni, University of Ghana 46 1. If the variable is Categorical make these changes in the figure. 2. After that run the Bootstrapping Algorithm for the Moderating effect
  • 47.
    Mediating Effect Dr. EmmanuelAwuni, University of Ghana 47 Run the Bootstrapping Algorithm for the Moderating effect
  • 48.
    Dr. Emmanuel Awuni,University of Ghana 48
  • 49.
    Practice: Drafting ofResearch paper 1. Introduction 2. Literature Review 3. Hypothesis and Research Model 3.1 Research Theory 3.2 Hypothesis development and Model 4. Methodology 5. Results 5.1 Demographic characteristics 5.2 Measurement Model Assessment - Indicator reliability (outer loading) - Internal consistency (CR, Rho_A) - Convergent Validity (AVE) - Discriminant Validity (HTMT) Dr. Emmanuel Awuni, University of Ghana 49 5.3 Structural Model Assessment -Assess Multicollinearity (VIF) -Test of Significance (T-value/p-value) -Effect size (Chen f2) -Goodness of Fit (R2) 6. Discussion and implication 6.1 General discussion 6.2 Implications 5. Conclusion Reference
  • 50.
    Areas to explorein SmartPLS • Multigroup Analysis • Higher Order Construct Dr. Emmanuel Awuni, University of Ghana 50
  • 51.
    Areas to Explorein SmartPLS Analyzing Data with Data Mining and Machine Learning Dr. Emmanuel Awuni, University of Ghana 51
  • 52.
    Dr. Emmanuel Awuni,University of Ghana 52