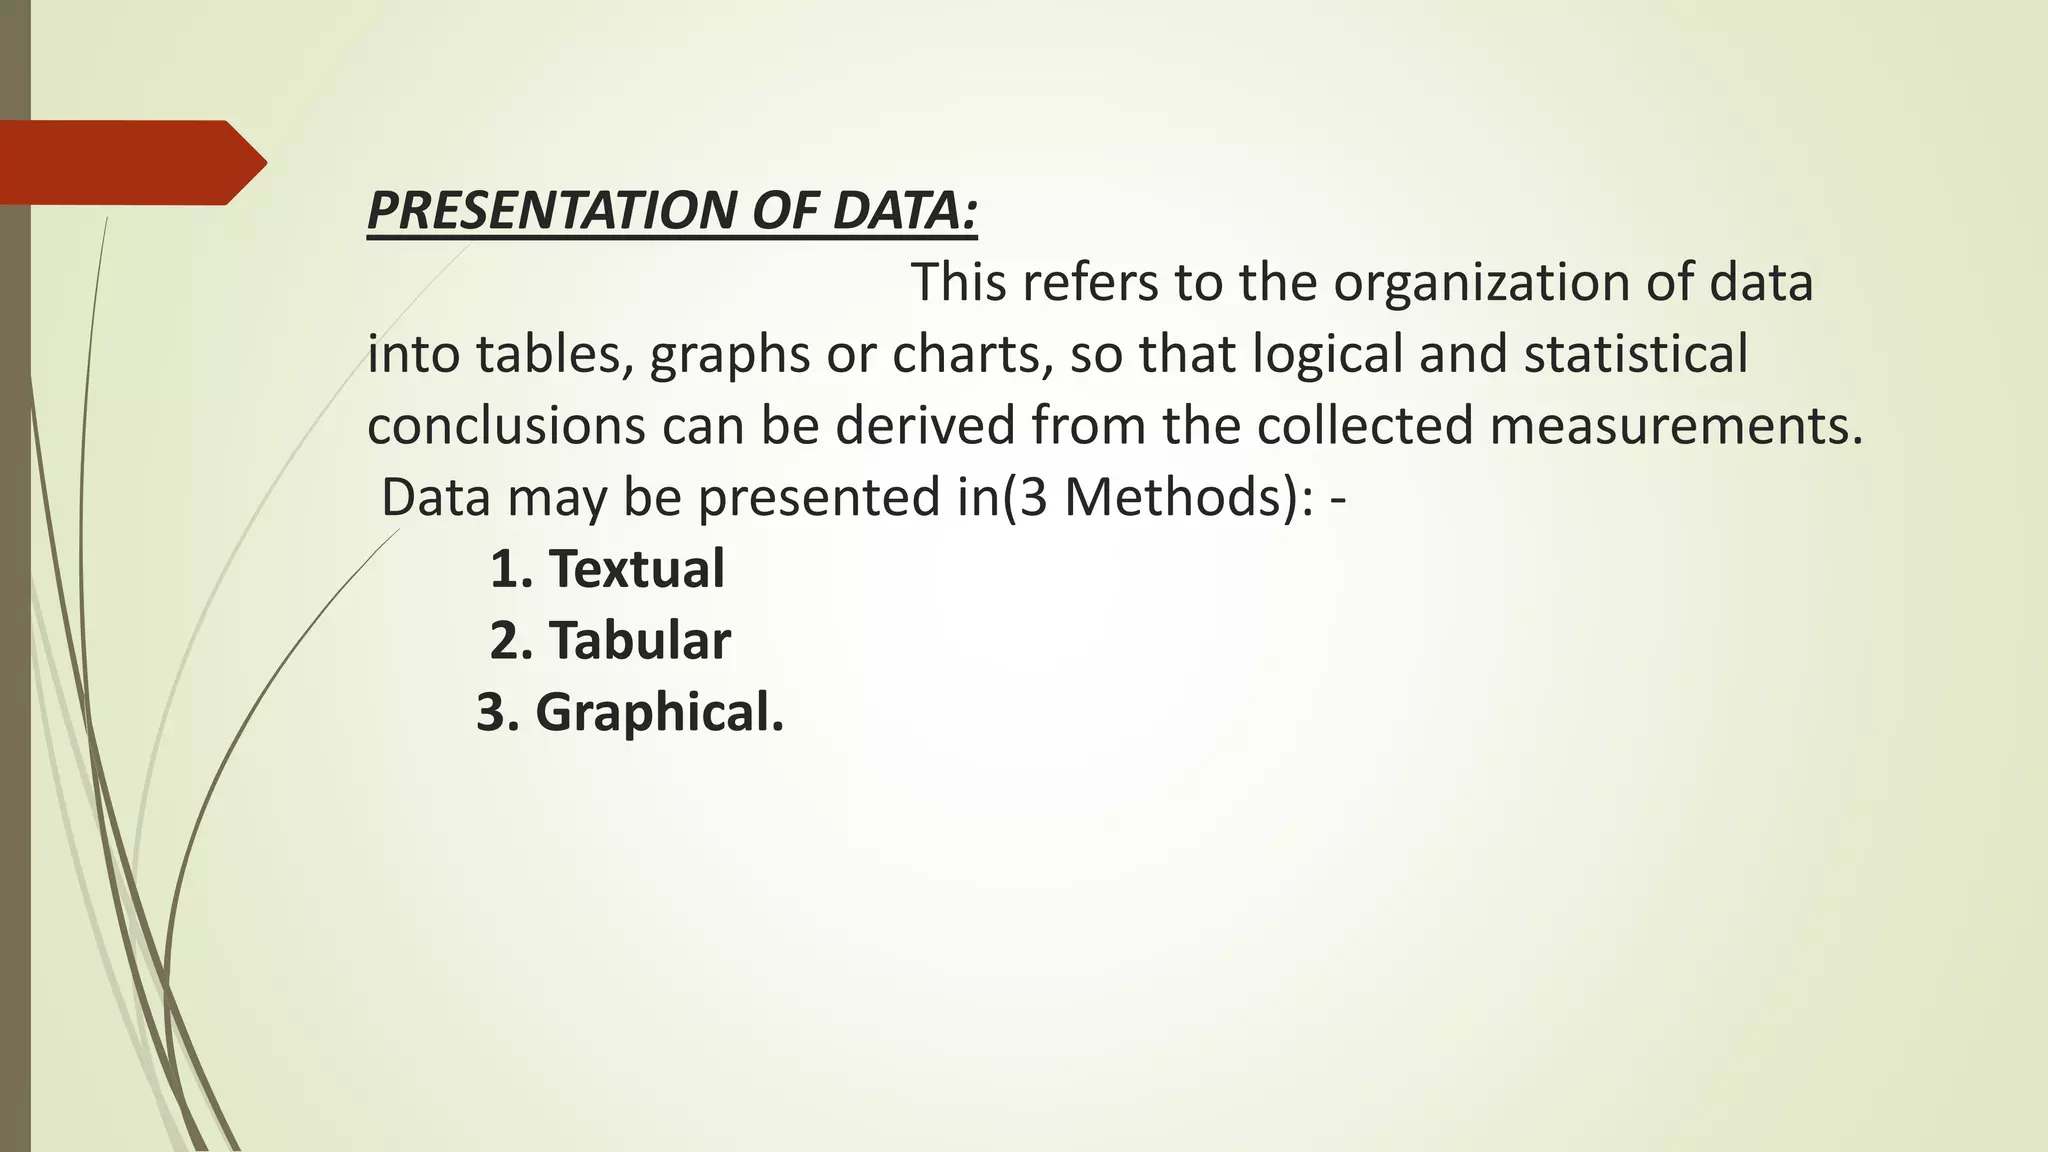
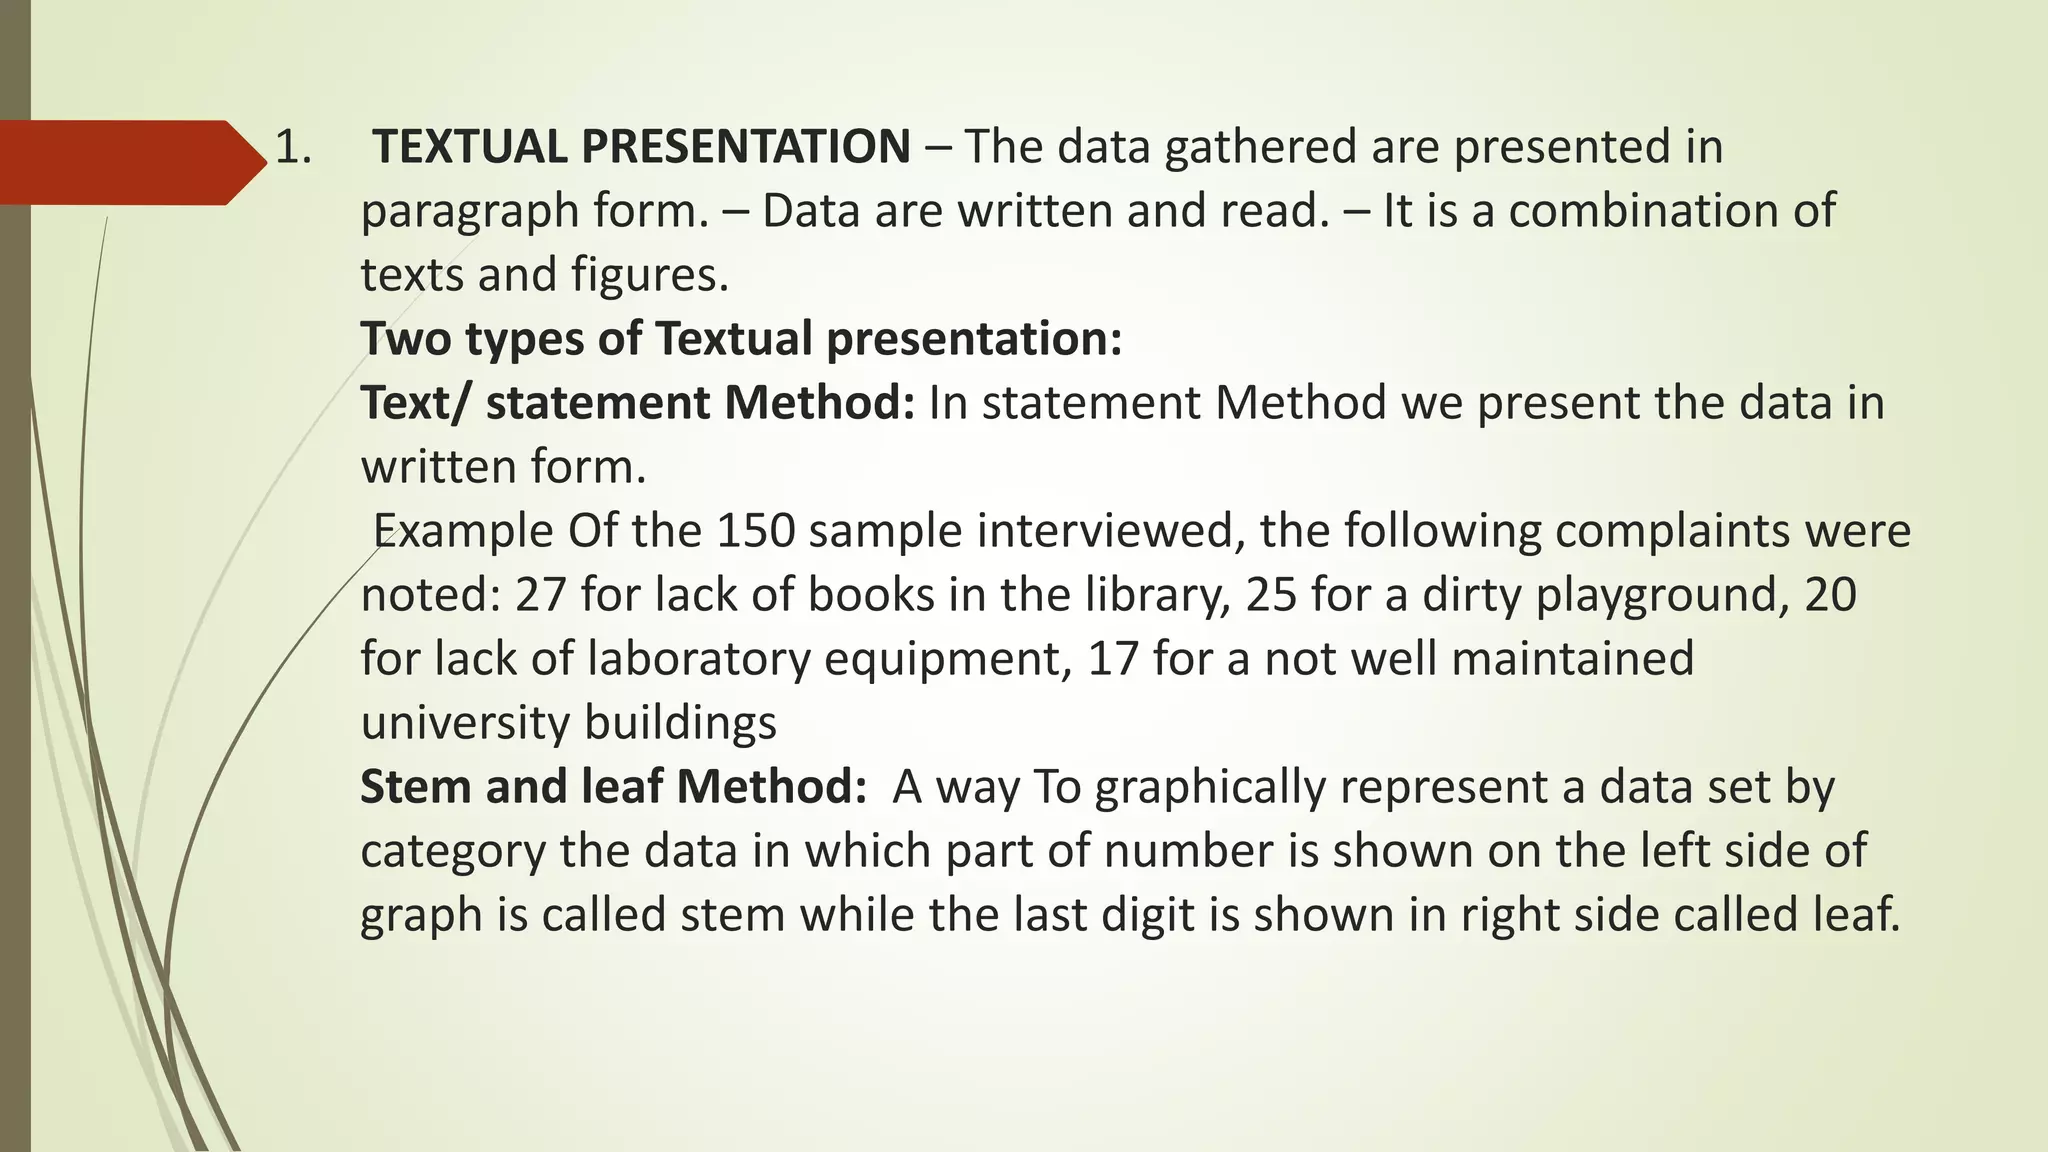
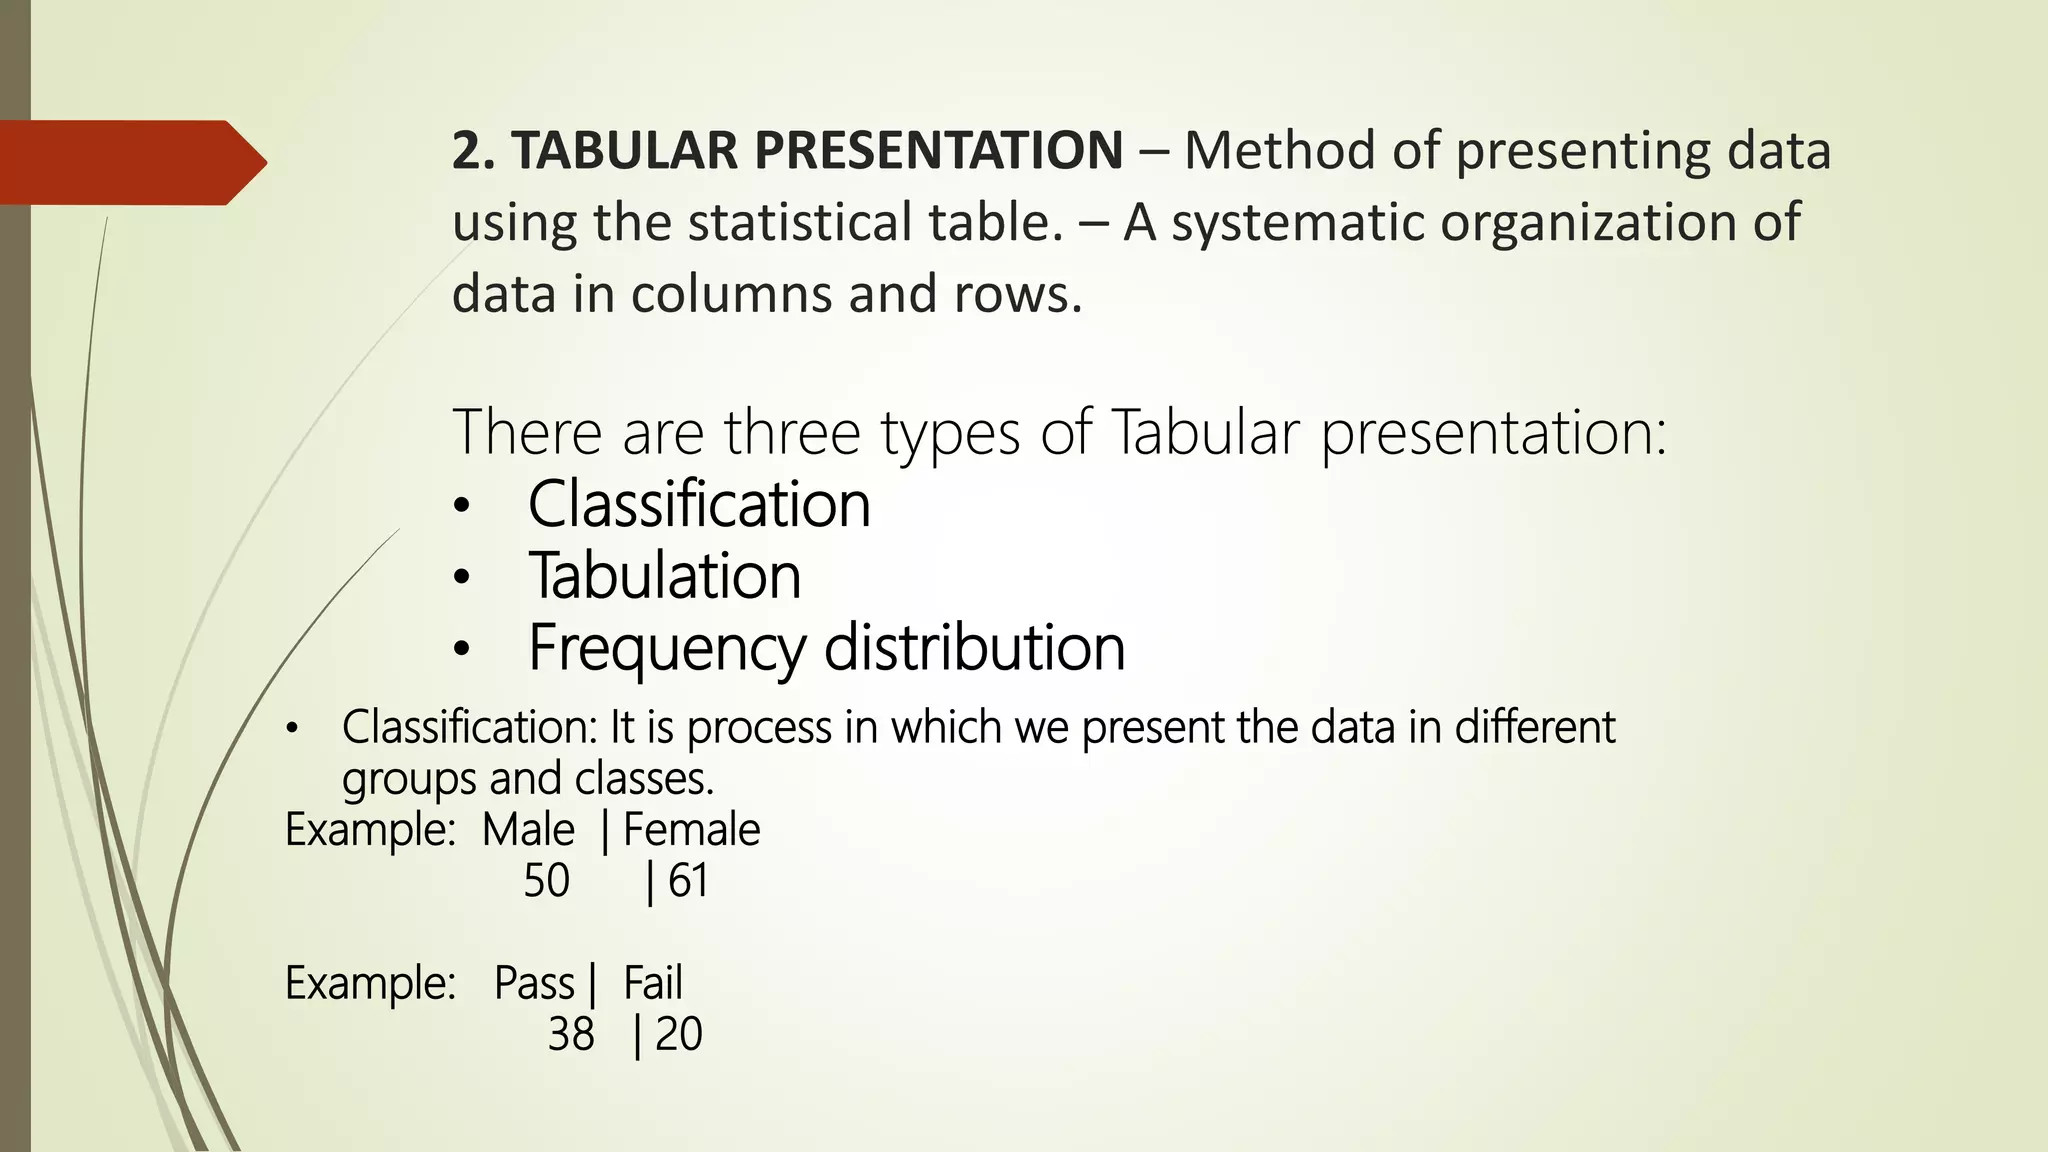
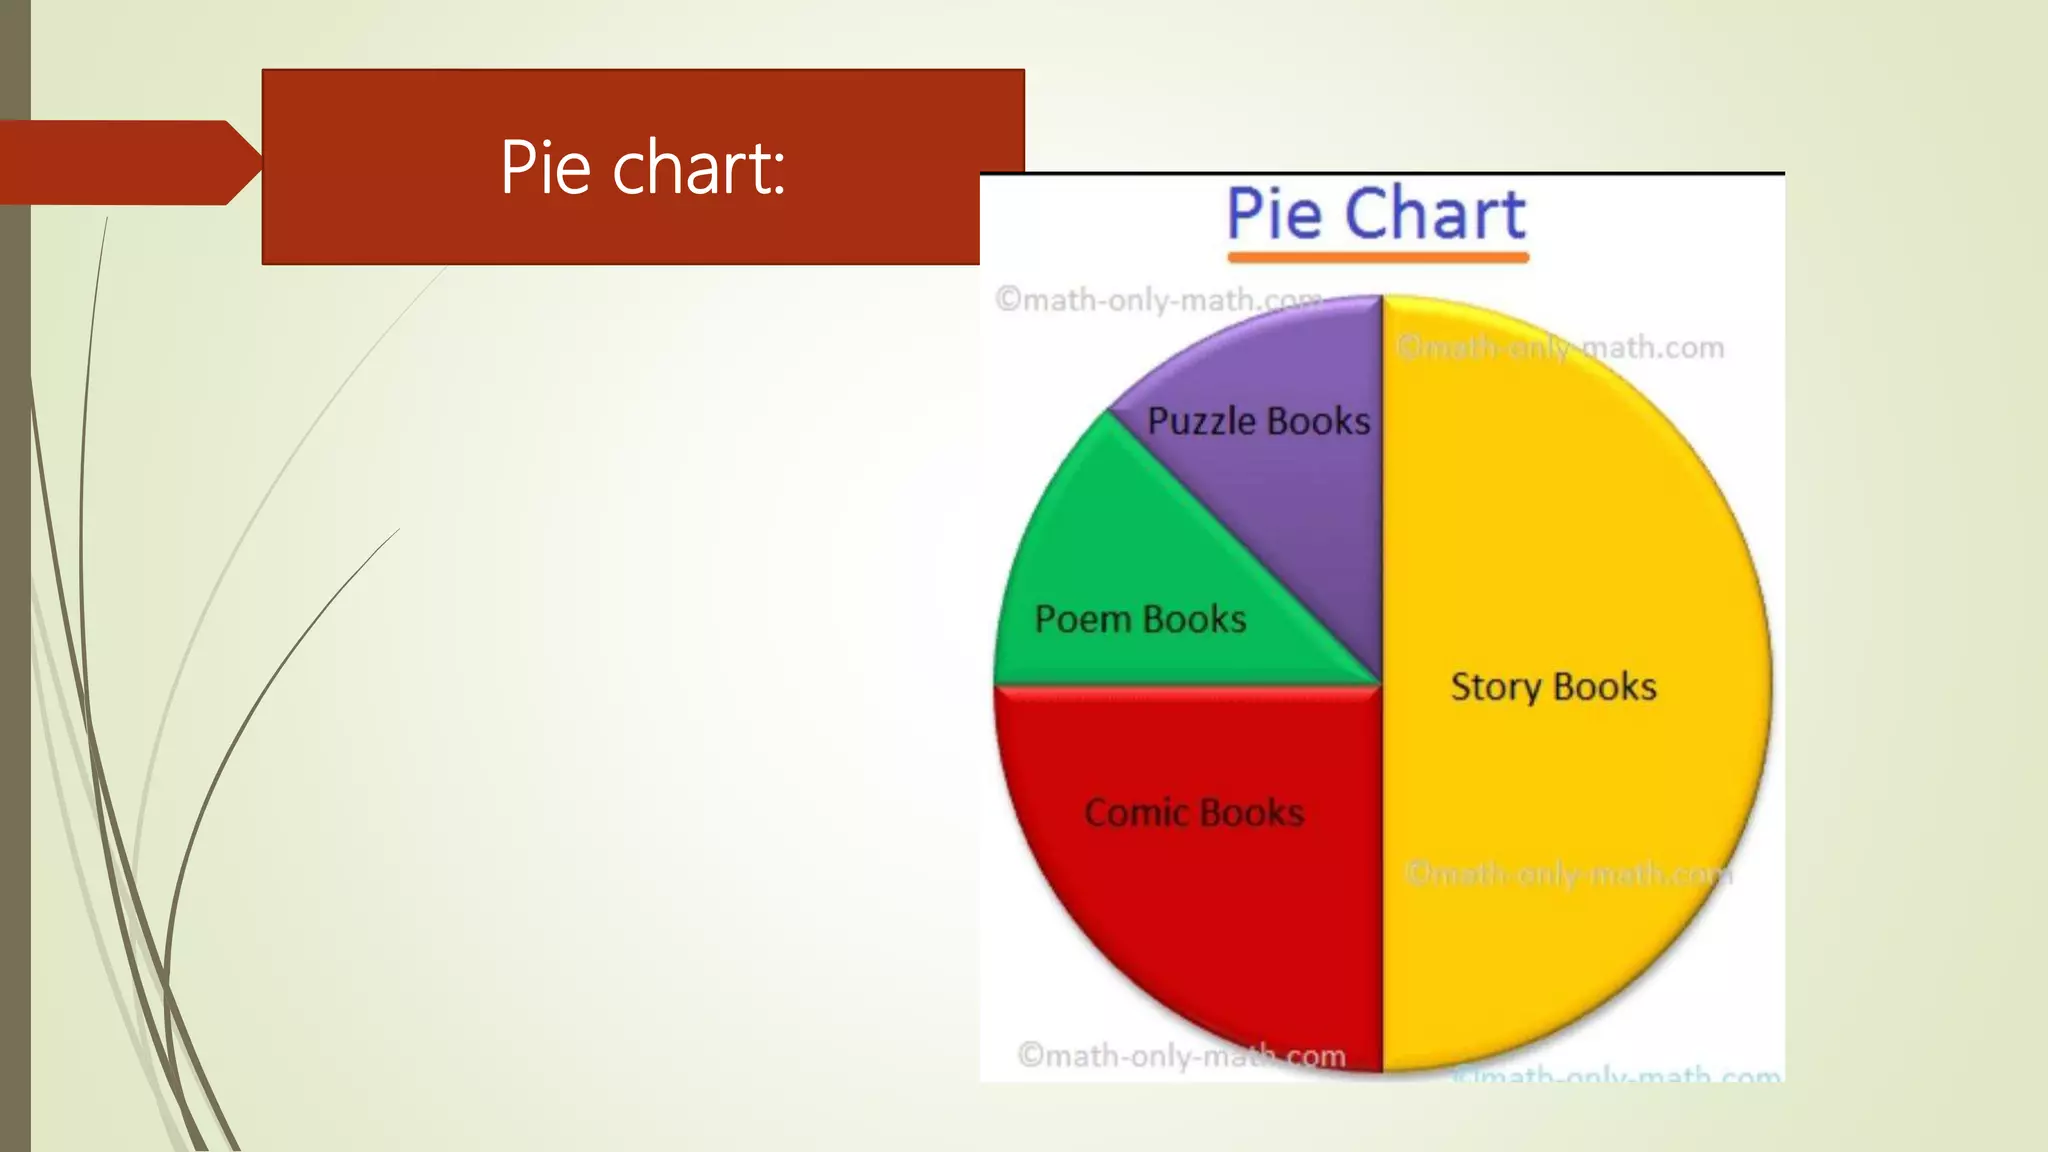
﷽
Name:- Ali Asghar Jatoi
Roll No:- 011
Department BS English 2k20
Subject:- Introduction to Statistics
Topic:- Presentation of Data
Presentation of data and methods
of presentation of Data
Topic:
PRESENTATION OF DATA:
This refers to the organization of data
into tables, graphs or charts, so that logical and statistical
conclusions can be derived from the collected measurements.
Data may be presented in(3 Methods): -
1. Textual
2. Tabular
3. Graphical.
1. TEXTUAL PRESENTATION – The data gathered are presented in
paragraph form. – Data are written and read. – It is a combination of
texts and figures.
Two types of Textual presentation:
Text/ statement Method: In statement Method we present the data in
written form.
Example Of the 150 sample interviewed, the following complaints were
noted: 27 for lack of books in the library, 25 for a dirty playground, 20
for lack of laboratory equipment, 17 for a not well maintained
university buildings
Stem and leaf Method: A way To graphically represent a data set by
category the data in which part of number is shown on the left side of
graph is called stem while the last digit is shown in right side called leaf.
Stem Leaf
1 0
1 5
1 9
2 1
2 3
3 8
5 6
Data: 10, 15 , 19 ,21, 23,38, 56
2. TABULAR PRESENTATION – Method of presenting data
using the statistical table. – A systematic organization of
data in columns and rows.
There are three types of Tabular presentation:
• Classification
• Tabulation
• Frequency distribution
• Classification: It is process in which we present the data in different
groups and classes.
Example: Male | Female
50 | 61
Example: Pass | Fail
38 | 20
• Tabulation: it is process in which we present
the data in different Rows and Columns
along with title and subtitles
Pass Fail Total
Girls 38 20 58
Boys 41 8 49
Total 79 28 107
Title:- Result of 2k20 Bs English
• Frequency distribution: It is process in which
we present the data in different groups or
classes Alon with frequency.
Steps:
1. Find Range
2. Find no of classes
3. Find class intervals
4. Set the class limits
5. Make frequency distribution table.
Class limits Class Entries Frequency
18-34 18,28,30 3
35-51 40,46 2
52-68 53,53,62,65 4
69-85 69,73,81 3
Total number of
frequency are 12.
3.Graphical Presentation: It helps us in
presentation and prediction, or shows a report
of how certain situation is in past and how it is
shows data through charts today / present.
There are Four types of Graphical
Presentation:
1. Bar chart
2. Histogram
3. Frequency polygon
4.Pie chart.
Bar Chart:
Histogram:
Frequency polygon:
Pie chart:
Presentation by Ali Asghar jatoi Roll No O11 of Statistics ( Presentation of Data and Methods of presentation of Data)

Presentation by Ali Asghar jatoi Roll No O11 of Statistics ( Presentation of Data and Methods of presentation of Data)

  • 1.
    ﷽ Name:- Ali AsgharJatoi Roll No:- 011 Department BS English 2k20 Subject:- Introduction to Statistics Topic:- Presentation of Data
  • 2.
    Presentation of dataand methods of presentation of Data Topic:
  • 3.
    PRESENTATION OF DATA: Thisrefers to the organization of data into tables, graphs or charts, so that logical and statistical conclusions can be derived from the collected measurements. Data may be presented in(3 Methods): - 1. Textual 2. Tabular 3. Graphical.
  • 4.
    1. TEXTUAL PRESENTATION– The data gathered are presented in paragraph form. – Data are written and read. – It is a combination of texts and figures. Two types of Textual presentation: Text/ statement Method: In statement Method we present the data in written form. Example Of the 150 sample interviewed, the following complaints were noted: 27 for lack of books in the library, 25 for a dirty playground, 20 for lack of laboratory equipment, 17 for a not well maintained university buildings Stem and leaf Method: A way To graphically represent a data set by category the data in which part of number is shown on the left side of graph is called stem while the last digit is shown in right side called leaf.
  • 5.
    Stem Leaf 1 0 15 1 9 2 1 2 3 3 8 5 6 Data: 10, 15 , 19 ,21, 23,38, 56
  • 6.
    2. TABULAR PRESENTATION– Method of presenting data using the statistical table. – A systematic organization of data in columns and rows. There are three types of Tabular presentation: • Classification • Tabulation • Frequency distribution • Classification: It is process in which we present the data in different groups and classes. Example: Male | Female 50 | 61 Example: Pass | Fail 38 | 20
  • 7.
    • Tabulation: itis process in which we present the data in different Rows and Columns along with title and subtitles Pass Fail Total Girls 38 20 58 Boys 41 8 49 Total 79 28 107 Title:- Result of 2k20 Bs English
  • 8.
    • Frequency distribution:It is process in which we present the data in different groups or classes Alon with frequency. Steps: 1. Find Range 2. Find no of classes 3. Find class intervals 4. Set the class limits 5. Make frequency distribution table. Class limits Class Entries Frequency 18-34 18,28,30 3 35-51 40,46 2 52-68 53,53,62,65 4 69-85 69,73,81 3 Total number of frequency are 12.
  • 9.
    3.Graphical Presentation: Ithelps us in presentation and prediction, or shows a report of how certain situation is in past and how it is shows data through charts today / present. There are Four types of Graphical Presentation: 1. Bar chart 2. Histogram 3. Frequency polygon 4.Pie chart.
  • 10.
  • 11.
  • 12.
  • 13.