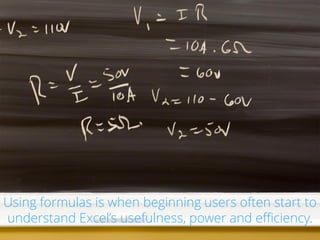
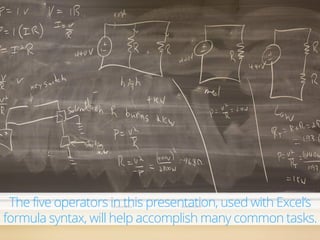
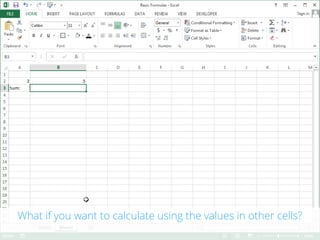
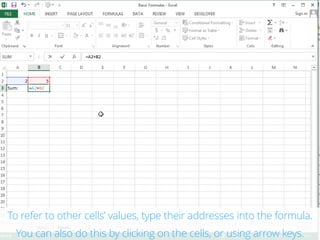
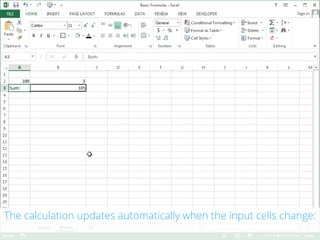
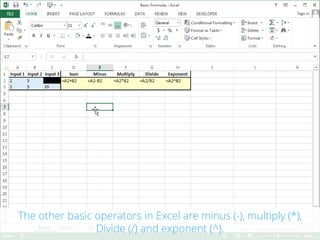
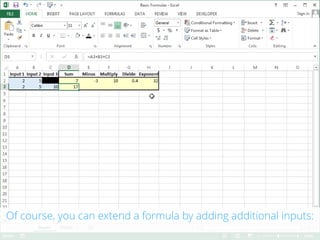
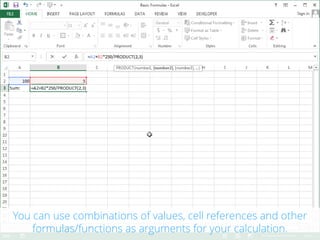
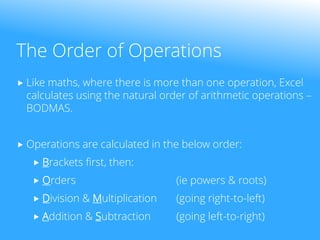
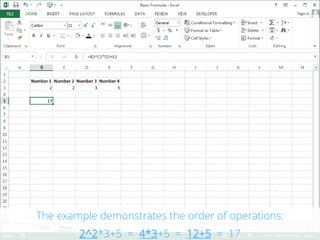
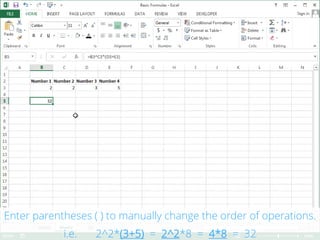
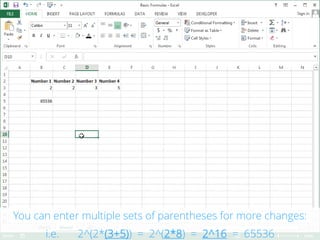
SEE MORE, INCLUDING A FREE TRIAL, AT: www.PivotTable-Pro.com
This presentation teaches use of basic formulas and mathematical operators.
***Basic Formulas***
Adding Values in Excel
Using Values and Cell References as Formula Inputs.
Using Cells as Formula Inputs Using the Mouse and Keyboard.
Calculating Subtractions, Multiplications, Divisions and Exponents.
Using More Than Two Inputs in a Formula.
***The Order Of Operations***
The Order Of Operations - BODMAS
Using Parentheses in Excel Formulas
3S Certifications and Training offers Advanced Excel training for corporates and individuals to best suit their schedule, budget, learning style and expertise. We offer Corporate In-House Training on Microsoft Excel (Basic, Intermediate & Advanced Level) & Excel VBA Macro, MS PowerPoint, MS Office (Word, Excel & PPT) Courses in Chennai, Mumbai, Bangalore, New Delhi/ Gurgaon/ Noida/ NCR, Hyderabad, Kolkata, Ahmedabad, Pune and all major cities in India & Middle East.
Our training courses will show you how to use Excel better, faster and more efficiently and effectively. Participants will learn how to save time, access new features and work with confidence. Our teaching methods ensure maximum comprehension in the shortest possible time. We provide a dynamic learning environment with lots of practical hands on exercises and real world examples.
Our instructors / Trainers are knowledgeable, experienced in excel training and other professional trainings like Six Sigma, MIS etc. which help them quoting industry problems and solutions.
MS Excel Learning for PPC Google AdWords Training CourseRanjan Jena
MS Excel learning to get expertise in Google AdWords training course. Learn all important tips and techniques in MS Excel for your fast and easy approach to Google AdWords analysis and reporting formats.
Ranjan Jena conducts Adwords Training session in Bangalore, currently with more than 45 students already graduated under his guidance and mentorship. For any training need, you can directly reach him at +91-7760969452
These are MS Excel Tips and tricks you might not know, which will advance your skills in using Excel, also these tips and tricks are the main Job exams questions
Presentation is about advance excel advance feature PIVOT Table and contains steps to insert pivot table and some useful features of pivot table in case of large amount of data
The site present the assignment to the students in well- structured manner including all the information in the simplest form, so that students need not spend extra time and effort in completion of the assignment and along with these they can also gain all the content engraved in the brain.
Excel – is the world’s most widely used spreadsheet calculating program
It is used in many places like hospitals, hotels, school and companies etc.
A program that allows you to use data to forecast, manage, predict, and present information
Lets Just Go For It! Wish you an Awesome Leaning Experience.
Subscribe to our YouTube channel: https://www.youtube.com/c/TimesRide?sub_confirmation=1
Our Official Website: http://timesride.com
Follow us:
Facebook: https://www.facebook.com/rs.agrawal.9026
Instagram: https://www.instagram.com/timesridenetwork/
Twitter: https://twitter.com/TimesRide
Pinterest: https://in.pinterest.com/ride0472/
Thank You
#AwesomeLearningExperience
#SmartQuickTips&Tricks #LeaningVideos #TimesRide #Keep Learning to Keep Winning!
Just some excel courses. Have fun and learn from basic to advance, to develope strong skills in operating Excel.
Microsoft Office Excel was never so easy to understand like now!
Learn to anchor cells, move around Excel without a mouse, functions to summarize data, PivotTables, filters, sorting, charts, and macros in this course to take your Excel skills to the next level. Include information on functions: countif, sumif, vlookup, index, match, left, right, mid, len, trim, find, now, date, int
Microsoft Excel
What You Can do with MS Excel
Features of MS Excel
- Graphical Features of Excel
- Database Feature of Excel
- Functional Features of Excel
How to Access MS Excel on Your System
The Excel Workbook
The Excel Ribbon
Command Overview of different tabs of Ribbon
Quick Access Toolbar
Right Click Menu
The File Tab
Saving Workbook
Saving a File in Excel
Saving New Changes in Excel
Assignment
The pivot tables are not created mechanically. In Microsoft excel the user should select the data first for which the pivot table should be created. The pivot table option is available on the insert tab. The user has the option of inserting the pivot table either in the existing sheet or creating the pivot table in the new sheet. Copy the link given below and paste it in new browser window to get more information on Pivot Table:- http://www.transtutors.com/homework-help/statistics/pivot-table.aspx
Pivot Tables and Beyond Data Analysis in Excel 2013 - Course Technology Compu...Cengage Learning
Pivot Tables and Beyond Data Analysis in Excel 2013 - Course Technology Computing Conference
Presenter: Patrick Carey, Cengage Learning Author
Excel is sometimes called the most popular "database" in the world, not because it's a database but because it makes data so accessible that users often turn to spreadsheets for data entry. Yet for all that, Excel's tools for data analysis and modeling remain largely untapped by the average user. In this, pivot tables may be the most powerful and least utilized tool for data exploration. In this presentation we'll examine some of the new enhancements to pivot tables introduced in Excel 2013. We'll examine how to set up relationships using the Excel Data Model to summarize information across multiple data tables. And then we'll go beyond, exploring the data modeling and data visualizing tools provided by the PowerPivot and Power View add-ins, interpreting data not just numerically but through visual imagery, charts, and interactive maps.
5 Course Design Tips to Increase Engagement and OutcomesCengage Learning
Facilitated by: Professor Greg Gellene, Texas Tech University, Lubbock, Texas
10/21/2015
How do you get the most out of your students? Do you wish for them to participate more? Complete their homework? Improve their outcomes? Listen as Greg Gellene reveals his 5 tips for designing a course to better engage college students. Greg will share his experience building a digitally-infused course that increased class attendance and drove homework completion rates to over 80%. Attend this second webinar in our Journey to Digital Professional Development Series to hear from Greg, ask advice for implementing such methods in your own course, and discover why Greg’s students say technology helped to keep them well-engaged in his course.
Google Drive Plus TexQuest Equals a Match Made in Research HeavenCengage Learning
Learn more about how Prosper (TX) High School is using their Gale In Context resources through the Google integration with tools such as Drive, Docs, and Apps, to help their students and teachers more easily access and share content within the classroom, library and from home.
SEE THE FULL, FREE EXCEL 2013 TRAINING COURSE AT WWW.PIVOTEXCEL.COM
This presentation introduces you to basic Excel function syntax and usage, and runs through some basic mathematical functions.
Contents:
***Standard Function Syntax***
Elements of an Excel Function
Inputting Function Arguments
AutoComplete for Functions
***Basic Numerical Functions***
Using Sum(), Max(), Min(), Average() and Count()
Functions Update Automatically as Arguments Change.
Using Comma and Colon to Reference Cells & Ranges.
Using Cell References, Values, Formulas or other Functions as Arguments.
Inserting a Formula into Many Cells at Once with CTRL+ Enter.
***The AutoSum & Quick Analysis Feature***
The Autosum Tool
The Quick Analysis Feature
***Function Library & Insert Function Tool***
Using the ‘Insert Function’ Tool.
***Editing & Deleting Functions***
Editing & Deleting Functions with Mouse & Keyboard
Editing a Function with the Insert Function Tool
Discovering History Through Digital Newspaper CollectionCengage Learning
Hear from Seth Cayley, Director of Research Publishing at Gale, a part of Cengage Learning, as he discusses the historic media coverage of familiar and little known events, cultural phenomena, and everyday life found in 19th and early 20th century newspapers. Learn how historical newspapers can support faculty research, drive inquiry and critical thinking among students, and stimulate classroom debate.
SEE MORE, INCLUDING A FREE TRIAL, AT: www.PivotTable-Pro.com
This presentation demonstrates how AutoCorrect works as you enter text and formulas, and shows how you can add or remove AutoCorrect rules.
Contents:
***Using AutoCorrect***
How AutoCorrect Works
Undoing AutoCorrect Changes
How AutoCorrect Changes Capitalizations
***AutoCorrect Settings***
Turning AutoCorrect Rules On or Off
Entering Custom AutoCorrect Rules
Setting Exceptions to Capitalization Rules
GDG Cloud Southlake #33: Boule & Rebala: Effective AppSec in SDLC using Deplo...James Anderson
Effective Application Security in Software Delivery lifecycle using Deployment Firewall and DBOM
The modern software delivery process (or the CI/CD process) includes many tools, distributed teams, open-source code, and cloud platforms. Constant focus on speed to release software to market, along with the traditional slow and manual security checks has caused gaps in continuous security as an important piece in the software supply chain. Today organizations feel more susceptible to external and internal cyber threats due to the vast attack surface in their applications supply chain and the lack of end-to-end governance and risk management.
The software team must secure its software delivery process to avoid vulnerability and security breaches. This needs to be achieved with existing tool chains and without extensive rework of the delivery processes. This talk will present strategies and techniques for providing visibility into the true risk of the existing vulnerabilities, preventing the introduction of security issues in the software, resolving vulnerabilities in production environments quickly, and capturing the deployment bill of materials (DBOM).
Speakers:
Bob Boule
Robert Boule is a technology enthusiast with PASSION for technology and making things work along with a knack for helping others understand how things work. He comes with around 20 years of solution engineering experience in application security, software continuous delivery, and SaaS platforms. He is known for his dynamic presentations in CI/CD and application security integrated in software delivery lifecycle.
Gopinath Rebala
Gopinath Rebala is the CTO of OpsMx, where he has overall responsibility for the machine learning and data processing architectures for Secure Software Delivery. Gopi also has a strong connection with our customers, leading design and architecture for strategic implementations. Gopi is a frequent speaker and well-known leader in continuous delivery and integrating security into software delivery.
Accelerate your Kubernetes clusters with Varnish CachingThijs Feryn
A presentation about the usage and availability of Varnish on Kubernetes. This talk explores the capabilities of Varnish caching and shows how to use the Varnish Helm chart to deploy it to Kubernetes.
This presentation was delivered at K8SUG Singapore. See https://feryn.eu/presentations/accelerate-your-kubernetes-clusters-with-varnish-caching-k8sug-singapore-28-2024 for more details.
Encryption in Microsoft 365 - ExpertsLive Netherlands 2024Albert Hoitingh
In this session I delve into the encryption technology used in Microsoft 365 and Microsoft Purview. Including the concepts of Customer Key and Double Key Encryption.
Kubernetes & AI - Beauty and the Beast !?! @KCD Istanbul 2024Tobias Schneck
As AI technology is pushing into IT I was wondering myself, as an “infrastructure container kubernetes guy”, how get this fancy AI technology get managed from an infrastructure operational view? Is it possible to apply our lovely cloud native principals as well? What benefit’s both technologies could bring to each other?
Let me take this questions and provide you a short journey through existing deployment models and use cases for AI software. On practical examples, we discuss what cloud/on-premise strategy we may need for applying it to our own infrastructure to get it to work from an enterprise perspective. I want to give an overview about infrastructure requirements and technologies, what could be beneficial or limiting your AI use cases in an enterprise environment. An interactive Demo will give you some insides, what approaches I got already working for real.
Slack (or Teams) Automation for Bonterra Impact Management (fka Social Soluti...Jeffrey Haguewood
Sidekick Solutions uses Bonterra Impact Management (fka Social Solutions Apricot) and automation solutions to integrate data for business workflows.
We believe integration and automation are essential to user experience and the promise of efficient work through technology. Automation is the critical ingredient to realizing that full vision. We develop integration products and services for Bonterra Case Management software to support the deployment of automations for a variety of use cases.
This video focuses on the notifications, alerts, and approval requests using Slack for Bonterra Impact Management. The solutions covered in this webinar can also be deployed for Microsoft Teams.
Interested in deploying notification automations for Bonterra Impact Management? Contact us at sales@sidekicksolutionsllc.com to discuss next steps.
GraphRAG is All You need? LLM & Knowledge GraphGuy Korland
Guy Korland, CEO and Co-founder of FalkorDB, will review two articles on the integration of language models with knowledge graphs.
1. Unifying Large Language Models and Knowledge Graphs: A Roadmap.
https://arxiv.org/abs/2306.08302
2. Microsoft Research's GraphRAG paper and a review paper on various uses of knowledge graphs:
https://www.microsoft.com/en-us/research/blog/graphrag-unlocking-llm-discovery-on-narrative-private-data/
JMeter webinar - integration with InfluxDB and GrafanaRTTS
Watch this recorded webinar about real-time monitoring of application performance. See how to integrate Apache JMeter, the open-source leader in performance testing, with InfluxDB, the open-source time-series database, and Grafana, the open-source analytics and visualization application.
In this webinar, we will review the benefits of leveraging InfluxDB and Grafana when executing load tests and demonstrate how these tools are used to visualize performance metrics.
Length: 30 minutes
Session Overview
-------------------------------------------
During this webinar, we will cover the following topics while demonstrating the integrations of JMeter, InfluxDB and Grafana:
- What out-of-the-box solutions are available for real-time monitoring JMeter tests?
- What are the benefits of integrating InfluxDB and Grafana into the load testing stack?
- Which features are provided by Grafana?
- Demonstration of InfluxDB and Grafana using a practice web application
To view the webinar recording, go to:
https://www.rttsweb.com/jmeter-integration-webinar
Securing your Kubernetes cluster_ a step-by-step guide to success !KatiaHIMEUR1
Today, after several years of existence, an extremely active community and an ultra-dynamic ecosystem, Kubernetes has established itself as the de facto standard in container orchestration. Thanks to a wide range of managed services, it has never been so easy to set up a ready-to-use Kubernetes cluster.
However, this ease of use means that the subject of security in Kubernetes is often left for later, or even neglected. This exposes companies to significant risks.
In this talk, I'll show you step-by-step how to secure your Kubernetes cluster for greater peace of mind and reliability.
LF Energy Webinar: Electrical Grid Modelling and Simulation Through PowSyBl -...DanBrown980551
Do you want to learn how to model and simulate an electrical network from scratch in under an hour?
Then welcome to this PowSyBl workshop, hosted by Rte, the French Transmission System Operator (TSO)!
During the webinar, you will discover the PowSyBl ecosystem as well as handle and study an electrical network through an interactive Python notebook.
PowSyBl is an open source project hosted by LF Energy, which offers a comprehensive set of features for electrical grid modelling and simulation. Among other advanced features, PowSyBl provides:
- A fully editable and extendable library for grid component modelling;
- Visualization tools to display your network;
- Grid simulation tools, such as power flows, security analyses (with or without remedial actions) and sensitivity analyses;
The framework is mostly written in Java, with a Python binding so that Python developers can access PowSyBl functionalities as well.
What you will learn during the webinar:
- For beginners: discover PowSyBl's functionalities through a quick general presentation and the notebook, without needing any expert coding skills;
- For advanced developers: master the skills to efficiently apply PowSyBl functionalities to your real-world scenarios.
UiPath Test Automation using UiPath Test Suite series, part 3DianaGray10
Welcome to UiPath Test Automation using UiPath Test Suite series part 3. In this session, we will cover desktop automation along with UI automation.
Topics covered:
UI automation Introduction,
UI automation Sample
Desktop automation flow
Pradeep Chinnala, Senior Consultant Automation Developer @WonderBotz and UiPath MVP
Deepak Rai, Automation Practice Lead, Boundaryless Group and UiPath MVP
Dev Dives: Train smarter, not harder – active learning and UiPath LLMs for do...UiPathCommunity
💥 Speed, accuracy, and scaling – discover the superpowers of GenAI in action with UiPath Document Understanding and Communications Mining™:
See how to accelerate model training and optimize model performance with active learning
Learn about the latest enhancements to out-of-the-box document processing – with little to no training required
Get an exclusive demo of the new family of UiPath LLMs – GenAI models specialized for processing different types of documents and messages
This is a hands-on session specifically designed for automation developers and AI enthusiasts seeking to enhance their knowledge in leveraging the latest intelligent document processing capabilities offered by UiPath.
Speakers:
👨🏫 Andras Palfi, Senior Product Manager, UiPath
👩🏫 Lenka Dulovicova, Product Program Manager, UiPath
Connector Corner: Automate dynamic content and events by pushing a buttonDianaGray10
Here is something new! In our next Connector Corner webinar, we will demonstrate how you can use a single workflow to:
Create a campaign using Mailchimp with merge tags/fields
Send an interactive Slack channel message (using buttons)
Have the message received by managers and peers along with a test email for review
But there’s more:
In a second workflow supporting the same use case, you’ll see:
Your campaign sent to target colleagues for approval
If the “Approve” button is clicked, a Jira/Zendesk ticket is created for the marketing design team
But—if the “Reject” button is pushed, colleagues will be alerted via Slack message
Join us to learn more about this new, human-in-the-loop capability, brought to you by Integration Service connectors.
And...
Speakers:
Akshay Agnihotri, Product Manager
Charlie Greenberg, Host
Epistemic Interaction - tuning interfaces to provide information for AI supportAlan Dix
Paper presented at SYNERGY workshop at AVI 2024, Genoa, Italy. 3rd June 2024
https://alandix.com/academic/papers/synergy2024-epistemic/
As machine learning integrates deeper into human-computer interactions, the concept of epistemic interaction emerges, aiming to refine these interactions to enhance system adaptability. This approach encourages minor, intentional adjustments in user behaviour to enrich the data available for system learning. This paper introduces epistemic interaction within the context of human-system communication, illustrating how deliberate interaction design can improve system understanding and adaptation. Through concrete examples, we demonstrate the potential of epistemic interaction to significantly advance human-computer interaction by leveraging intuitive human communication strategies to inform system design and functionality, offering a novel pathway for enriching user-system engagements.
FIDO Alliance Osaka Seminar: Passkeys and the Road Ahead.pdf
Basic Formulas - Excel 2013 Tutorial
1. PIVOT TABLE PRO
LESSON: BASIC FORMULAS
LEVEL: BEGINNER
CONTENTS:
6 Basic Formulas
16 The Order of Operations
PIVOT TABLE PRO
Find more at
WWW.PIVOTTABLE-PRO.COM
2. Using formulas is when beginning users often start to
understand Excel’s usefulness, power and efficiency.
3. The five operators in this presentation, used with Excel’s
formula syntax, will help accomplish many common tasks.
4. This presentation shows you how to enter and edit
basic formulas in Excel using values, cell references
and/or other formulas as inputs.
5. By the end of this presentation you can:
calculate in a cell using mathematical operators
use values, cells and other formulas as formula inputs
change the order of operations with parentheses
6. Let’s add up the two numbers here in the second row.
7. Formulas start with an equals (=) sign. This tells Excel to treat what
you type next as a formula, rather than values or text.
8. When you complete the entry, Excel displays the answer in the
cell. The formula bar shows the underlying calculation.
9. (If you leave out the equals sign, Excel just treats the entry as text
and doesn’t calculate it.)
10. What if you want to calculate using the values in other cells?
11. To refer to other cells’ values, type their addresses into the formula.
You can also do this by clicking on the cells, or using arrow keys.
13. The other basic operators in Excel are minus (-), multiply (*), Divide
(/) and exponent (^).
14. Of course, you can extend a formula by adding additional inputs:
15. You can use combinations of values, cell references and other
formulas/functions as arguments for your calculation.
16. The Order of Operations
Like maths, where there is more than one operation, Excel
calculates using the natural order of arithmetic operations –
BODMAS.
Operations are calculated in the below order:
Brackets first, then:
Orders (ie powers & roots)
Division & Multiplication (going right-to-left)
Addition & Subtraction (going left-to-right)
18. Enter parentheses ( ) to manually change the order of operations.
i.e. 2^2*(3+5) = 2^2*8 = 4*8 = 32
19. You can enter multiple sets of parentheses for more changes:
i.e. 2^(2*(3+5)) = 2^(2*8) = 2^16 = 65536
20. PivotExcel is an independent training program and has not been authorized, sponsored, or otherwise approved by Microsoft Corporation.
Microsoft, Excel, and Windows are either registered trademarks or trademarks of Microsoft Corporation in the United States and/or other countries.
Excel visuals used with permission from Microsoft.
VISIT WWW.PIVOTTABLE-PRO.COM FOR
MORE, INCLUDING A FREE TRIAL!
See more at
PIVOT TABLE PRO
WWW.PIVOTTABLE-PRO.COM