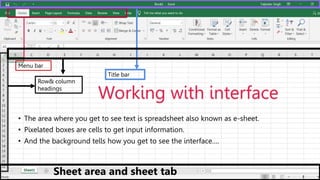
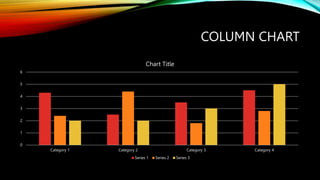
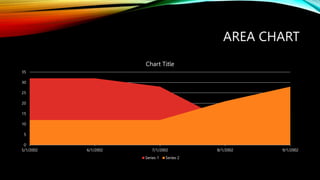
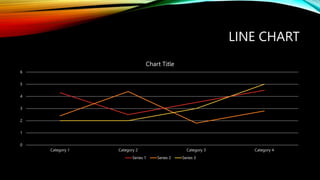
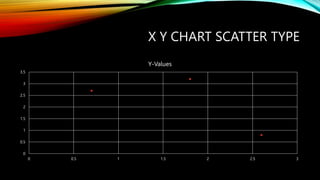
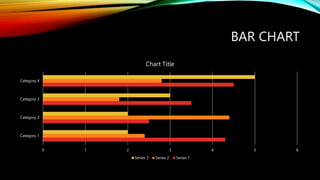
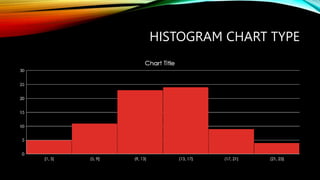
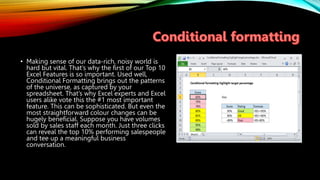
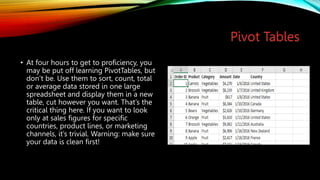
Introduction to excel
Excel is an integral part of Microsoft office and it has
gotd enormous power to perform and render things and
graphics animations and transitions.
Working with interface
• The area where you get to see text is spreadsheet also known as e-sheet.
• Pixelated boxes are cells to get input information.
• And the background tells how you get to see the interface….
Menu bar
Title bar
Row& column
headings
Sheet area and sheet tab
CHARTS AND FORMULAS
• Funnel charts are useful when you want to display values at multiple stages in a
process. A funnel chart can show the number of sales prospects at every stage of a
sales process, for example, with prospects at the top for the first stage, qualified
prospects underneath it for the second stage, and so on, until you get to the final
stage, closed sales. Generally, the values in funnel charts decrease with each
stage, so the bars in the chart look like a funnel. Overall they’re a nice-to-have
addition to Excel.
WORKING WITH PIE CHARTS
Brian
$1,100
Dave
$650
Kelly
$500
Sally
$200
April 2019 Sales
This pie chart has only four slices. This is ideal because it
gives you a quick idea of how much each sales rep
contributed to sales in April 2019.
Here I gave example of working with pie charts….
You can refer to others which we come to see in excel….
These provide us data and information like students in
mpips school in each class etc.
THE WAY OTHER CHARTS LOOK
• Ill show you many slides on how the charts in excel look individually….
COLUMN CHART
0
1
2
3
4
5
6
Category 1 Category 2 Category 3 Category 4
Chart Title
Series 1 Series 2 Series 3
AREA CHART
0
5
10
15
20
25
30
35
5/1/2002 6/1/2002 7/1/2002 8/1/2002 9/1/2002
Chart Title
Series 1 Series 2
LINE CHART
0
1
2
3
4
5
6
Category 1 Category 2 Category 3 Category 4
Chart Title
Series 1 Series 2 Series 3
MAP CHART SHOWING
CORONAVIRUS SITUATION
X Y CHART SCATTER TYPE
0
0.5
1
1.5
2
2.5
3
3.5
0 0.5 1 1.5 2 2.5 3
Y-Values
BAR CHART
0 1 2 3 4 5 6
Category 1
Category 2
Category 3
Category 4
Chart Title
Series 3 Series 2 Series 1
HISTOGRAM CHART TYPE
• Making sense of our data-rich, noisy world is
hard but vital. That’s why the first of our Top 10
Excel Features is so important. Used well,
Conditional Formatting brings out the patterns
of the universe, as captured by your
spreadsheet. That’s why Excel experts and Excel
users alike vote this the #1 most important
feature. This can be sophisticated. But even the
most straightforward colour changes can be
hugely beneficial. Suppose you have volumes
sold by sales staff each month. Just three clicks
can reveal the top 10% performing salespeople
and tee up a meaningful business
conversation.
Pivot Tables
• At four hours to get to proficiency, you
may be put off learning PivotTables, but
don’t be. Use them to sort, count, total
or average data stored in one large
spreadsheet and display them in a new
table, cut however you want. That’s the
critical thing here. If you want to look
only at sales figures for specific
countries, product lines, or marketing
channels, it’s trivial. Warning: make sure
your data is clean first!
• Grabbing (i.e. Copying) some data from one cell and
pasting it into another cell is one of the most
common activities in Excel. But there’s a lot you
might copy (formatting, value, formula, comments,
etc.) and sometimes you won’t want to copy all of it.
The most common example of this is where you want
to lose the formatting – the place this data is going
is your own spreadsheet with your own styling.
• Probably one of the most frequently
carried out activities in spreadsheeting.
Ctrl-Shift + is the shortcut, but actually, it
takes longer, so Right Click is what we
recommend. If you want to add more
than one, select as many rows or columns
as you’d like to add and then Right Click
and add.
Absolute references
• Indispensable! The dollar
in front of the letter fixes
the column, the dollar sign
in front of number fixes
the row F4 toggles
through the four possible
combinations.
• Thankyou for giving your worthful time…
• Being truthful ….this slide is almost done by me on my own…
• Your dear Samdeep Kor

Introducing a spreadsheet application.pptx

  • 2.
    Introduction to excel Excelis an integral part of Microsoft office and it has gotd enormous power to perform and render things and graphics animations and transitions.
  • 3.
    Working with interface •The area where you get to see text is spreadsheet also known as e-sheet. • Pixelated boxes are cells to get input information. • And the background tells how you get to see the interface…. Menu bar Title bar Row& column headings Sheet area and sheet tab
  • 4.
    CHARTS AND FORMULAS •Funnel charts are useful when you want to display values at multiple stages in a process. A funnel chart can show the number of sales prospects at every stage of a sales process, for example, with prospects at the top for the first stage, qualified prospects underneath it for the second stage, and so on, until you get to the final stage, closed sales. Generally, the values in funnel charts decrease with each stage, so the bars in the chart look like a funnel. Overall they’re a nice-to-have addition to Excel.
  • 5.
    WORKING WITH PIECHARTS Brian $1,100 Dave $650 Kelly $500 Sally $200 April 2019 Sales This pie chart has only four slices. This is ideal because it gives you a quick idea of how much each sales rep contributed to sales in April 2019. Here I gave example of working with pie charts…. You can refer to others which we come to see in excel…. These provide us data and information like students in mpips school in each class etc.
  • 6.
    THE WAY OTHERCHARTS LOOK • Ill show you many slides on how the charts in excel look individually….
  • 7.
    COLUMN CHART 0 1 2 3 4 5 6 Category 1Category 2 Category 3 Category 4 Chart Title Series 1 Series 2 Series 3
  • 8.
    AREA CHART 0 5 10 15 20 25 30 35 5/1/2002 6/1/20027/1/2002 8/1/2002 9/1/2002 Chart Title Series 1 Series 2
  • 9.
    LINE CHART 0 1 2 3 4 5 6 Category 1Category 2 Category 3 Category 4 Chart Title Series 1 Series 2 Series 3
  • 10.
  • 11.
    X Y CHARTSCATTER TYPE 0 0.5 1 1.5 2 2.5 3 3.5 0 0.5 1 1.5 2 2.5 3 Y-Values
  • 12.
    BAR CHART 0 12 3 4 5 6 Category 1 Category 2 Category 3 Category 4 Chart Title Series 3 Series 2 Series 1
  • 13.
  • 15.
    • Making senseof our data-rich, noisy world is hard but vital. That’s why the first of our Top 10 Excel Features is so important. Used well, Conditional Formatting brings out the patterns of the universe, as captured by your spreadsheet. That’s why Excel experts and Excel users alike vote this the #1 most important feature. This can be sophisticated. But even the most straightforward colour changes can be hugely beneficial. Suppose you have volumes sold by sales staff each month. Just three clicks can reveal the top 10% performing salespeople and tee up a meaningful business conversation.
  • 16.
    Pivot Tables • Atfour hours to get to proficiency, you may be put off learning PivotTables, but don’t be. Use them to sort, count, total or average data stored in one large spreadsheet and display them in a new table, cut however you want. That’s the critical thing here. If you want to look only at sales figures for specific countries, product lines, or marketing channels, it’s trivial. Warning: make sure your data is clean first!
  • 17.
    • Grabbing (i.e.Copying) some data from one cell and pasting it into another cell is one of the most common activities in Excel. But there’s a lot you might copy (formatting, value, formula, comments, etc.) and sometimes you won’t want to copy all of it. The most common example of this is where you want to lose the formatting – the place this data is going is your own spreadsheet with your own styling.
  • 18.
    • Probably oneof the most frequently carried out activities in spreadsheeting. Ctrl-Shift + is the shortcut, but actually, it takes longer, so Right Click is what we recommend. If you want to add more than one, select as many rows or columns as you’d like to add and then Right Click and add.
  • 19.
    Absolute references • Indispensable!The dollar in front of the letter fixes the column, the dollar sign in front of number fixes the row F4 toggles through the four possible combinations.
  • 20.
    • Thankyou forgiving your worthful time… • Being truthful ….this slide is almost done by me on my own… • Your dear Samdeep Kor