


![Presenting-Experimental-Data-Grade-8 [Autosaved].pptx](https://cdn.slidesharecdn.com/ss_thumbnails/presenting-experimental-data-grade-8autosaved-240925105557-9775d0ae-thumbnail.jpg?width=640&height=640&fit=bounds)


Intro To Excel
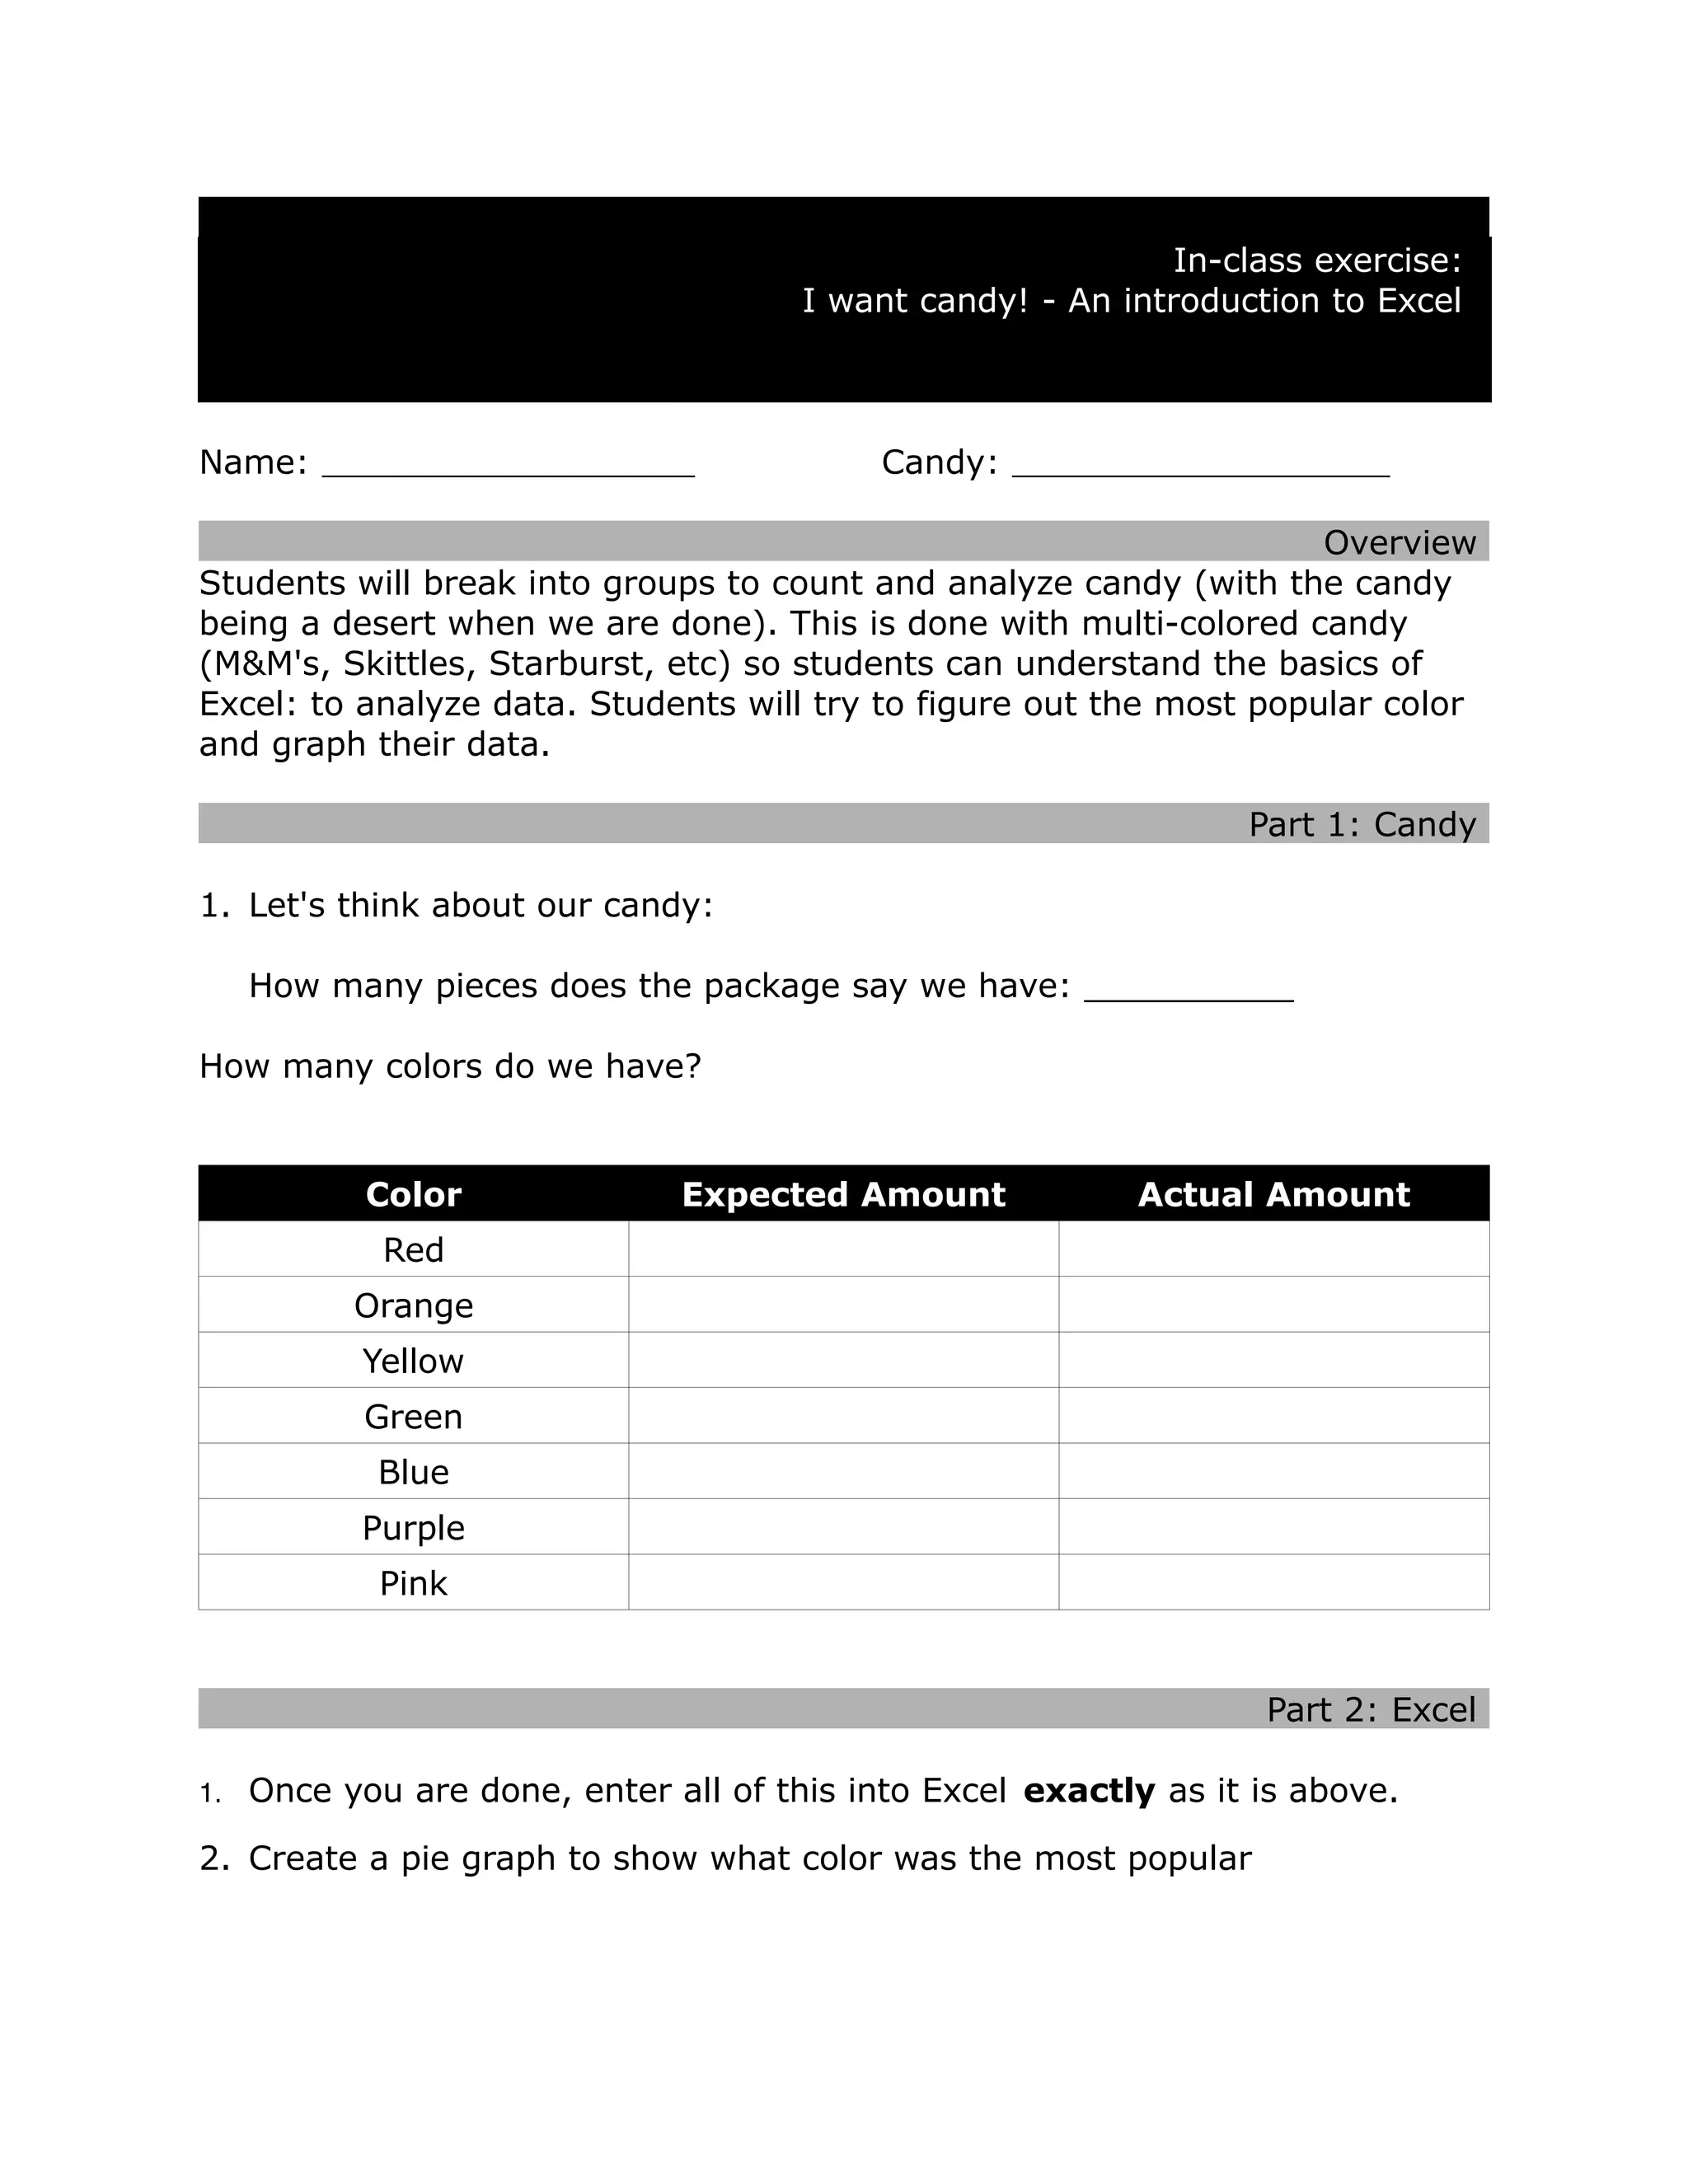
- 1. In-class exercise: I want candy! - An introduction to Excel Name: Candy: Overview Students will break into groups to count and analyze candy (with the candy being a desert when we are done). This is done with multi-colored candy (M&M's, Skittles, Starburst, etc) so students can understand the basics of Excel: to analyze data. Students will try to figure out the most popular color and graph their data. Part 1: Candy 1. Let's think about our candy: How many pieces does the package say we have: __________ How many colors do we have? Color Expected Amount Actual Amount Red Orange Yellow Green Blue Purple Pink Part 2: Excel 1. Once you are done, enter all of this into Excel exactly as it is above. 2. Create a pie graph to show what color was the most popular