This document provides an overview of key concepts in descriptive statistics including:
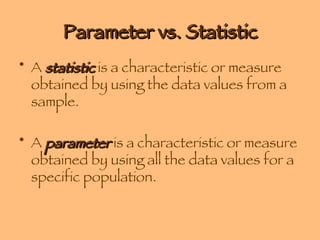
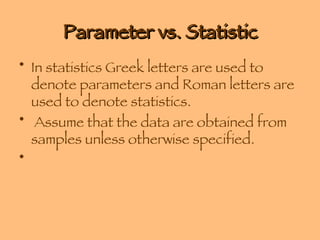
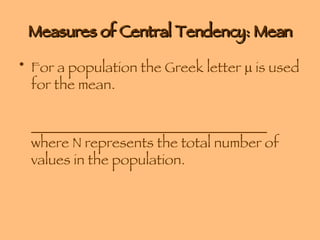
- Parameters describe populations while statistics describe samples
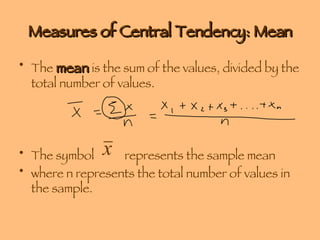
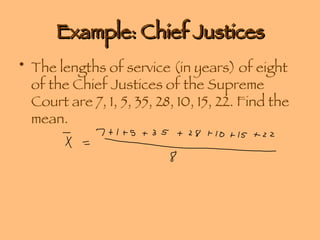
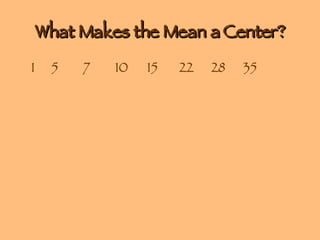
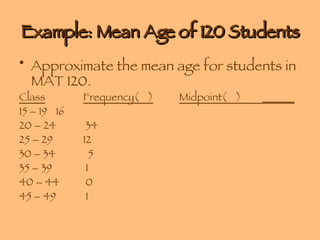
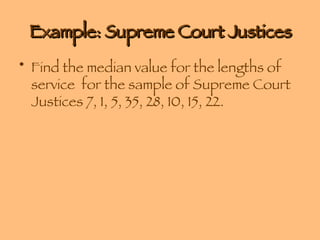
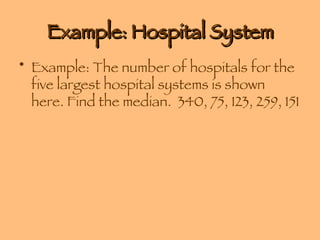
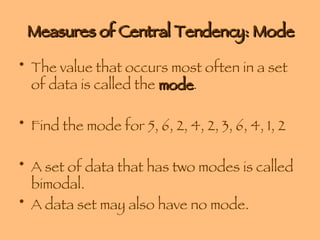
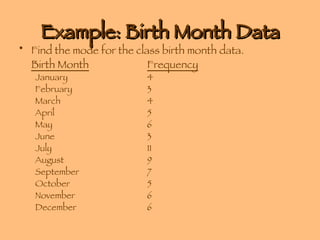
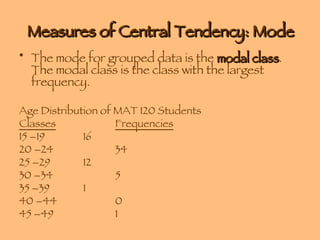
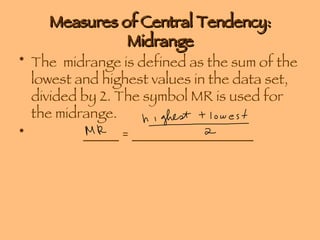
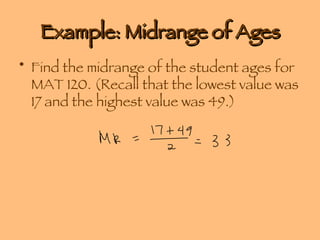
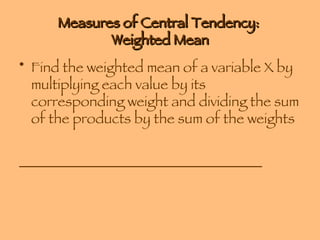
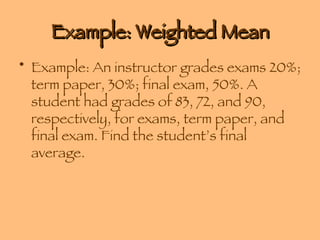
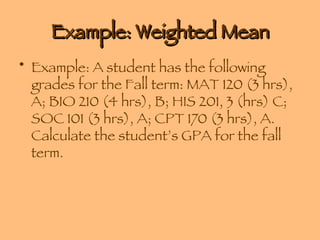
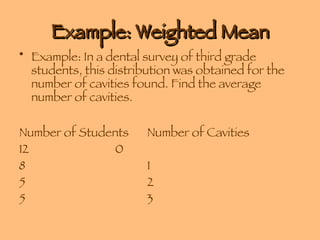
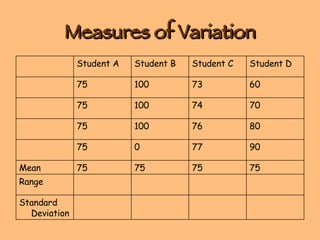
- Measures of central tendency include the mean, median, and mode
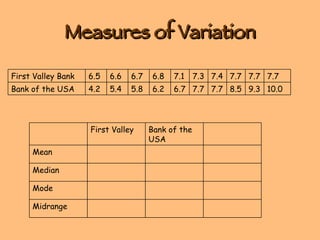
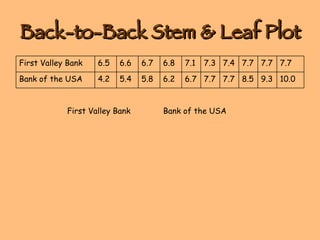
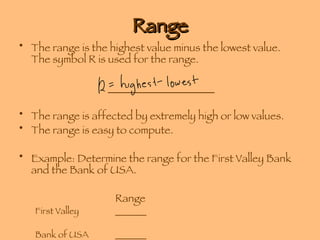
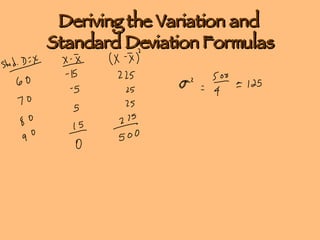
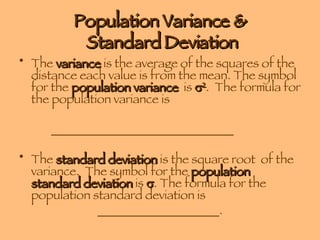
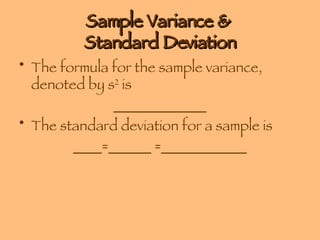
- Measures of variation/dispersion include range, variance, standard deviation, and coefficient of variation
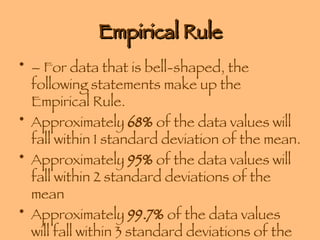
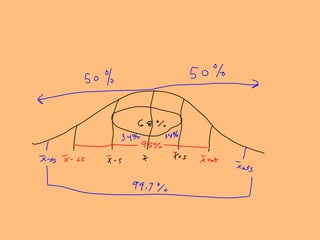
- The empirical rule describes how many data points fall within a certain number of standard deviations from the mean for a normal distribution