Downloaded 1,027 times
![Wednesday, February 6,
2019
2
Course Outcomes
CO.1 [MC1307.1] Measure various electrical parameters with accuracy, precision,
resolution.
CO.2 [MC1307.2] Explain the use of various electrical/electronic instruments, their
construction, principles of operation, standards and units of
measurements.
CO.3 [MC1307.3] Explain the industrial and laboratory applications of Electrical/Electronic
instruments.
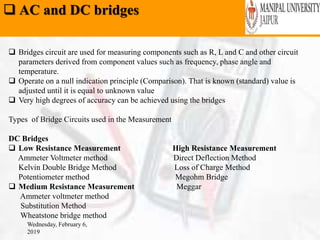
CO.4 [MC1307.5] Understand the concept of AC and DC bridges for the measurement of
Resistance, Inductance and Capacitance.
CO.5 [MC1307.4] Select appropriate passive or active transducers for measurement of
physical phenomenon like temperature, pressure, flow, liquid level,
displacement, speed etc.](https://image.slidesharecdn.com/emi2018-190206064859/85/Electronic-Measurement-and-Instrumentation-2-320.jpg)


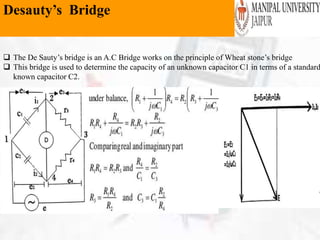

The document outlines the syllabus for the Electronic Measurement and Instrumentation course (MC1307) led by Princy Randhawa, covering essential electrical parameters measurement, instrument usage, application in industrial settings, and understanding of AC and DC bridges. It also details course objectives, outcomes, marking schemes, definitions of measurement, methods, classifications of instruments, and specific types of measuring devices like PMMC and moving iron instruments. Additionally, it includes references for textbooks and resources for further study.


