SlideShare a Scribd company logo
DISEASE MAPPING
Eric Delmelle
Geography & Earth Sciences, University of North Carolina at Charlotte,N.C.,U.S.A.
University of Eastern Finland (UEF) October 22 2018
Presentation of IMPRO project funded by Strategic Research Council
Introduction
• Different ways to map health related data
• Scattermap
• Areal data (choropleth mapping)
• Cases aggregated to geographic units
• Generally mapped as rates, using
population at risk as a denominator
• In the case of breast cancer deaths,
count of cancer deaths divided by
females (can be more restrictive for
the age segment).
Disease mapping Introduction
Rationale
• GIScientists and epidemiologists are interested to map the
variation of these rates across a specific region.
Disease mapping
• The map indicates that individuals
dying from tracheal, bronchus and lung
cancer are mostly concentrated in the
Appalachian regions (very rural, with
deprived access to care).
• Very low rates Southern Idaho, and
Utah, but also parts of Arizona, New
Mexico and Colorado. Note that
Southern Idaho and Utah are mostly
Mormon, where smoking is certainly
not encouraged.
Introduction
Rationale
Another example for the
Eastern USA, just focusing on
average annual rates for lung
and tracheal cancer rates
among males from 2011 to
2015, and using the 65+ male
census population as the
denominator
Disease mapping Introduction
Rationale
Disease mapping
• Clearly we saw some patterns, very
high in the Appalachian, but lower
along the coast.
• We also see thatVirginia has lower
rates.
• There could be some reasons for
this, such as prevention measures
that can vary by state.
• Although smoking is the main factor
contributing to lung cancer, living in
a heavy coal-mining area such as
Kentucky is found to be an
additional risk factor as residents in
these areas are exposed to
pollution from mining activities.
Introduction
Estimating spatial patterns/clusters
Disease mapping
• Evaluate whether regions of high rate have a tendency to cluster, using
techniques such as Moran’s I.
• Moran’s I will evaluate whether neighboring census units (in our case, counties)
tend to exhibit similar (high, or low) values.
• Adjacency matrix W; that is for each geographic unit, determine its neighbors, for
instance through an adjacency matrix (0 or 1 – resulting in wij), or the number
of closest neighbors (Rook versus Queen).This can easily be done within a
commercial GIS or Geoda.
Patterns and clustering
Estimating spatial patterns/clusters
Disease mapping
• Once this is complete, we can evaluate the Moran’s I.
𝐼 =
𝑁
𝑊
𝑤𝑖𝑗(𝑂𝑖 − 𝑂)(𝑂𝑗 − 𝑂𝑗𝑖
𝑂𝑗 − 𝑂
2
𝑖
With N the number of geographic units and O the rate.The term wij
denotes the adjacency value between i and j and W the sum.
Patterns and clustering
Estimating local spatial patterns/clusters
Disease mapping
• Unfortunately, the Moran’s I statistic does not tell us where clusters may be
located. Anselin developed a local version of the test, taking on the same values.
• The results can be particularly useful for health purposes.
Patterns and clustering
Estimating local spatial patterns/clusters
Disease mapping
• The local Moran’s I also returns a map of its significance
Patterns and clustering
Issues with rates
Disease mapping
• Oftentimes, assumption of normality. But not so evident when you use
proportion or count. – rather use Poisson or binomial distribution…the
variance may be related to the mean value.
Rates
Crude rate
𝑟𝑖 =
𝑂𝑖
𝑃𝑖
with 𝑂𝑖 observed count at i and 𝑃𝑖 the population at risk at i.
 The use of crude rates and ratios to estimate rare disease risks in small
areas is often problematic since these measures are typically subject to
large chance variation.
 Disease maps that are based directly on these crude estimates are difficult
to interpret and often misleading  unreliable rates that occur for sparsely
populated areas and/or rare cancers
Issues with rates
Disease mapping Rates
Standard Mortality Rate (SMR) – also called excess or relative risk
Then, the expected number
of events in i 𝐸𝑖 (also noted 𝜇𝑖)
is given as:
Idea is to compare observed mortality rate to a national (or regional) standard.
We will compare the number of events to the expected count of events.
𝜋 =
𝑂𝑖𝑖∈𝐼
𝑃𝑖𝑖∈𝐼
Reference rate
𝐸𝑖 = 𝜋 ∗ 𝑃𝑖
𝑆𝑀𝑅𝑖 =
𝑂𝑖
𝐸𝑖
SMR
Issues with rates
Disease mapping Rates
Population….
Issues with rates
Disease mapping Rates
• A very high relative risk (or SMR) could also happen if you have one case, and
expect 0.1 (near 1,000). Interestingly enough, this would lead to the same SMR:
(𝑂𝑖=100, 𝐸𝑖=50) and (𝑂𝑖=3, 𝐸𝑖=1.5) – same SMR.
• But if I add just one case to the second scenario, I would end up with wild SMR.
This suggests that the reliability of the estimates can vary widely and we need to
take the reliability into account.
• Probability mapping maps the probability of getting a count more ‘extreme’ than
the one we actually observed – assumption is that the count in each area is
Poisson distribution with mean value 𝜇𝑖
Issues with rates
Disease mapping Rates
• Extreme ratios associated with areas with the smallest populations.
• Solutions. Disease mapping methods, usually using Bayesian inference, seek to
borrow strength across areas to produce stable risk estimates. Essentially, we try
to improve the reliability of observed rates by using (or “borrowing”) information
from neighboring entities (Waller and Gotway 2004).
• The model is fit using data, and estimates of relative risks based on posterior
distributions for the random effects are derived.
• The resulting estimates for disease risks in small areas are based on pooling
information from related areas.
• Maps based on these estimates are often more interpretable and informative
(Lawson et al., 1999; Elliott et al., 2 000).
Empirical Bayesian Estimates
Disease mapping EBS
• Let’s suppose that we are trying to estimate the observed rate, say 𝜃𝑖 Then, we
can re-write this as:
• With 𝛾𝑖 and 𝜑𝑖 the mean and the variance of the prior probability distribution,
respectively.The first part of Equation puts emphasis on the observed rate, while
the second emphasizes prior belief.
𝜃𝑖 = 𝑤𝑖 ∗ 𝑟𝑖 + (1 − 𝑤𝑖) ∗ 𝛾𝑖
Empirical Bayesian Estimates
Disease mapping EBS
• The term 𝑤𝑖 is defined as follows:
• So then how to get 𝛾𝑖 and 𝜑𝑖? A first estimate would be that 𝛾𝑖 = 𝛾 and 𝜑𝑖 = 𝜑
for all areas.This means that the prior is gamma distributed with two parameters
𝑣 (scale) and 𝛼 (shape).We can deduct that 𝛾 =
𝑣
𝛼
and 𝜑 =
𝑣
𝛼2.
𝑤𝑖 =
𝜑𝑖
𝜑𝑖 +
𝛾𝑖
𝑛𝑖
Empirical Bayesian Estimates
Disease mapping EBS
Local Empirical Bayesian Estimates
Disease mapping EBS
Strength is borrowed from to correct for variance instability is localized as
opposed to global (i.e., based on all observations)
Local Empirical Bayesian Estimates
Disease mapping EBS
Strength is borrowed from to correct for variance instability is localized as
opposed to global (i.e., based on all observations)
Local Empirical Bayesian Estimates
Disease mapping EBS
Strength is borrowed from to correct for variance instability is localized as
opposed to global (i.e., based on all observations)
Questions
Department of Geography and Earth Sciences
University of North Carolina at Charlotte
Charlotte, NC 28223
Tel: (704) 687-5991
Email: Eric.Delmelle@uncc.edu
Disease mapping

More Related Content

What's hot

Ecological study design multiple group study and statistical analysis
Ecological study design multiple group study and statistical analysisEcological study design multiple group study and statistical analysis
Ecological study design multiple group study and statistical analysis
sirjana Tiwari
 
GIS data analysis
GIS data analysisGIS data analysis
GIS data analysis
Arindam Sarkar
 
Seminar on gis analysis functions
Seminar on gis analysis functionsSeminar on gis analysis functions
Seminar on gis analysis functions
Pramoda Raj
 
chapter19. Terrestrial and Close-Range Photogrammetry.pdf
chapter19. Terrestrial and Close-Range Photogrammetry.pdfchapter19. Terrestrial and Close-Range Photogrammetry.pdf
chapter19. Terrestrial and Close-Range Photogrammetry.pdf
ssuser3f7a17
 
Unmanned Aerial Vehicle Application
Unmanned Aerial Vehicle ApplicationUnmanned Aerial Vehicle Application
Unmanned Aerial Vehicle Application
NopphawanTamkuan
 
Review on Digital Elevation Model
Review on Digital Elevation ModelReview on Digital Elevation Model
Review on Digital Elevation Model
IJMER
 
Research in geography
Research in geographyResearch in geography
Research in geography
Arindam Sarkar
 
Map Design and Symbology in GIS Environment
Map Design and Symbology in GIS EnvironmentMap Design and Symbology in GIS Environment
Map Design and Symbology in GIS Environment
Kaium Chowdhury
 
An introduction to geographic information systems (gis) m goulbourne 2007
An introduction to geographic information systems (gis)   m goulbourne 2007An introduction to geographic information systems (gis)   m goulbourne 2007
An introduction to geographic information systems (gis) m goulbourne 2007
Michelle Goulbourne @ DiaMind Health
 
Photogrammetry.pdf
Photogrammetry.pdfPhotogrammetry.pdf
Photogrammetry.pdf
BSuresh26
 
7. logistics regression using spss
7. logistics regression using spss7. logistics regression using spss
7. logistics regression using spss
Dr Nisha Arora
 
Spatial vs non spatial
Spatial vs non spatialSpatial vs non spatial
Spatial vs non spatialSumant Diwakar
 
Unit 5
Unit 5Unit 5
GIS - Lecture 4
GIS - Lecture 4GIS - Lecture 4
GIS - Lecture 4sorbi
 
Mantel Haenszel methods in epidemiology (Stratification)
Mantel Haenszel methods in epidemiology (Stratification) Mantel Haenszel methods in epidemiology (Stratification)
Mantel Haenszel methods in epidemiology (Stratification)
Rizwan S A
 
Application of gps
Application of gpsApplication of gps
Application of gps
Selvakumar Radhakrishnan
 
GEOPROCESSING IN QGIS
GEOPROCESSING IN QGISGEOPROCESSING IN QGIS
GEOPROCESSING IN QGIS
Swetha A
 

What's hot (20)

Gis concepts
Gis conceptsGis concepts
Gis concepts
 
Ecological study design multiple group study and statistical analysis
Ecological study design multiple group study and statistical analysisEcological study design multiple group study and statistical analysis
Ecological study design multiple group study and statistical analysis
 
GIS data analysis
GIS data analysisGIS data analysis
GIS data analysis
 
Seminar on gis analysis functions
Seminar on gis analysis functionsSeminar on gis analysis functions
Seminar on gis analysis functions
 
chapter19. Terrestrial and Close-Range Photogrammetry.pdf
chapter19. Terrestrial and Close-Range Photogrammetry.pdfchapter19. Terrestrial and Close-Range Photogrammetry.pdf
chapter19. Terrestrial and Close-Range Photogrammetry.pdf
 
Unmanned Aerial Vehicle Application
Unmanned Aerial Vehicle ApplicationUnmanned Aerial Vehicle Application
Unmanned Aerial Vehicle Application
 
Review on Digital Elevation Model
Review on Digital Elevation ModelReview on Digital Elevation Model
Review on Digital Elevation Model
 
Research in geography
Research in geographyResearch in geography
Research in geography
 
Map Design and Symbology in GIS Environment
Map Design and Symbology in GIS EnvironmentMap Design and Symbology in GIS Environment
Map Design and Symbology in GIS Environment
 
An introduction to geographic information systems (gis) m goulbourne 2007
An introduction to geographic information systems (gis)   m goulbourne 2007An introduction to geographic information systems (gis)   m goulbourne 2007
An introduction to geographic information systems (gis) m goulbourne 2007
 
Photogrammetry.pdf
Photogrammetry.pdfPhotogrammetry.pdf
Photogrammetry.pdf
 
7. logistics regression using spss
7. logistics regression using spss7. logistics regression using spss
7. logistics regression using spss
 
Spatial vs non spatial
Spatial vs non spatialSpatial vs non spatial
Spatial vs non spatial
 
Introduction to GIS
Introduction to GISIntroduction to GIS
Introduction to GIS
 
Unit 5
Unit 5Unit 5
Unit 5
 
cca stat
cca statcca stat
cca stat
 
GIS - Lecture 4
GIS - Lecture 4GIS - Lecture 4
GIS - Lecture 4
 
Mantel Haenszel methods in epidemiology (Stratification)
Mantel Haenszel methods in epidemiology (Stratification) Mantel Haenszel methods in epidemiology (Stratification)
Mantel Haenszel methods in epidemiology (Stratification)
 
Application of gps
Application of gpsApplication of gps
Application of gps
 
GEOPROCESSING IN QGIS
GEOPROCESSING IN QGISGEOPROCESSING IN QGIS
GEOPROCESSING IN QGIS
 

Similar to Eric Delmelle: Disease Mapping

BIOSTAT.pptx
BIOSTAT.pptxBIOSTAT.pptx
BIOSTAT.pptx
DoiLoreto
 
Graphical presentation of data
Graphical presentation of dataGraphical presentation of data
Graphical presentation of datadrasifk
 
Statistics "Descriptive & Inferential"
Statistics "Descriptive & Inferential"Statistics "Descriptive & Inferential"
Statistics "Descriptive & Inferential"
Dalia El-Shafei
 
ADVANCED STATISTICS PREVIOUS YEAR QUESTIONS.docx
ADVANCED STATISTICS PREVIOUS YEAR QUESTIONS.docxADVANCED STATISTICS PREVIOUS YEAR QUESTIONS.docx
ADVANCED STATISTICS PREVIOUS YEAR QUESTIONS.docx
TaskiaSarkar
 
PG STAT 531 Lecture 5 Probability Distribution
PG STAT 531 Lecture 5 Probability DistributionPG STAT 531 Lecture 5 Probability Distribution
PG STAT 531 Lecture 5 Probability Distribution
Aashish Patel
 
1.1 course notes inferential statistics
1.1 course notes inferential statistics1.1 course notes inferential statistics
1.1 course notes inferential statistics
Djamel Bob
 
Descriptive Statistics
Descriptive StatisticsDescriptive Statistics
Descriptive Statistics
Kush Kulshrestha
 
Exploratory Data Analysis for Biotechnology and Pharmaceutical Sciences
Exploratory Data Analysis for Biotechnology and Pharmaceutical SciencesExploratory Data Analysis for Biotechnology and Pharmaceutical Sciences
Exploratory Data Analysis for Biotechnology and Pharmaceutical Sciences
Parag Shah
 
Research methodology3
Research methodology3Research methodology3
Research methodology3Tosif Ahmad
 
Normal curve in Biostatistics data inference and applications
Normal curve in Biostatistics data inference and applicationsNormal curve in Biostatistics data inference and applications
Normal curve in Biostatistics data inference and applications
Bala Vidyadhar
 
Lecture-2 (discriptive statistics).ppt
Lecture-2 (discriptive statistics).pptLecture-2 (discriptive statistics).ppt
Lecture-2 (discriptive statistics).ppt
habtamu biazin
 
Medical Statistics Part-I:Descriptive statistics
Medical Statistics Part-I:Descriptive statisticsMedical Statistics Part-I:Descriptive statistics
Medical Statistics Part-I:Descriptive statistics
Ramachandra Barik
 
STAT 350 (Spring 2017) Homework 11 (20 points + 1 point BONUS).docx
STAT 350 (Spring 2017) Homework 11 (20 points + 1 point BONUS).docxSTAT 350 (Spring 2017) Homework 11 (20 points + 1 point BONUS).docx
STAT 350 (Spring 2017) Homework 11 (20 points + 1 point BONUS).docx
whitneyleman54422
 
Research methodology and iostatistics ppt
Research methodology and iostatistics pptResearch methodology and iostatistics ppt
Research methodology and iostatistics ppt
Nikhat Mohammadi
 
M.Ed Tcs 2 seminar ppt npc to submit
M.Ed Tcs 2 seminar ppt npc   to submitM.Ed Tcs 2 seminar ppt npc   to submit
M.Ed Tcs 2 seminar ppt npc to submit
BINCYKMATHEW
 
Biostatistics_descriptive stats.pptx
Biostatistics_descriptive stats.pptxBiostatistics_descriptive stats.pptx
Biostatistics_descriptive stats.pptx
MohammedAbdela7
 
Basics in Epidemiology & Biostatistics 2 RSS6 2014
Basics in Epidemiology & Biostatistics 2 RSS6 2014Basics in Epidemiology & Biostatistics 2 RSS6 2014
Basics in Epidemiology & Biostatistics 2 RSS6 2014RSS6
 
Introduction to statistics RSS6 2014
Introduction to statistics RSS6 2014Introduction to statistics RSS6 2014
Introduction to statistics RSS6 2014RSS6
 
1 lab basicstatisticsfall2013
1 lab basicstatisticsfall20131 lab basicstatisticsfall2013
1 lab basicstatisticsfall2013TAMUK
 

Similar to Eric Delmelle: Disease Mapping (20)

BIOSTAT.pptx
BIOSTAT.pptxBIOSTAT.pptx
BIOSTAT.pptx
 
Graphical presentation of data
Graphical presentation of dataGraphical presentation of data
Graphical presentation of data
 
Statistics "Descriptive & Inferential"
Statistics "Descriptive & Inferential"Statistics "Descriptive & Inferential"
Statistics "Descriptive & Inferential"
 
Statistics excellent
Statistics excellentStatistics excellent
Statistics excellent
 
ADVANCED STATISTICS PREVIOUS YEAR QUESTIONS.docx
ADVANCED STATISTICS PREVIOUS YEAR QUESTIONS.docxADVANCED STATISTICS PREVIOUS YEAR QUESTIONS.docx
ADVANCED STATISTICS PREVIOUS YEAR QUESTIONS.docx
 
PG STAT 531 Lecture 5 Probability Distribution
PG STAT 531 Lecture 5 Probability DistributionPG STAT 531 Lecture 5 Probability Distribution
PG STAT 531 Lecture 5 Probability Distribution
 
1.1 course notes inferential statistics
1.1 course notes inferential statistics1.1 course notes inferential statistics
1.1 course notes inferential statistics
 
Descriptive Statistics
Descriptive StatisticsDescriptive Statistics
Descriptive Statistics
 
Exploratory Data Analysis for Biotechnology and Pharmaceutical Sciences
Exploratory Data Analysis for Biotechnology and Pharmaceutical SciencesExploratory Data Analysis for Biotechnology and Pharmaceutical Sciences
Exploratory Data Analysis for Biotechnology and Pharmaceutical Sciences
 
Research methodology3
Research methodology3Research methodology3
Research methodology3
 
Normal curve in Biostatistics data inference and applications
Normal curve in Biostatistics data inference and applicationsNormal curve in Biostatistics data inference and applications
Normal curve in Biostatistics data inference and applications
 
Lecture-2 (discriptive statistics).ppt
Lecture-2 (discriptive statistics).pptLecture-2 (discriptive statistics).ppt
Lecture-2 (discriptive statistics).ppt
 
Medical Statistics Part-I:Descriptive statistics
Medical Statistics Part-I:Descriptive statisticsMedical Statistics Part-I:Descriptive statistics
Medical Statistics Part-I:Descriptive statistics
 
STAT 350 (Spring 2017) Homework 11 (20 points + 1 point BONUS).docx
STAT 350 (Spring 2017) Homework 11 (20 points + 1 point BONUS).docxSTAT 350 (Spring 2017) Homework 11 (20 points + 1 point BONUS).docx
STAT 350 (Spring 2017) Homework 11 (20 points + 1 point BONUS).docx
 
Research methodology and iostatistics ppt
Research methodology and iostatistics pptResearch methodology and iostatistics ppt
Research methodology and iostatistics ppt
 
M.Ed Tcs 2 seminar ppt npc to submit
M.Ed Tcs 2 seminar ppt npc   to submitM.Ed Tcs 2 seminar ppt npc   to submit
M.Ed Tcs 2 seminar ppt npc to submit
 
Biostatistics_descriptive stats.pptx
Biostatistics_descriptive stats.pptxBiostatistics_descriptive stats.pptx
Biostatistics_descriptive stats.pptx
 
Basics in Epidemiology & Biostatistics 2 RSS6 2014
Basics in Epidemiology & Biostatistics 2 RSS6 2014Basics in Epidemiology & Biostatistics 2 RSS6 2014
Basics in Epidemiology & Biostatistics 2 RSS6 2014
 
Introduction to statistics RSS6 2014
Introduction to statistics RSS6 2014Introduction to statistics RSS6 2014
Introduction to statistics RSS6 2014
 
1 lab basicstatisticsfall2013
1 lab basicstatisticsfall20131 lab basicstatisticsfall2013
1 lab basicstatisticsfall2013
 

More from THL

Somaattinen erikoissairaanhoito 2021
Somaattinen erikoissairaanhoito 2021Somaattinen erikoissairaanhoito 2021
Somaattinen erikoissairaanhoito 2021
THL
 
Niiranen_Jalkautuvan_nuorisotyon_vaikutusten_ennakkoarviointi_27092022.pdf
Niiranen_Jalkautuvan_nuorisotyon_vaikutusten_ennakkoarviointi_27092022.pdfNiiranen_Jalkautuvan_nuorisotyon_vaikutusten_ennakkoarviointi_27092022.pdf
Niiranen_Jalkautuvan_nuorisotyon_vaikutusten_ennakkoarviointi_27092022.pdf
THL
 
Ylitalo_EPT_vaikutusten_ennakkoarviointi_tulevaisuudessa_27092022.pdf
Ylitalo_EPT_vaikutusten_ennakkoarviointi_tulevaisuudessa_27092022.pdfYlitalo_EPT_vaikutusten_ennakkoarviointi_tulevaisuudessa_27092022.pdf
Ylitalo_EPT_vaikutusten_ennakkoarviointi_tulevaisuudessa_27092022.pdf
THL
 
Nieminen_Niemi_Kuntaliitto_Mita_on_paatosten_EVA_Tyokalu_tutuksi_27092022.pdf
Nieminen_Niemi_Kuntaliitto_Mita_on_paatosten_EVA_Tyokalu_tutuksi_27092022.pdfNieminen_Niemi_Kuntaliitto_Mita_on_paatosten_EVA_Tyokalu_tutuksi_27092022.pdf
Nieminen_Niemi_Kuntaliitto_Mita_on_paatosten_EVA_Tyokalu_tutuksi_27092022.pdf
THL
 
Raitasalo_Nuorten_paihteidenkayton_yleiskuva_10102022.pdf
Raitasalo_Nuorten_paihteidenkayton_yleiskuva_10102022.pdfRaitasalo_Nuorten_paihteidenkayton_yleiskuva_10102022.pdf
Raitasalo_Nuorten_paihteidenkayton_yleiskuva_10102022.pdf
THL
 
Hietanen_Peltola_Jahnukainen_Miten_opiskeluhuoltopalvelut_tukevat_hyvinvointi...
Hietanen_Peltola_Jahnukainen_Miten_opiskeluhuoltopalvelut_tukevat_hyvinvointi...Hietanen_Peltola_Jahnukainen_Miten_opiskeluhuoltopalvelut_tukevat_hyvinvointi...
Hietanen_Peltola_Jahnukainen_Miten_opiskeluhuoltopalvelut_tukevat_hyvinvointi...
THL
 
Lansikallio_Paihdekasvatus_EPT_oppilaitoksissa_10102022.pdf
Lansikallio_Paihdekasvatus_EPT_oppilaitoksissa_10102022.pdfLansikallio_Paihdekasvatus_EPT_oppilaitoksissa_10102022.pdf
Lansikallio_Paihdekasvatus_EPT_oppilaitoksissa_10102022.pdf
THL
 
Markkula_Vaikuttava ehkaiseva paihdetyo_10102022.pdf
Markkula_Vaikuttava ehkaiseva paihdetyo_10102022.pdfMarkkula_Vaikuttava ehkaiseva paihdetyo_10102022.pdf
Markkula_Vaikuttava ehkaiseva paihdetyo_10102022.pdf
THL
 
Erikoissairaanhoidon hoitoonpääsy 31.08.2022
Erikoissairaanhoidon hoitoonpääsy 31.08.2022Erikoissairaanhoidon hoitoonpääsy 31.08.2022
Erikoissairaanhoidon hoitoonpääsy 31.08.2022
THL
 
Rikos- ja riita-asioiden sovittelu 2021 -tilasto
Rikos- ja riita-asioiden sovittelu 2021 -tilastoRikos- ja riita-asioiden sovittelu 2021 -tilasto
Rikos- ja riita-asioiden sovittelu 2021 -tilasto
THL
 
Synthetic Opioid Preparedness in Europe
Synthetic Opioid Preparedness in EuropeSynthetic Opioid Preparedness in Europe
Synthetic Opioid Preparedness in Europe
THL
 
Sosiaalihuollon laitos- ja asumispalvelut 2021
Sosiaalihuollon laitos- ja asumispalvelut 2021Sosiaalihuollon laitos- ja asumispalvelut 2021
Sosiaalihuollon laitos- ja asumispalvelut 2021
THL
 
Hoitoonpääsy perusterveydenhuollossa keväällä 2022
Hoitoonpääsy perusterveydenhuollossa keväällä 2022Hoitoonpääsy perusterveydenhuollossa keväällä 2022
Hoitoonpääsy perusterveydenhuollossa keväällä 2022
THL
 
Aktuellt om coronavaccinationer - vaccinering under sommaren.pdf
Aktuellt om coronavaccinationer - vaccinering under sommaren.pdfAktuellt om coronavaccinationer - vaccinering under sommaren.pdf
Aktuellt om coronavaccinationer - vaccinering under sommaren.pdf
THL
 
Kort information och aktuella frågor om vaccinationer
Kort information och aktuella frågor om vaccinationerKort information och aktuella frågor om vaccinationer
Kort information och aktuella frågor om vaccinationer
THL
 
Förvaring av vacciner
Förvaring av vaccinerFörvaring av vacciner
Förvaring av vacciner
THL
 
Johannes Kohal: Henkilöstömitoituksen seurantaan tarvittavat tiedot ja tiedon...
Johannes Kohal: Henkilöstömitoituksen seurantaan tarvittavat tiedot ja tiedon...Johannes Kohal: Henkilöstömitoituksen seurantaan tarvittavat tiedot ja tiedon...
Johannes Kohal: Henkilöstömitoituksen seurantaan tarvittavat tiedot ja tiedon...
THL
 
Hanna Alastalo: Henkilöstömitoituksen seurannan kehitys ja aikataulu
Hanna Alastalo: Henkilöstömitoituksen seurannan kehitys ja aikatauluHanna Alastalo: Henkilöstömitoituksen seurannan kehitys ja aikataulu
Hanna Alastalo: Henkilöstömitoituksen seurannan kehitys ja aikataulu
THL
 
Ajankohtaista koronarokotuksista 2.6.2022
Ajankohtaista koronarokotuksista 2.6.2022Ajankohtaista koronarokotuksista 2.6.2022
Ajankohtaista koronarokotuksista 2.6.2022
THL
 
Tietoisku eri rokotteista
Tietoisku eri rokotteistaTietoisku eri rokotteista
Tietoisku eri rokotteista
THL
 

More from THL (20)

Somaattinen erikoissairaanhoito 2021
Somaattinen erikoissairaanhoito 2021Somaattinen erikoissairaanhoito 2021
Somaattinen erikoissairaanhoito 2021
 
Niiranen_Jalkautuvan_nuorisotyon_vaikutusten_ennakkoarviointi_27092022.pdf
Niiranen_Jalkautuvan_nuorisotyon_vaikutusten_ennakkoarviointi_27092022.pdfNiiranen_Jalkautuvan_nuorisotyon_vaikutusten_ennakkoarviointi_27092022.pdf
Niiranen_Jalkautuvan_nuorisotyon_vaikutusten_ennakkoarviointi_27092022.pdf
 
Ylitalo_EPT_vaikutusten_ennakkoarviointi_tulevaisuudessa_27092022.pdf
Ylitalo_EPT_vaikutusten_ennakkoarviointi_tulevaisuudessa_27092022.pdfYlitalo_EPT_vaikutusten_ennakkoarviointi_tulevaisuudessa_27092022.pdf
Ylitalo_EPT_vaikutusten_ennakkoarviointi_tulevaisuudessa_27092022.pdf
 
Nieminen_Niemi_Kuntaliitto_Mita_on_paatosten_EVA_Tyokalu_tutuksi_27092022.pdf
Nieminen_Niemi_Kuntaliitto_Mita_on_paatosten_EVA_Tyokalu_tutuksi_27092022.pdfNieminen_Niemi_Kuntaliitto_Mita_on_paatosten_EVA_Tyokalu_tutuksi_27092022.pdf
Nieminen_Niemi_Kuntaliitto_Mita_on_paatosten_EVA_Tyokalu_tutuksi_27092022.pdf
 
Raitasalo_Nuorten_paihteidenkayton_yleiskuva_10102022.pdf
Raitasalo_Nuorten_paihteidenkayton_yleiskuva_10102022.pdfRaitasalo_Nuorten_paihteidenkayton_yleiskuva_10102022.pdf
Raitasalo_Nuorten_paihteidenkayton_yleiskuva_10102022.pdf
 
Hietanen_Peltola_Jahnukainen_Miten_opiskeluhuoltopalvelut_tukevat_hyvinvointi...
Hietanen_Peltola_Jahnukainen_Miten_opiskeluhuoltopalvelut_tukevat_hyvinvointi...Hietanen_Peltola_Jahnukainen_Miten_opiskeluhuoltopalvelut_tukevat_hyvinvointi...
Hietanen_Peltola_Jahnukainen_Miten_opiskeluhuoltopalvelut_tukevat_hyvinvointi...
 
Lansikallio_Paihdekasvatus_EPT_oppilaitoksissa_10102022.pdf
Lansikallio_Paihdekasvatus_EPT_oppilaitoksissa_10102022.pdfLansikallio_Paihdekasvatus_EPT_oppilaitoksissa_10102022.pdf
Lansikallio_Paihdekasvatus_EPT_oppilaitoksissa_10102022.pdf
 
Markkula_Vaikuttava ehkaiseva paihdetyo_10102022.pdf
Markkula_Vaikuttava ehkaiseva paihdetyo_10102022.pdfMarkkula_Vaikuttava ehkaiseva paihdetyo_10102022.pdf
Markkula_Vaikuttava ehkaiseva paihdetyo_10102022.pdf
 
Erikoissairaanhoidon hoitoonpääsy 31.08.2022
Erikoissairaanhoidon hoitoonpääsy 31.08.2022Erikoissairaanhoidon hoitoonpääsy 31.08.2022
Erikoissairaanhoidon hoitoonpääsy 31.08.2022
 
Rikos- ja riita-asioiden sovittelu 2021 -tilasto
Rikos- ja riita-asioiden sovittelu 2021 -tilastoRikos- ja riita-asioiden sovittelu 2021 -tilasto
Rikos- ja riita-asioiden sovittelu 2021 -tilasto
 
Synthetic Opioid Preparedness in Europe
Synthetic Opioid Preparedness in EuropeSynthetic Opioid Preparedness in Europe
Synthetic Opioid Preparedness in Europe
 
Sosiaalihuollon laitos- ja asumispalvelut 2021
Sosiaalihuollon laitos- ja asumispalvelut 2021Sosiaalihuollon laitos- ja asumispalvelut 2021
Sosiaalihuollon laitos- ja asumispalvelut 2021
 
Hoitoonpääsy perusterveydenhuollossa keväällä 2022
Hoitoonpääsy perusterveydenhuollossa keväällä 2022Hoitoonpääsy perusterveydenhuollossa keväällä 2022
Hoitoonpääsy perusterveydenhuollossa keväällä 2022
 
Aktuellt om coronavaccinationer - vaccinering under sommaren.pdf
Aktuellt om coronavaccinationer - vaccinering under sommaren.pdfAktuellt om coronavaccinationer - vaccinering under sommaren.pdf
Aktuellt om coronavaccinationer - vaccinering under sommaren.pdf
 
Kort information och aktuella frågor om vaccinationer
Kort information och aktuella frågor om vaccinationerKort information och aktuella frågor om vaccinationer
Kort information och aktuella frågor om vaccinationer
 
Förvaring av vacciner
Förvaring av vaccinerFörvaring av vacciner
Förvaring av vacciner
 
Johannes Kohal: Henkilöstömitoituksen seurantaan tarvittavat tiedot ja tiedon...
Johannes Kohal: Henkilöstömitoituksen seurantaan tarvittavat tiedot ja tiedon...Johannes Kohal: Henkilöstömitoituksen seurantaan tarvittavat tiedot ja tiedon...
Johannes Kohal: Henkilöstömitoituksen seurantaan tarvittavat tiedot ja tiedon...
 
Hanna Alastalo: Henkilöstömitoituksen seurannan kehitys ja aikataulu
Hanna Alastalo: Henkilöstömitoituksen seurannan kehitys ja aikatauluHanna Alastalo: Henkilöstömitoituksen seurannan kehitys ja aikataulu
Hanna Alastalo: Henkilöstömitoituksen seurannan kehitys ja aikataulu
 
Ajankohtaista koronarokotuksista 2.6.2022
Ajankohtaista koronarokotuksista 2.6.2022Ajankohtaista koronarokotuksista 2.6.2022
Ajankohtaista koronarokotuksista 2.6.2022
 
Tietoisku eri rokotteista
Tietoisku eri rokotteistaTietoisku eri rokotteista
Tietoisku eri rokotteista
 

Recently uploaded

Dimensions of Healthcare Quality
Dimensions of Healthcare QualityDimensions of Healthcare Quality
Dimensions of Healthcare Quality
Naeemshahzad51
 
GURGAON Call Girls ❤8901183002❤ #ℂALL# #gIRLS# In GURGAON ₹,2500 Cash Payment...
GURGAON Call Girls ❤8901183002❤ #ℂALL# #gIRLS# In GURGAON ₹,2500 Cash Payment...GURGAON Call Girls ❤8901183002❤ #ℂALL# #gIRLS# In GURGAON ₹,2500 Cash Payment...
GURGAON Call Girls ❤8901183002❤ #ℂALL# #gIRLS# In GURGAON ₹,2500 Cash Payment...
ranishasharma67
 
Performance Standards for Antimicrobial Susceptibility Testing
Performance Standards for Antimicrobial Susceptibility TestingPerformance Standards for Antimicrobial Susceptibility Testing
Performance Standards for Antimicrobial Susceptibility Testing
Nguyễn Thị Vân Anh
 
Preventing Pickleball Injuries & Treatment
Preventing Pickleball Injuries & TreatmentPreventing Pickleball Injuries & Treatment
Preventing Pickleball Injuries & Treatment
LAB Sports Therapy
 
HEAT WAVE presented by priya bhojwani..pptx
HEAT WAVE presented by priya bhojwani..pptxHEAT WAVE presented by priya bhojwani..pptx
HEAT WAVE presented by priya bhojwani..pptx
priyabhojwani1200
 
一比一原版纽约大学毕业证(NYU毕业证)成绩单留信认证
一比一原版纽约大学毕业证(NYU毕业证)成绩单留信认证一比一原版纽约大学毕业证(NYU毕业证)成绩单留信认证
一比一原版纽约大学毕业证(NYU毕业证)成绩单留信认证
o6ov5dqmf
 
Navigating Women's Health: Understanding Prenatal Care and Beyond
Navigating Women's Health: Understanding Prenatal Care and BeyondNavigating Women's Health: Understanding Prenatal Care and Beyond
Navigating Women's Health: Understanding Prenatal Care and Beyond
Aboud Health Group
 
The Docs PPG - 30.05.2024.pptx..........
The Docs PPG - 30.05.2024.pptx..........The Docs PPG - 30.05.2024.pptx..........
The Docs PPG - 30.05.2024.pptx..........
TheDocs
 
Overcome Your Phobias with Hypnotherapy.pptx
Overcome Your Phobias with Hypnotherapy.pptxOvercome Your Phobias with Hypnotherapy.pptx
Overcome Your Phobias with Hypnotherapy.pptx
renewlifehypnosis
 
Roti bank chennai PPT [Autosaved].pptx1
Roti bank  chennai PPT [Autosaved].pptx1Roti bank  chennai PPT [Autosaved].pptx1
Roti bank chennai PPT [Autosaved].pptx1
roti bank
 
Demystifying-Gene-Editing-The-Promise-and-Peril-of-CRISPR.pdf
Demystifying-Gene-Editing-The-Promise-and-Peril-of-CRISPR.pdfDemystifying-Gene-Editing-The-Promise-and-Peril-of-CRISPR.pdf
Demystifying-Gene-Editing-The-Promise-and-Peril-of-CRISPR.pdf
SasikiranMarri
 
Introduction to Forensic Pathology course
Introduction to Forensic Pathology courseIntroduction to Forensic Pathology course
Introduction to Forensic Pathology course
fprxsqvnz5
 
Deepfake Detection_Using Machine Learning .pptx
Deepfake Detection_Using Machine Learning .pptxDeepfake Detection_Using Machine Learning .pptx
Deepfake Detection_Using Machine Learning .pptx
mahalsuraj389
 
Contact Now 89011**83002 Dehradun ℂall Girls By Full Service ℂall Girl In De...
Contact Now  89011**83002 Dehradun ℂall Girls By Full Service ℂall Girl In De...Contact Now  89011**83002 Dehradun ℂall Girls By Full Service ℂall Girl In De...
Contact Now 89011**83002 Dehradun ℂall Girls By Full Service ℂall Girl In De...
aunty1x2
 
Navigating the Health Insurance Market_ Understanding Trends and Options.pdf
Navigating the Health Insurance Market_ Understanding Trends and Options.pdfNavigating the Health Insurance Market_ Understanding Trends and Options.pdf
Navigating the Health Insurance Market_ Understanding Trends and Options.pdf
Enterprise Wired
 
💘Ludhiana ℂall Girls 📞]][89011★83002][[ 📱 ❤ESCORTS service in Ludhiana💃💦Ludhi...
💘Ludhiana ℂall Girls 📞]][89011★83002][[ 📱 ❤ESCORTS service in Ludhiana💃💦Ludhi...💘Ludhiana ℂall Girls 📞]][89011★83002][[ 📱 ❤ESCORTS service in Ludhiana💃💦Ludhi...
💘Ludhiana ℂall Girls 📞]][89011★83002][[ 📱 ❤ESCORTS service in Ludhiana💃💦Ludhi...
ranishasharma67
 
Nursing Care of Client With Acute And Chronic Renal Failure.ppt
Nursing Care of Client With Acute And Chronic Renal Failure.pptNursing Care of Client With Acute And Chronic Renal Failure.ppt
Nursing Care of Client With Acute And Chronic Renal Failure.ppt
Rommel Luis III Israel
 
BOWEL ELIMINATION BY ANUSHRI SRIVASTAVA.pptx
BOWEL ELIMINATION BY ANUSHRI SRIVASTAVA.pptxBOWEL ELIMINATION BY ANUSHRI SRIVASTAVA.pptx
BOWEL ELIMINATION BY ANUSHRI SRIVASTAVA.pptx
AnushriSrivastav
 
Anatomy and Physiology Chapter-16_Digestive-System.pptx
Anatomy and Physiology Chapter-16_Digestive-System.pptxAnatomy and Physiology Chapter-16_Digestive-System.pptx
Anatomy and Physiology Chapter-16_Digestive-System.pptx
shanicedivinagracia2
 
Surgery-Mini-OSCE-All-Past-Years-Questions-Modified.
Surgery-Mini-OSCE-All-Past-Years-Questions-Modified.Surgery-Mini-OSCE-All-Past-Years-Questions-Modified.
Surgery-Mini-OSCE-All-Past-Years-Questions-Modified.
preciousstephanie75
 

Recently uploaded (20)

Dimensions of Healthcare Quality
Dimensions of Healthcare QualityDimensions of Healthcare Quality
Dimensions of Healthcare Quality
 
GURGAON Call Girls ❤8901183002❤ #ℂALL# #gIRLS# In GURGAON ₹,2500 Cash Payment...
GURGAON Call Girls ❤8901183002❤ #ℂALL# #gIRLS# In GURGAON ₹,2500 Cash Payment...GURGAON Call Girls ❤8901183002❤ #ℂALL# #gIRLS# In GURGAON ₹,2500 Cash Payment...
GURGAON Call Girls ❤8901183002❤ #ℂALL# #gIRLS# In GURGAON ₹,2500 Cash Payment...
 
Performance Standards for Antimicrobial Susceptibility Testing
Performance Standards for Antimicrobial Susceptibility TestingPerformance Standards for Antimicrobial Susceptibility Testing
Performance Standards for Antimicrobial Susceptibility Testing
 
Preventing Pickleball Injuries & Treatment
Preventing Pickleball Injuries & TreatmentPreventing Pickleball Injuries & Treatment
Preventing Pickleball Injuries & Treatment
 
HEAT WAVE presented by priya bhojwani..pptx
HEAT WAVE presented by priya bhojwani..pptxHEAT WAVE presented by priya bhojwani..pptx
HEAT WAVE presented by priya bhojwani..pptx
 
一比一原版纽约大学毕业证(NYU毕业证)成绩单留信认证
一比一原版纽约大学毕业证(NYU毕业证)成绩单留信认证一比一原版纽约大学毕业证(NYU毕业证)成绩单留信认证
一比一原版纽约大学毕业证(NYU毕业证)成绩单留信认证
 
Navigating Women's Health: Understanding Prenatal Care and Beyond
Navigating Women's Health: Understanding Prenatal Care and BeyondNavigating Women's Health: Understanding Prenatal Care and Beyond
Navigating Women's Health: Understanding Prenatal Care and Beyond
 
The Docs PPG - 30.05.2024.pptx..........
The Docs PPG - 30.05.2024.pptx..........The Docs PPG - 30.05.2024.pptx..........
The Docs PPG - 30.05.2024.pptx..........
 
Overcome Your Phobias with Hypnotherapy.pptx
Overcome Your Phobias with Hypnotherapy.pptxOvercome Your Phobias with Hypnotherapy.pptx
Overcome Your Phobias with Hypnotherapy.pptx
 
Roti bank chennai PPT [Autosaved].pptx1
Roti bank  chennai PPT [Autosaved].pptx1Roti bank  chennai PPT [Autosaved].pptx1
Roti bank chennai PPT [Autosaved].pptx1
 
Demystifying-Gene-Editing-The-Promise-and-Peril-of-CRISPR.pdf
Demystifying-Gene-Editing-The-Promise-and-Peril-of-CRISPR.pdfDemystifying-Gene-Editing-The-Promise-and-Peril-of-CRISPR.pdf
Demystifying-Gene-Editing-The-Promise-and-Peril-of-CRISPR.pdf
 
Introduction to Forensic Pathology course
Introduction to Forensic Pathology courseIntroduction to Forensic Pathology course
Introduction to Forensic Pathology course
 
Deepfake Detection_Using Machine Learning .pptx
Deepfake Detection_Using Machine Learning .pptxDeepfake Detection_Using Machine Learning .pptx
Deepfake Detection_Using Machine Learning .pptx
 
Contact Now 89011**83002 Dehradun ℂall Girls By Full Service ℂall Girl In De...
Contact Now  89011**83002 Dehradun ℂall Girls By Full Service ℂall Girl In De...Contact Now  89011**83002 Dehradun ℂall Girls By Full Service ℂall Girl In De...
Contact Now 89011**83002 Dehradun ℂall Girls By Full Service ℂall Girl In De...
 
Navigating the Health Insurance Market_ Understanding Trends and Options.pdf
Navigating the Health Insurance Market_ Understanding Trends and Options.pdfNavigating the Health Insurance Market_ Understanding Trends and Options.pdf
Navigating the Health Insurance Market_ Understanding Trends and Options.pdf
 
💘Ludhiana ℂall Girls 📞]][89011★83002][[ 📱 ❤ESCORTS service in Ludhiana💃💦Ludhi...
💘Ludhiana ℂall Girls 📞]][89011★83002][[ 📱 ❤ESCORTS service in Ludhiana💃💦Ludhi...💘Ludhiana ℂall Girls 📞]][89011★83002][[ 📱 ❤ESCORTS service in Ludhiana💃💦Ludhi...
💘Ludhiana ℂall Girls 📞]][89011★83002][[ 📱 ❤ESCORTS service in Ludhiana💃💦Ludhi...
 
Nursing Care of Client With Acute And Chronic Renal Failure.ppt
Nursing Care of Client With Acute And Chronic Renal Failure.pptNursing Care of Client With Acute And Chronic Renal Failure.ppt
Nursing Care of Client With Acute And Chronic Renal Failure.ppt
 
BOWEL ELIMINATION BY ANUSHRI SRIVASTAVA.pptx
BOWEL ELIMINATION BY ANUSHRI SRIVASTAVA.pptxBOWEL ELIMINATION BY ANUSHRI SRIVASTAVA.pptx
BOWEL ELIMINATION BY ANUSHRI SRIVASTAVA.pptx
 
Anatomy and Physiology Chapter-16_Digestive-System.pptx
Anatomy and Physiology Chapter-16_Digestive-System.pptxAnatomy and Physiology Chapter-16_Digestive-System.pptx
Anatomy and Physiology Chapter-16_Digestive-System.pptx
 
Surgery-Mini-OSCE-All-Past-Years-Questions-Modified.
Surgery-Mini-OSCE-All-Past-Years-Questions-Modified.Surgery-Mini-OSCE-All-Past-Years-Questions-Modified.
Surgery-Mini-OSCE-All-Past-Years-Questions-Modified.
 

Eric Delmelle: Disease Mapping

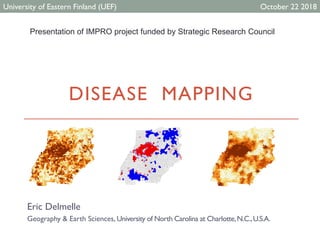
  • 1. DISEASE MAPPING Eric Delmelle Geography & Earth Sciences, University of North Carolina at Charlotte,N.C.,U.S.A. University of Eastern Finland (UEF) October 22 2018 Presentation of IMPRO project funded by Strategic Research Council
  • 2. Introduction • Different ways to map health related data • Scattermap • Areal data (choropleth mapping) • Cases aggregated to geographic units • Generally mapped as rates, using population at risk as a denominator • In the case of breast cancer deaths, count of cancer deaths divided by females (can be more restrictive for the age segment). Disease mapping Introduction
  • 3. Rationale • GIScientists and epidemiologists are interested to map the variation of these rates across a specific region. Disease mapping • The map indicates that individuals dying from tracheal, bronchus and lung cancer are mostly concentrated in the Appalachian regions (very rural, with deprived access to care). • Very low rates Southern Idaho, and Utah, but also parts of Arizona, New Mexico and Colorado. Note that Southern Idaho and Utah are mostly Mormon, where smoking is certainly not encouraged. Introduction
  • 4. Rationale Another example for the Eastern USA, just focusing on average annual rates for lung and tracheal cancer rates among males from 2011 to 2015, and using the 65+ male census population as the denominator Disease mapping Introduction
  • 5. Rationale Disease mapping • Clearly we saw some patterns, very high in the Appalachian, but lower along the coast. • We also see thatVirginia has lower rates. • There could be some reasons for this, such as prevention measures that can vary by state. • Although smoking is the main factor contributing to lung cancer, living in a heavy coal-mining area such as Kentucky is found to be an additional risk factor as residents in these areas are exposed to pollution from mining activities. Introduction
  • 6. Estimating spatial patterns/clusters Disease mapping • Evaluate whether regions of high rate have a tendency to cluster, using techniques such as Moran’s I. • Moran’s I will evaluate whether neighboring census units (in our case, counties) tend to exhibit similar (high, or low) values. • Adjacency matrix W; that is for each geographic unit, determine its neighbors, for instance through an adjacency matrix (0 or 1 – resulting in wij), or the number of closest neighbors (Rook versus Queen).This can easily be done within a commercial GIS or Geoda. Patterns and clustering
  • 7. Estimating spatial patterns/clusters Disease mapping • Once this is complete, we can evaluate the Moran’s I. 𝐼 = 𝑁 𝑊 𝑤𝑖𝑗(𝑂𝑖 − 𝑂)(𝑂𝑗 − 𝑂𝑗𝑖 𝑂𝑗 − 𝑂 2 𝑖 With N the number of geographic units and O the rate.The term wij denotes the adjacency value between i and j and W the sum. Patterns and clustering
  • 8. Estimating local spatial patterns/clusters Disease mapping • Unfortunately, the Moran’s I statistic does not tell us where clusters may be located. Anselin developed a local version of the test, taking on the same values. • The results can be particularly useful for health purposes. Patterns and clustering
  • 9. Estimating local spatial patterns/clusters Disease mapping • The local Moran’s I also returns a map of its significance Patterns and clustering
  • 10. Issues with rates Disease mapping • Oftentimes, assumption of normality. But not so evident when you use proportion or count. – rather use Poisson or binomial distribution…the variance may be related to the mean value. Rates Crude rate 𝑟𝑖 = 𝑂𝑖 𝑃𝑖 with 𝑂𝑖 observed count at i and 𝑃𝑖 the population at risk at i.  The use of crude rates and ratios to estimate rare disease risks in small areas is often problematic since these measures are typically subject to large chance variation.  Disease maps that are based directly on these crude estimates are difficult to interpret and often misleading  unreliable rates that occur for sparsely populated areas and/or rare cancers
  • 11. Issues with rates Disease mapping Rates Standard Mortality Rate (SMR) – also called excess or relative risk Then, the expected number of events in i 𝐸𝑖 (also noted 𝜇𝑖) is given as: Idea is to compare observed mortality rate to a national (or regional) standard. We will compare the number of events to the expected count of events. 𝜋 = 𝑂𝑖𝑖∈𝐼 𝑃𝑖𝑖∈𝐼 Reference rate 𝐸𝑖 = 𝜋 ∗ 𝑃𝑖 𝑆𝑀𝑅𝑖 = 𝑂𝑖 𝐸𝑖 SMR
  • 12. Issues with rates Disease mapping Rates Population….
  • 13. Issues with rates Disease mapping Rates • A very high relative risk (or SMR) could also happen if you have one case, and expect 0.1 (near 1,000). Interestingly enough, this would lead to the same SMR: (𝑂𝑖=100, 𝐸𝑖=50) and (𝑂𝑖=3, 𝐸𝑖=1.5) – same SMR. • But if I add just one case to the second scenario, I would end up with wild SMR. This suggests that the reliability of the estimates can vary widely and we need to take the reliability into account. • Probability mapping maps the probability of getting a count more ‘extreme’ than the one we actually observed – assumption is that the count in each area is Poisson distribution with mean value 𝜇𝑖
  • 14. Issues with rates Disease mapping Rates • Extreme ratios associated with areas with the smallest populations. • Solutions. Disease mapping methods, usually using Bayesian inference, seek to borrow strength across areas to produce stable risk estimates. Essentially, we try to improve the reliability of observed rates by using (or “borrowing”) information from neighboring entities (Waller and Gotway 2004). • The model is fit using data, and estimates of relative risks based on posterior distributions for the random effects are derived. • The resulting estimates for disease risks in small areas are based on pooling information from related areas. • Maps based on these estimates are often more interpretable and informative (Lawson et al., 1999; Elliott et al., 2 000).
  • 15. Empirical Bayesian Estimates Disease mapping EBS • Let’s suppose that we are trying to estimate the observed rate, say 𝜃𝑖 Then, we can re-write this as: • With 𝛾𝑖 and 𝜑𝑖 the mean and the variance of the prior probability distribution, respectively.The first part of Equation puts emphasis on the observed rate, while the second emphasizes prior belief. 𝜃𝑖 = 𝑤𝑖 ∗ 𝑟𝑖 + (1 − 𝑤𝑖) ∗ 𝛾𝑖
  • 16. Empirical Bayesian Estimates Disease mapping EBS • The term 𝑤𝑖 is defined as follows: • So then how to get 𝛾𝑖 and 𝜑𝑖? A first estimate would be that 𝛾𝑖 = 𝛾 and 𝜑𝑖 = 𝜑 for all areas.This means that the prior is gamma distributed with two parameters 𝑣 (scale) and 𝛼 (shape).We can deduct that 𝛾 = 𝑣 𝛼 and 𝜑 = 𝑣 𝛼2. 𝑤𝑖 = 𝜑𝑖 𝜑𝑖 + 𝛾𝑖 𝑛𝑖
  • 18. Local Empirical Bayesian Estimates Disease mapping EBS Strength is borrowed from to correct for variance instability is localized as opposed to global (i.e., based on all observations)
  • 19. Local Empirical Bayesian Estimates Disease mapping EBS Strength is borrowed from to correct for variance instability is localized as opposed to global (i.e., based on all observations)
  • 20. Local Empirical Bayesian Estimates Disease mapping EBS Strength is borrowed from to correct for variance instability is localized as opposed to global (i.e., based on all observations)
  • 21. Questions Department of Geography and Earth Sciences University of North Carolina at Charlotte Charlotte, NC 28223 Tel: (704) 687-5991 Email: Eric.Delmelle@uncc.edu Disease mapping