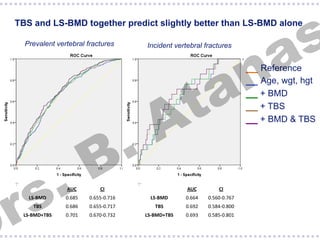
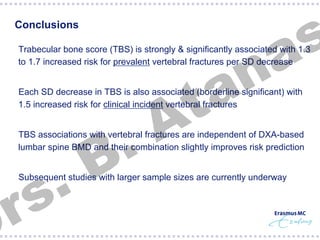
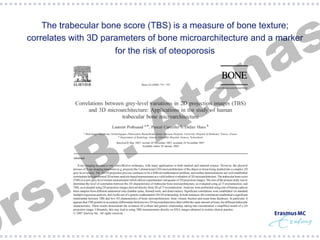
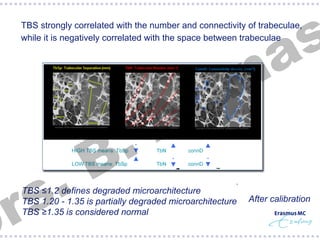
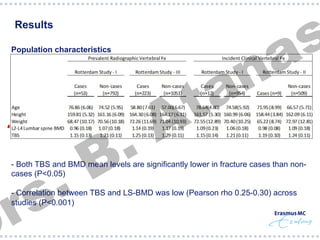
This study examined the relationship between trabecular bone score (TBS) and prevalent and incident vertebral fractures in elderly women. TBS was significantly associated with an increased risk of both prevalent and incident vertebral fractures, independent of bone mineral density measured by dual-energy X-ray absorptiometry. Combining TBS and BMD measurements slightly improved the prediction of fracture risk compared to BMD alone. The study suggests TBS provides additional information on bone quality and fracture risk beyond BMD.
![s
a
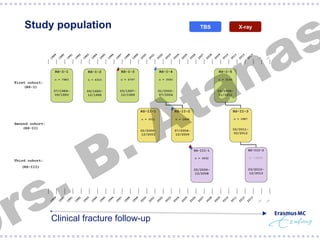
§ Lower TBS scores were associated with increased risk
for prevalent and incident clinical vertebral fractures
n
a
t
A
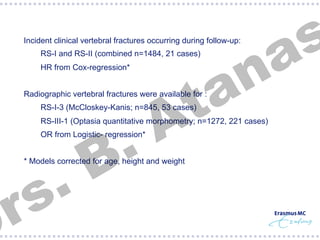
§ Radiographic prevalent vertebral fractures were associated with increased risk
per SD decrease in TBS score:
§ RS-I
OR 1.71 95%CI [1.29-2.27]; P=0.0002
§ RS-III
OR 1.27 95%CI [1.08-1.48]; P=0.004
.
B
§ Combined analysis of incident clinical vertebral fractures was suggestive of
increased risk per SD decrease in TBS score:
.
s
r
§ RS-I+RS-II
HR 1.48 95%CI [0.96-2.29]; P=0.08
§ Additional adjustment for lumbar spine BMD did NOT affect the risk estimates nor
the interaction TBS x BMD](https://image.slidesharecdn.com/erasmus-140306045706-phpapp02/85/Seminar-30-11-2013-Prediction-of-vertebral-fracture-12-320.jpg)