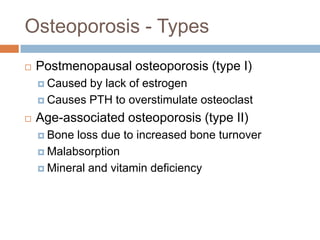
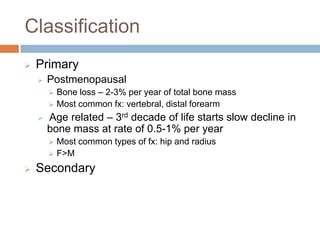
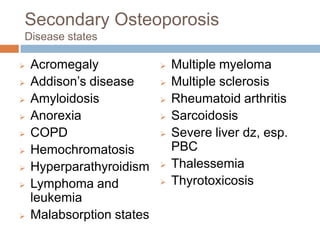
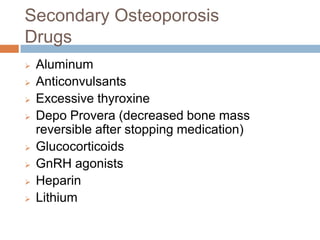
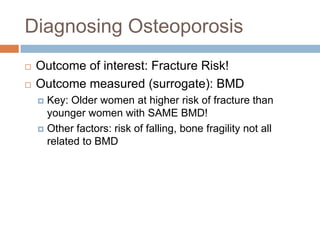
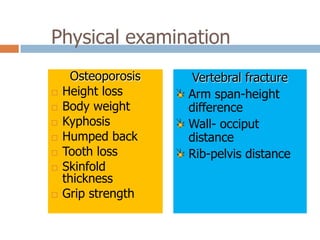
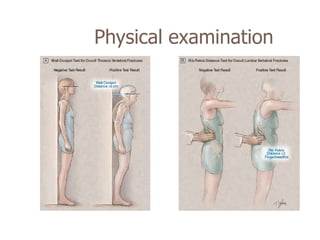
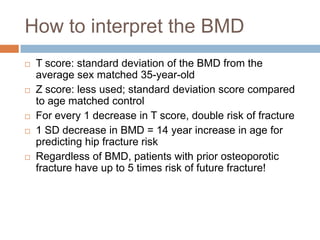
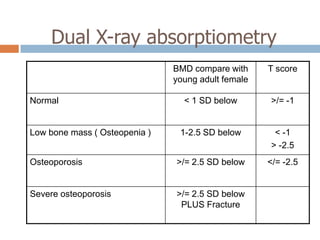
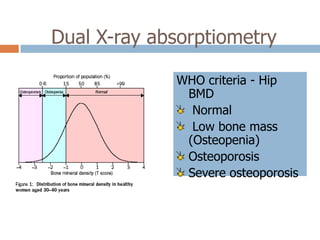
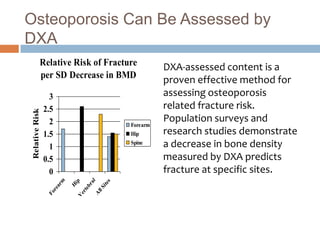
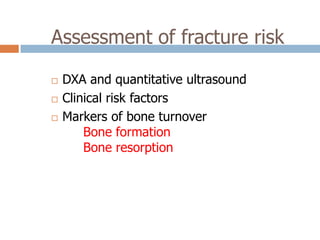
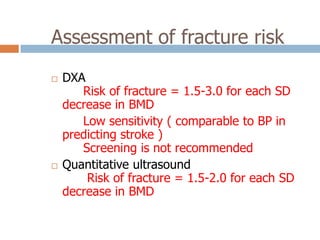
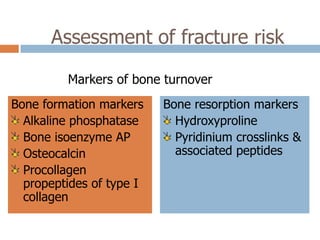
This document discusses the diagnosis and assessment of osteoporosis. It defines osteoporosis as a systemic skeletal disease characterized by low bone mass and deterioration of bone tissue, leading to bone fragility and susceptibility to fractures. It describes who is at risk and the different types of osteoporosis. Physical exams and various imaging techniques can be used to diagnose osteoporosis such as dual-energy x-ray absorptiometry (DXA) scans, quantitative ultrasound, CT scans, and plain radiography. Factors like BMD T-scores, clinical risk factors, and markers of bone turnover help assess fracture risk in patients.
2. Definition
A systemic skeletal
disease characterized by
low bone mass and micro
architectural deterioration
of bone tissue leading to
bone fragility and
susceptibility to fracture
3. Who Gets Osteoporosis?
Immobilization
Hypogonadal states
Endocrine disorders
Malnutrition, parenteral nutrition and malabsorption
rheumatologic disorders
Renal insufficiency
Hematologic disorders
Several inherited disorders
4. Osteoporosis
Mechanisms causing osteoporosis
Imbalance between rate of resorption and
formation
Failure to complete stages of remodeling
Types of osteoporosis
Type I
Type II
Secondary
5. Osteoporosis - Types
Postmenopausal osteoporosis (type I)
Caused by lack of estrogen
Causes PTH to overstimulate osteoclast
Age-associated osteoporosis (type II)
Bone loss due to increased bone turnover
Malabsorption
Mineral and vitamin deficiency
6. Classification
Primary
Postmenopausal
Bone loss – 2-3% per year of total bone mass
Most common fx: vertebral, distal forearm
Age related – 3rd decade of life starts slow decline in
bone mass at rate of 0.5-1% per year
Most common types of fx: hip and radius
F>M
Secondary
8. Secondary Osteoporosis
Drugs
Aluminum
Anticonvulsants
Excessive thyroxine
Depo Provera (decreased bone mass
reversible after stopping medication)
Glucocorticoids
GnRH agonists
Heparin
Lithium
9. Diagnosing Osteoporosis
Outcome of interest: Fracture Risk!
Outcome measured (surrogate): BMD
Key: Older women at higher risk of fracture than
younger women with SAME BMD!
Other factors: risk of falling, bone fragility not all
related to BMD
10. Prevalence of osteoporosis
Osteopenia Osteoporosis
Female 37-50% 13-18%
Age > 50 year
Male 28-47% 3-6%
Age > 50 year
13. Diagnosis of Osteoporosis
Physical examination
Measurement of bone mineral content
• Dual X-ray absorptiometry (DXA)
• Ultrasonic measurement of bone
• CT scan
• Radiography
14. Physical examination
Osteoporosis Vertebral fracture
Height loss Arm span-height
Body weight difference
Kyphosis Wall- occiput
Humped back distance
Tooth loss Rib-pelvis distance
Skinfold
thickness
Grip strength
16. Physical examination
No single maneuver is sufficient to rule in or
rule out osteoporosis or vertebral fracture
without further testing
17. Diagnosing Osteoporosis
Laboratory Data
Limited value in diagnosis
Markers of bone turnover (telopeptide) more useful in
monitoring effects of treatment than in diagnosis
Helpful to exclude secondary causes
Hyperthyroidism
Hyperparathyroidism
Estrogen or testosterone deficiency
Malignancy
Multiple myeloma
Calcium/Vitamin D deficiency
18. Work-up
Screen for secondary causes
Serum calcium, phosphorus, alk phos
PTH if calcium is high (hyperparathyroidism)
25-hydroxyvitamin D if low ca,
low phos and high alk. phos (osteomalacia)
Thyroid function tests (thyrotoxicosis)
SPEP, UPEP (multiple myeloma)
24-hour urinary calcium (hyper or hypo calciuria)
Serum testosterone (hypogonadism)
19. Methods to evaluate for osteoporosis
Quantitative Ultrasonography
Quantitative computed tomography
Dual Energy X-ray Absorptiometry (DEXA)
?”gold standard”
Measurements vary by site
Heel and forearm: easy but less reliable (outcome of
interest is fracture of vertebra or hip!)
Hip site: best correlation with future risk hip fracture
Vertebral spine: predict vertebral fractures; risk of
falsely HIGH scores if underlying OA/osteophytes
20. Dual X-ray absorptiometry
2-dimensional study
BMD = Amount of mineral
Area
Accuracy at hip > 90%
Low radiation exposure
Error in
Osteomalacia
Osteoarthritis
Previous fracture
21. How to interpret the BMD
T score: standard deviation of the BMD from the
average sex matched 35-year-old
Z score: less used; standard deviation score compared
to age matched control
For every 1 decrease in T score, double risk of fracture
1 SD decrease in BMD = 14 year increase in age for
predicting hip fracture risk
Regardless of BMD, patients with prior osteoporotic
fracture have up to 5 times risk of future fracture!
22. Dual X-ray absorptiometry
BMD compare with T score
young adult female
Normal < 1 SD below >/= -1
Low bone mass ( Osteopenia ) 1-2.5 SD below < -1
> -2.5
Osteoporosis >/= 2.5 SD below </= -2.5
Severe osteoporosis >/= 2.5 SD below
PLUS Fracture
23. Dual X-ray absorptiometry
WHO criteria - Hip
BMD
Normal
Low bone mass
(Osteopenia)
Osteoporosis
Severe osteoporosis
24. Osteoporosis Can Be Assessed by
DXA
Relative Risk of Fracture DXA-assessed content is a
per SD Decrease in BMD
proven effective method for
3 assessing osteoporosis
2.5 related fracture risk.
Relative Risk
2 Population surveys and
Forearm
1.5 Hip research studies demonstrate
1
Spine a decrease in bone density
0.5 measured by DXA predicts
0 fracture at specific sites.
m
l
p
s
ra
ite
Hi
ar
b
lS
re
rte
Fo
Al
Ve
25. Ultrasonic measurement
Broad-band ultrasound
attenuation
No radiation exposure
Cannot be used for diagnosis
Preferred use in assessment
of fracture risk
26. The calcaneus is the most common skeletal site
for quantitative ultrasound assessment
because
-It has a high percentage of trabecular bone
that is replaced more often than cortical
bone, providing early evidence of metabolic
change.
-Also, the calcaneus is fairly flat and
parallel, reducing repositioning errors.
27. The McCue CUBA: Ultrasonometry
Technology That Can Assess Osteoporosis
28. Heel BUA is Significantly Lower in
Subjects With Future Hip Fracture.
60
BUA (dB/sq MHz) 50
40
30
20
10
0
Fracture No Fracture
Subjects who developed hip fracture showed significantly (p<0.001) lower
heel BUA results.
29. CT scan
True volumetric study
Quantitative Computed
Tomography (QCT) utilizes CT
technology to detect low bone
mass and monitors the effects of
therapy in patients undergoing
treatment.
It is a fast, non-invasive exam
that detects low bone mass
earlier and more accurately than
other bone density exams
31. The trabecular BMD is indicated as the most
important parameter, and interpreted using the
Felsenberg classification, based on the
following cut-off values:
Normal BMD > 120 mg/cc
Osteopenia < 120 mg/cc
Osteoporosis < 80 mg/cc
Very high fracture risk < 50 mg/cc
32. Advantages over DXA:
Ability to separate cortical and trabecular bone
Provides true volumetric density in units of mg/cc
No errors due to spinal degenerative changes or
aortic calcification
33. Clinicians and researchers favor DXA because
-scanners are readily available and relatively
inexpensive.
-The radiation dose is negligible
-The T-score scale, defined by the WHO specifically for
DXA, provides a standardized classification.
34. Plain radiography
Low sensitivity
High availability
Subclinical vertebral fracture is a
strong risk factor for subsequent
fractures at new vertebral site and
other sites
35. The main radiographic features of generalized
osteoporosis are cortical thinning and increased
radiolucency
36. Singh Index
The Singh index describes the trabecular
patterns in the bone at the top of the thighbone
(femur).
X-rays are graded 1 through 6 according to
the disappearance of the normal trabecular
pattern.
Studies have shown a link between a Singh
index of less than 3 and fractures of the hip,
wrist, and spine.
38. Assessment of fracture risk
DXA and quantitative ultrasound
Clinical risk factors
Markers of bone turnover
Bone formation
Bone resorption
39. Assessment of fracture risk
DXA
Risk of fracture = 1.5-3.0 for each SD
decrease in BMD
Low sensitivity ( comparable to BP in
predicting stroke )
Screening is not recommended
Quantitative ultrasound
Risk of fracture = 1.5-2.0 for each SD
decrease in BMD
40. Assessment of fracture risk
Markers of bone turnover
Bone formation markers Bone resorption markers
Alkaline phosphatase Hydroxyproline
Bone isoenzyme AP Pyridinium crosslinks &
Osteocalcin associated peptides
Procollagen
propeptides of type I
collagen
41. Assessment of fracture risk
Markers of bone turnover
Associated with osteoporotic fracture
independent of bone density
2-Fold increase in fracture risk
? Combined approach with BMD to
increased sensitivity
42. Assessment of fracture risk
Clinical risk factors for fracture
Low bone mass
History or falls
Impaired cognition ( plus medication adverse effect )
Low physical function
Presence of environmental hazards
Long hip axis length
Chronic glucocorticoid use
Existing fracture
Chronic use of seizure medications
Renal, hepatic, thyroid, parathyroid, malabsorptive disorder, vitamin D
deficiency, MM and local neoplasia to be ruled out
National Osteoporosis Foundation 1998
43. Assessment of fracture risk
Predictors of low bone mass
Female
Advanced age
Gonadal hormone deficiency ( estrogen or testosterone )
White race
Low body weight & BMI
Family history of osteoporosis
Low calcium intake
Smoking / excessive alcohol intake
Low level of physical acitivity
Chronic glucocorticoid use
History of fracture
National Osteoporosis Foundation 1998
44. When to Measure BMD in
Postmenopausal Women
All women 65 years and older
Postmenopausal women <65 years of age:
Ifresult might influence decisions about
intervention
One or more risk factors
History of fracture
45. When Measurement of BMD Is Not
Appropriate
Healthy premenopausal women
Healthy children and adolescents
Women initiating ET/HT for menopausal
symptom relief (other osteoporosis therapies
should not be initiated without BMD
measurement)