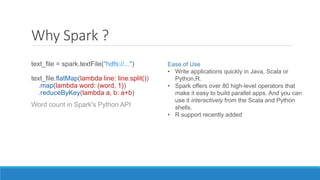
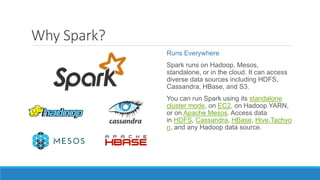
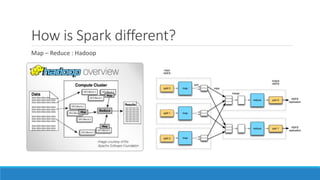
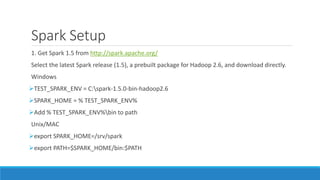
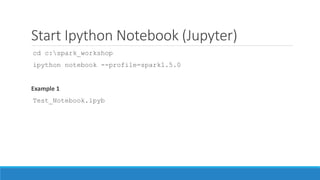
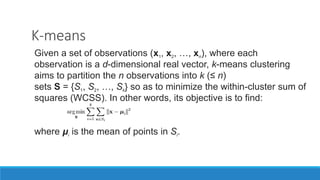
Energy Analytics
with Spark
SRI KRISHNAMURTHY
QUANTUNIVERSITY LLC.
QUANTUNIVERSITY@GMAIL.COM
2015 Copyright QuantUniversity LLC.
- ADVISORY SERVICES
- CUSTOM TRAINING PROGRAMS
- PLATFORM FOR LARGE SCALE SIMULATIONS AND ANALYTICS
- ARCHITECTURE REVIEW, TRAINING AND AUDITS
SOON ANALYTICS CERTIFICATE PROGRAM!
• Founder of QuantUniversity LLC. and
www.analyticscertificate.com
• Advisory and Consultancy for Analytics
• Prior Experience at MathWorks, Citigroup and
Endeca and 25+ financial services customers
• Regular Columnist for the Wilmott Magazine
• Author of forthcoming book
“Financial Modeling: A case study approach”
published by Wiley
• Charted Financial Analyst and Certified Analytics
Professional
• Teaches Analytics in the Babson College MBA
program and at Northeastern University
Sri Krishnamurthy
Founder and CEO
SPEAKERBIO
Agenda
1. Energy Analytics 101
2. A quick introduction to Apache Spark
3. Fundamentals and setup
4. Energy Analytics use-cases
Files for today’s workshop
http://bit.ly/1F6E91O
What’s missing in this picture ?
Analytics of the 1990s
Actionable analytics enables engagement!
1. What if energy companies can understand
customer’s usage better?
2. What if energy companies can understand
what drives customer energy usage ?
3. What if energy companies engage with
customers by providing actionable
analytics so that customers can monitor
and plan for wide swings in energy usage?
Customer demand isn’t uniform
What changed from Jan 2nd to Jan 3rd ?
Does this customer heavily use energy from 11-9pm ?
Problem
1. Lots of data
2. Utilities can have more than 100K customers.
3. Truly a big data problem with multiple dimensions and dirty data
Use case 1 : Customer Segmentation
Segmenting customers
- How can we segment customers into groups ?
- Typically Clustering algorithms like K-means are used
What is K-means ?
http://shabal.in/visuals/kmeans/2.html
Use-case 2 – Load Forecasting
Given parameters like Temperature, day of week, month, time of day, can we predict load ?
Typically methods like Regression are used
Load = Function of (Temperature, day of week, month, time of day etc)
What is Spark ?
Apache Spark™ is a fast and general engine for large-scale data processing.
Came out of U.C. Berkeley’s AMP Lab
Lightning-fast cluster computing
Why Spark ?
Speed
Run programs up to 100x faster than Hadoop MapReduce
in memory, or 10x faster on disk.
Spark has an advanced DAG execution engine that
supports cyclic data flow and in-memory computing.
Why Spark ?
text_file = spark.textFile("hdfs://...")
text_file.flatMap(lambda line: line.split())
.map(lambda word: (word, 1))
.reduceByKey(lambda a, b: a+b)
Word count in Spark's Python API
Ease of Use
• Write applications quickly in Java, Scala or
Python,R.
• Spark offers over 80 high-level operators that
make it easy to build parallel apps. And you can
use it interactively from the Scala and Python
shells.
• R support recently added
Why Spark ?
Generality
Combine SQL, streaming, and complex
analytics.
Spark powers a stack of high-level tools
including:
1. Spark Streaming: processing real-time data
streams
2. Spark SQL and DataFrames: support for
structured data and relational queries
3. MLlib: built-in machine learning library
4. GraphX: Spark’s new API for graph
processing
Why Spark?
Runs Everywhere
Spark runs on Hadoop, Mesos,
standalone, or in the cloud. It can access
diverse data sources including HDFS,
Cassandra, HBase, and S3.
You can run Spark using its standalone
cluster mode, on EC2, on Hadoop YARN,
or on Apache Mesos. Access data
in HDFS, Cassandra, HBase, Hive,Tachyo
n, and any Hadoop data source.
Key Features of Spark
• handles batch, interactive, and real-time within a single
framework
• native integration with Java, Python, Scala, R
• programming at a higher level of abstraction
• more general: map/reduce is just one set of supported
constructs
Secret Sauce : RDD, Transformation,
Action
How does it work?
Resilient Distributed Datasets (RDD) are the primary abstraction in Spark – a
fault-tolerant collection of elements that can be operated on in parallel
Transformations create a new dataset from an existing one. All transformations
in Spark are lazy: they do not compute their results right away – instead they
remember the transformations applied to some base dataset
Actions return a value to the driver program after running a computation on the
dataset
How is Spark different?
Map – Reduce : Hadoop
Problems with this MR model
Difficult to code
Quick Demo
Test_Notebook.ipyb
Spark Setup
1. Get Spark 1.5 from http://spark.apache.org/
Select the latest Spark release (1.5), a prebuilt package for Hadoop 2.6, and download directly.
Windows
TEST_SPARK_ENV = C:spark-1.5.0-bin-hadoop2.6
SPARK_HOME = % TEST_SPARK_ENV%
Add % TEST_SPARK_ENV%bin to path
Unix/MAC
export SPARK_HOME=/srv/spark
export PATH=$SPARK_HOME/bin:$PATH
Set up Ipython Notebook
Install the latest Anaconda install from https://store.continuum.io/cshop/anaconda/
ipython profile create spark1.5.0
Go to:
C:Userssri-dell.ipythonprofile_spark1.5.0startup and create a file:
00-spark1.5.0-setup.py
Add this
Start Ipython Notebook (Jupyter)
cd c:spark_workshop
ipython notebook --profile=spark1.5.0
Example 1
Test_Notebook.ipyb
Appendix
In Windows, you may see this:
See https://issues.apache.org/jira/browse/SPARK-2356
To resolve this:
Get winutils.exe from http://public-repo-1.hortonworks.com/hdp-win-alpha/winutils.exe and
put it in SPARK_HOME
Add the following environment variables
set HADOOP_HOME=%SPARK_HOME%
set HADOOP_CONF_DIR=%SPARK_HOME%
To reduce logging messages
Copy
%SPARK_HOME%/conf/log4j.properties.template
to
%SPARK_HOME%/conf/log4j.properties
Replace INFO to WARN
Key Features used in Spark
1. Dataframes
◦ http://spark.apache.org/docs/latest/sql-programming-guide.html
2. Pyspark.ml API
◦ http://spark.apache.org/docs/latest/api/python/index.html
Use case 1 : Customer Segmentation
Segmenting customers
- How can we segment customers into groups ?
- Typically Clustering algorithms like K-means are used
What is K-means ?
http://shabal.in/visuals/kmeans/2.html
K-means
Given a set of observations (x1, x2, …, xn), where each
observation is a d-dimensional real vector, k-means clustering
aims to partition the n observations into k (≤ n)
sets S = {S1, S2, …, Sk} so as to minimize the within-cluster sum of
squares (WCSS). In other words, its objective is to find:
where μi is the mean of points in Si.
Data Wrangling
and Exploration
Clustering
Plotting for
Exploration
Clustering approach
Demo
Data
http://en.openei.org/datasets/dataset?tags=Residential
http://en.openei.org/datasets/dataset/doe-buildings-performance-database-sample-
residential-data
Goal : To segment customers to 3-5 segments based on similarity
K-means - Customer segmentation.ipynb
Use-case 2 – Load Forecasting
Given parameters like Temperature, day of week, month, time of day, can we predict load ?
Typically methods like Regression are used
Load = Function of (Temperature, day of week, month, time of day etc)
Ordinary Least Squares Regression
Machine Learning Model
Piecewise Linear Model
50 different factors to use
Like temperature, holidays
Weekday/weekend etc
Data Wrangling
and Exploration
Machine Learning
for forecasting
Plotting for
Exploration
Linear Regression
248 unique customers
30 million records
5 minute intervals
35 different subindustries
US, Canada and Australia
Data Sources
Temperature data for more than 100 weather stations corresponding
To the sites
Enernoc dataset
248 unique customers
30 million records
5 minute intervals
35 different subindustries
US, Canada and Australia
Demo
Data
Forecast.csv
Goal : To build a Linear Regression model to enable load forecasts given day,hour,month and
temperature
Load Forecasting-Dataframe.ipyb
Other Energy sources
Utilities
http://www.sdge.com/documents/green-button-60-min-meter-interval-sample-data-csv
http://www.sdge.com/customer-service/green-button/additional-information-developers-and-
third-parties
References
1. Spark documentation and http://spark.apache.org/
2. Spark presentations primarily by Spark founders and the Databricks team
Thank you!
Sri Krishnamurthy, CFA, CAP
Founder and CEO
QuantUniversity LLC.
srikrishnamurthy
www.QuantUniversity.com
www.analyticscertificate.com
Contact
Information, data and drawings embodied in this presentation are strictly a property of QuantUniversity LLC. and shall not be
distributed or used in any other publication without the prior written consent of QuantUniversity LLC.

Energy analytics with Apache Spark workshop

  • 1.
    Energy Analytics with Spark SRIKRISHNAMURTHY QUANTUNIVERSITY LLC. QUANTUNIVERSITY@GMAIL.COM 2015 Copyright QuantUniversity LLC.
  • 2.
    - ADVISORY SERVICES -CUSTOM TRAINING PROGRAMS - PLATFORM FOR LARGE SCALE SIMULATIONS AND ANALYTICS - ARCHITECTURE REVIEW, TRAINING AND AUDITS SOON ANALYTICS CERTIFICATE PROGRAM!
  • 3.
    • Founder ofQuantUniversity LLC. and www.analyticscertificate.com • Advisory and Consultancy for Analytics • Prior Experience at MathWorks, Citigroup and Endeca and 25+ financial services customers • Regular Columnist for the Wilmott Magazine • Author of forthcoming book “Financial Modeling: A case study approach” published by Wiley • Charted Financial Analyst and Certified Analytics Professional • Teaches Analytics in the Babson College MBA program and at Northeastern University Sri Krishnamurthy Founder and CEO SPEAKERBIO
  • 4.
    Agenda 1. Energy Analytics101 2. A quick introduction to Apache Spark 3. Fundamentals and setup 4. Energy Analytics use-cases Files for today’s workshop http://bit.ly/1F6E91O
  • 5.
    What’s missing inthis picture ? Analytics of the 1990s
  • 6.
    Actionable analytics enablesengagement! 1. What if energy companies can understand customer’s usage better? 2. What if energy companies can understand what drives customer energy usage ? 3. What if energy companies engage with customers by providing actionable analytics so that customers can monitor and plan for wide swings in energy usage?
  • 7.
    Customer demand isn’tuniform What changed from Jan 2nd to Jan 3rd ? Does this customer heavily use energy from 11-9pm ?
  • 8.
    Problem 1. Lots ofdata 2. Utilities can have more than 100K customers. 3. Truly a big data problem with multiple dimensions and dirty data
  • 9.
    Use case 1: Customer Segmentation Segmenting customers - How can we segment customers into groups ? - Typically Clustering algorithms like K-means are used What is K-means ? http://shabal.in/visuals/kmeans/2.html
  • 10.
    Use-case 2 –Load Forecasting Given parameters like Temperature, day of week, month, time of day, can we predict load ? Typically methods like Regression are used Load = Function of (Temperature, day of week, month, time of day etc)
  • 11.
    What is Spark? Apache Spark™ is a fast and general engine for large-scale data processing. Came out of U.C. Berkeley’s AMP Lab Lightning-fast cluster computing
  • 12.
    Why Spark ? Speed Runprograms up to 100x faster than Hadoop MapReduce in memory, or 10x faster on disk. Spark has an advanced DAG execution engine that supports cyclic data flow and in-memory computing.
  • 13.
    Why Spark ? text_file= spark.textFile("hdfs://...") text_file.flatMap(lambda line: line.split()) .map(lambda word: (word, 1)) .reduceByKey(lambda a, b: a+b) Word count in Spark's Python API Ease of Use • Write applications quickly in Java, Scala or Python,R. • Spark offers over 80 high-level operators that make it easy to build parallel apps. And you can use it interactively from the Scala and Python shells. • R support recently added
  • 14.
    Why Spark ? Generality CombineSQL, streaming, and complex analytics. Spark powers a stack of high-level tools including: 1. Spark Streaming: processing real-time data streams 2. Spark SQL and DataFrames: support for structured data and relational queries 3. MLlib: built-in machine learning library 4. GraphX: Spark’s new API for graph processing
  • 15.
    Why Spark? Runs Everywhere Sparkruns on Hadoop, Mesos, standalone, or in the cloud. It can access diverse data sources including HDFS, Cassandra, HBase, and S3. You can run Spark using its standalone cluster mode, on EC2, on Hadoop YARN, or on Apache Mesos. Access data in HDFS, Cassandra, HBase, Hive,Tachyo n, and any Hadoop data source.
  • 16.
    Key Features ofSpark • handles batch, interactive, and real-time within a single framework • native integration with Java, Python, Scala, R • programming at a higher level of abstraction • more general: map/reduce is just one set of supported constructs
  • 17.
    Secret Sauce :RDD, Transformation, Action
  • 18.
    How does itwork? Resilient Distributed Datasets (RDD) are the primary abstraction in Spark – a fault-tolerant collection of elements that can be operated on in parallel Transformations create a new dataset from an existing one. All transformations in Spark are lazy: they do not compute their results right away – instead they remember the transformations applied to some base dataset Actions return a value to the driver program after running a computation on the dataset
  • 19.
    How is Sparkdifferent? Map – Reduce : Hadoop
  • 20.
    Problems with thisMR model Difficult to code
  • 21.
  • 22.
    Spark Setup 1. GetSpark 1.5 from http://spark.apache.org/ Select the latest Spark release (1.5), a prebuilt package for Hadoop 2.6, and download directly. Windows TEST_SPARK_ENV = C:spark-1.5.0-bin-hadoop2.6 SPARK_HOME = % TEST_SPARK_ENV% Add % TEST_SPARK_ENV%bin to path Unix/MAC export SPARK_HOME=/srv/spark export PATH=$SPARK_HOME/bin:$PATH
  • 23.
    Set up IpythonNotebook Install the latest Anaconda install from https://store.continuum.io/cshop/anaconda/ ipython profile create spark1.5.0 Go to: C:Userssri-dell.ipythonprofile_spark1.5.0startup and create a file: 00-spark1.5.0-setup.py
  • 24.
  • 25.
    Start Ipython Notebook(Jupyter) cd c:spark_workshop ipython notebook --profile=spark1.5.0 Example 1 Test_Notebook.ipyb
  • 26.
    Appendix In Windows, youmay see this: See https://issues.apache.org/jira/browse/SPARK-2356
  • 27.
    To resolve this: Getwinutils.exe from http://public-repo-1.hortonworks.com/hdp-win-alpha/winutils.exe and put it in SPARK_HOME Add the following environment variables set HADOOP_HOME=%SPARK_HOME% set HADOOP_CONF_DIR=%SPARK_HOME%
  • 28.
    To reduce loggingmessages Copy %SPARK_HOME%/conf/log4j.properties.template to %SPARK_HOME%/conf/log4j.properties Replace INFO to WARN
  • 29.
    Key Features usedin Spark 1. Dataframes ◦ http://spark.apache.org/docs/latest/sql-programming-guide.html 2. Pyspark.ml API ◦ http://spark.apache.org/docs/latest/api/python/index.html
  • 30.
    Use case 1: Customer Segmentation Segmenting customers - How can we segment customers into groups ? - Typically Clustering algorithms like K-means are used What is K-means ? http://shabal.in/visuals/kmeans/2.html
  • 31.
    K-means Given a setof observations (x1, x2, …, xn), where each observation is a d-dimensional real vector, k-means clustering aims to partition the n observations into k (≤ n) sets S = {S1, S2, …, Sk} so as to minimize the within-cluster sum of squares (WCSS). In other words, its objective is to find: where μi is the mean of points in Si.
  • 32.
    Data Wrangling and Exploration Clustering Plottingfor Exploration Clustering approach
  • 33.
  • 34.
    Use-case 2 –Load Forecasting Given parameters like Temperature, day of week, month, time of day, can we predict load ? Typically methods like Regression are used Load = Function of (Temperature, day of week, month, time of day etc)
  • 35.
  • 36.
    Machine Learning Model PiecewiseLinear Model 50 different factors to use Like temperature, holidays Weekday/weekend etc
  • 37.
    Data Wrangling and Exploration MachineLearning for forecasting Plotting for Exploration Linear Regression
  • 38.
    248 unique customers 30million records 5 minute intervals 35 different subindustries US, Canada and Australia Data Sources Temperature data for more than 100 weather stations corresponding To the sites
  • 39.
    Enernoc dataset 248 uniquecustomers 30 million records 5 minute intervals 35 different subindustries US, Canada and Australia
  • 40.
    Demo Data Forecast.csv Goal : Tobuild a Linear Regression model to enable load forecasts given day,hour,month and temperature Load Forecasting-Dataframe.ipyb
  • 41.
  • 44.
    References 1. Spark documentationand http://spark.apache.org/ 2. Spark presentations primarily by Spark founders and the Databricks team
  • 45.
    Thank you! Sri Krishnamurthy,CFA, CAP Founder and CEO QuantUniversity LLC. srikrishnamurthy www.QuantUniversity.com www.analyticscertificate.com Contact Information, data and drawings embodied in this presentation are strictly a property of QuantUniversity LLC. and shall not be distributed or used in any other publication without the prior written consent of QuantUniversity LLC.