Download to read offline
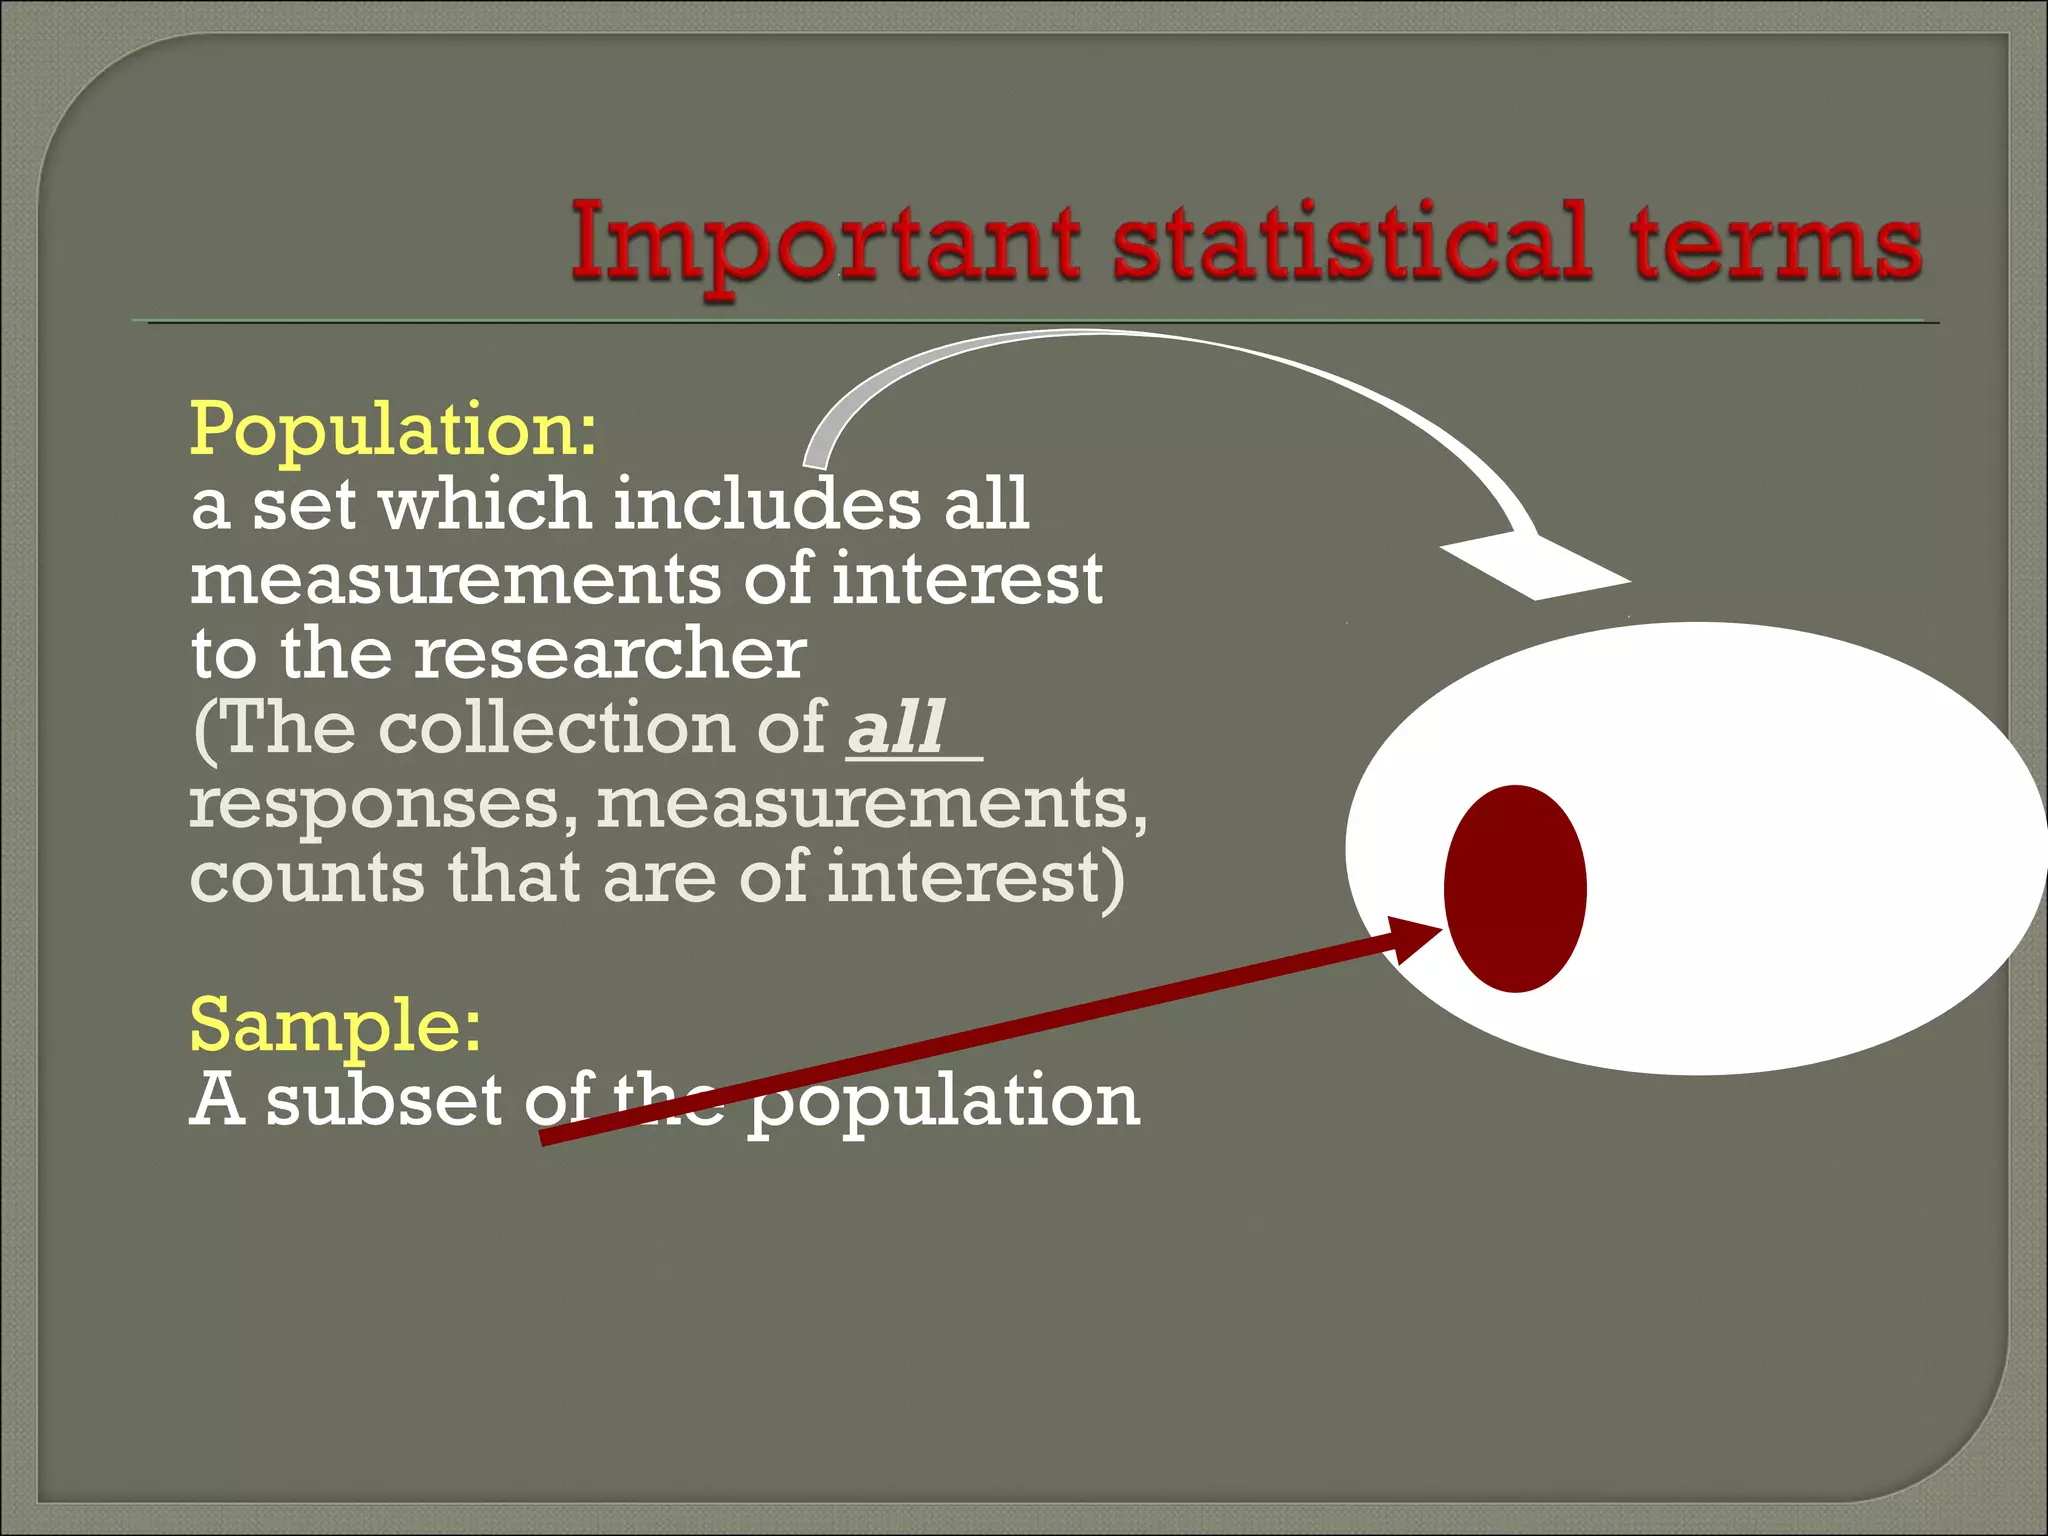
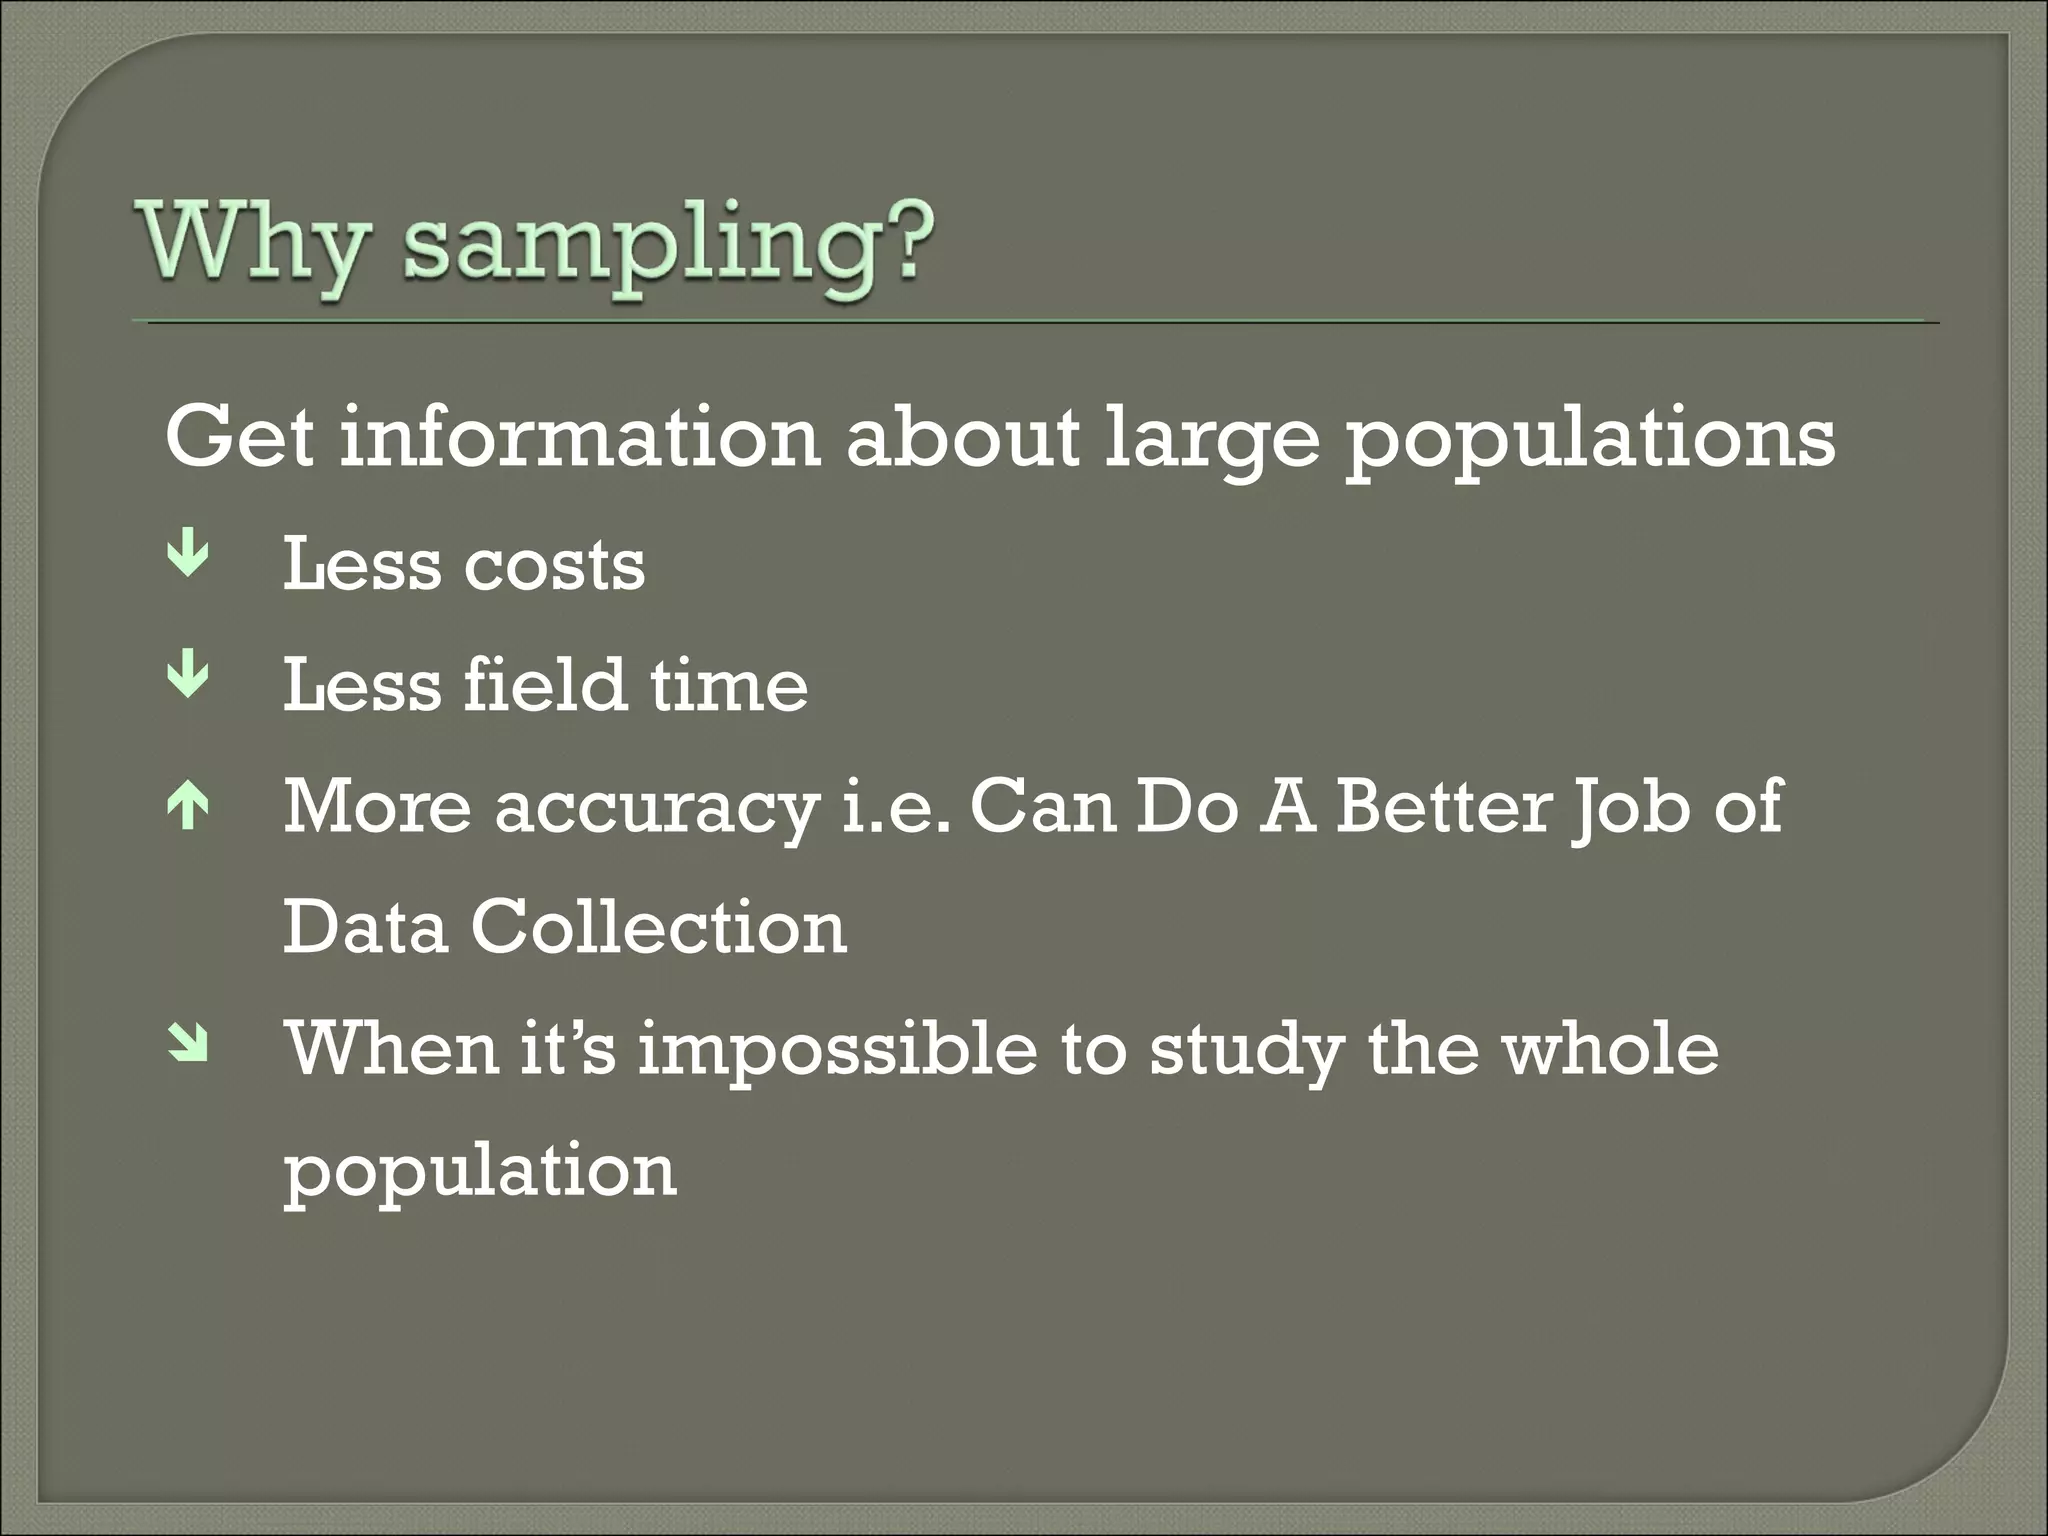
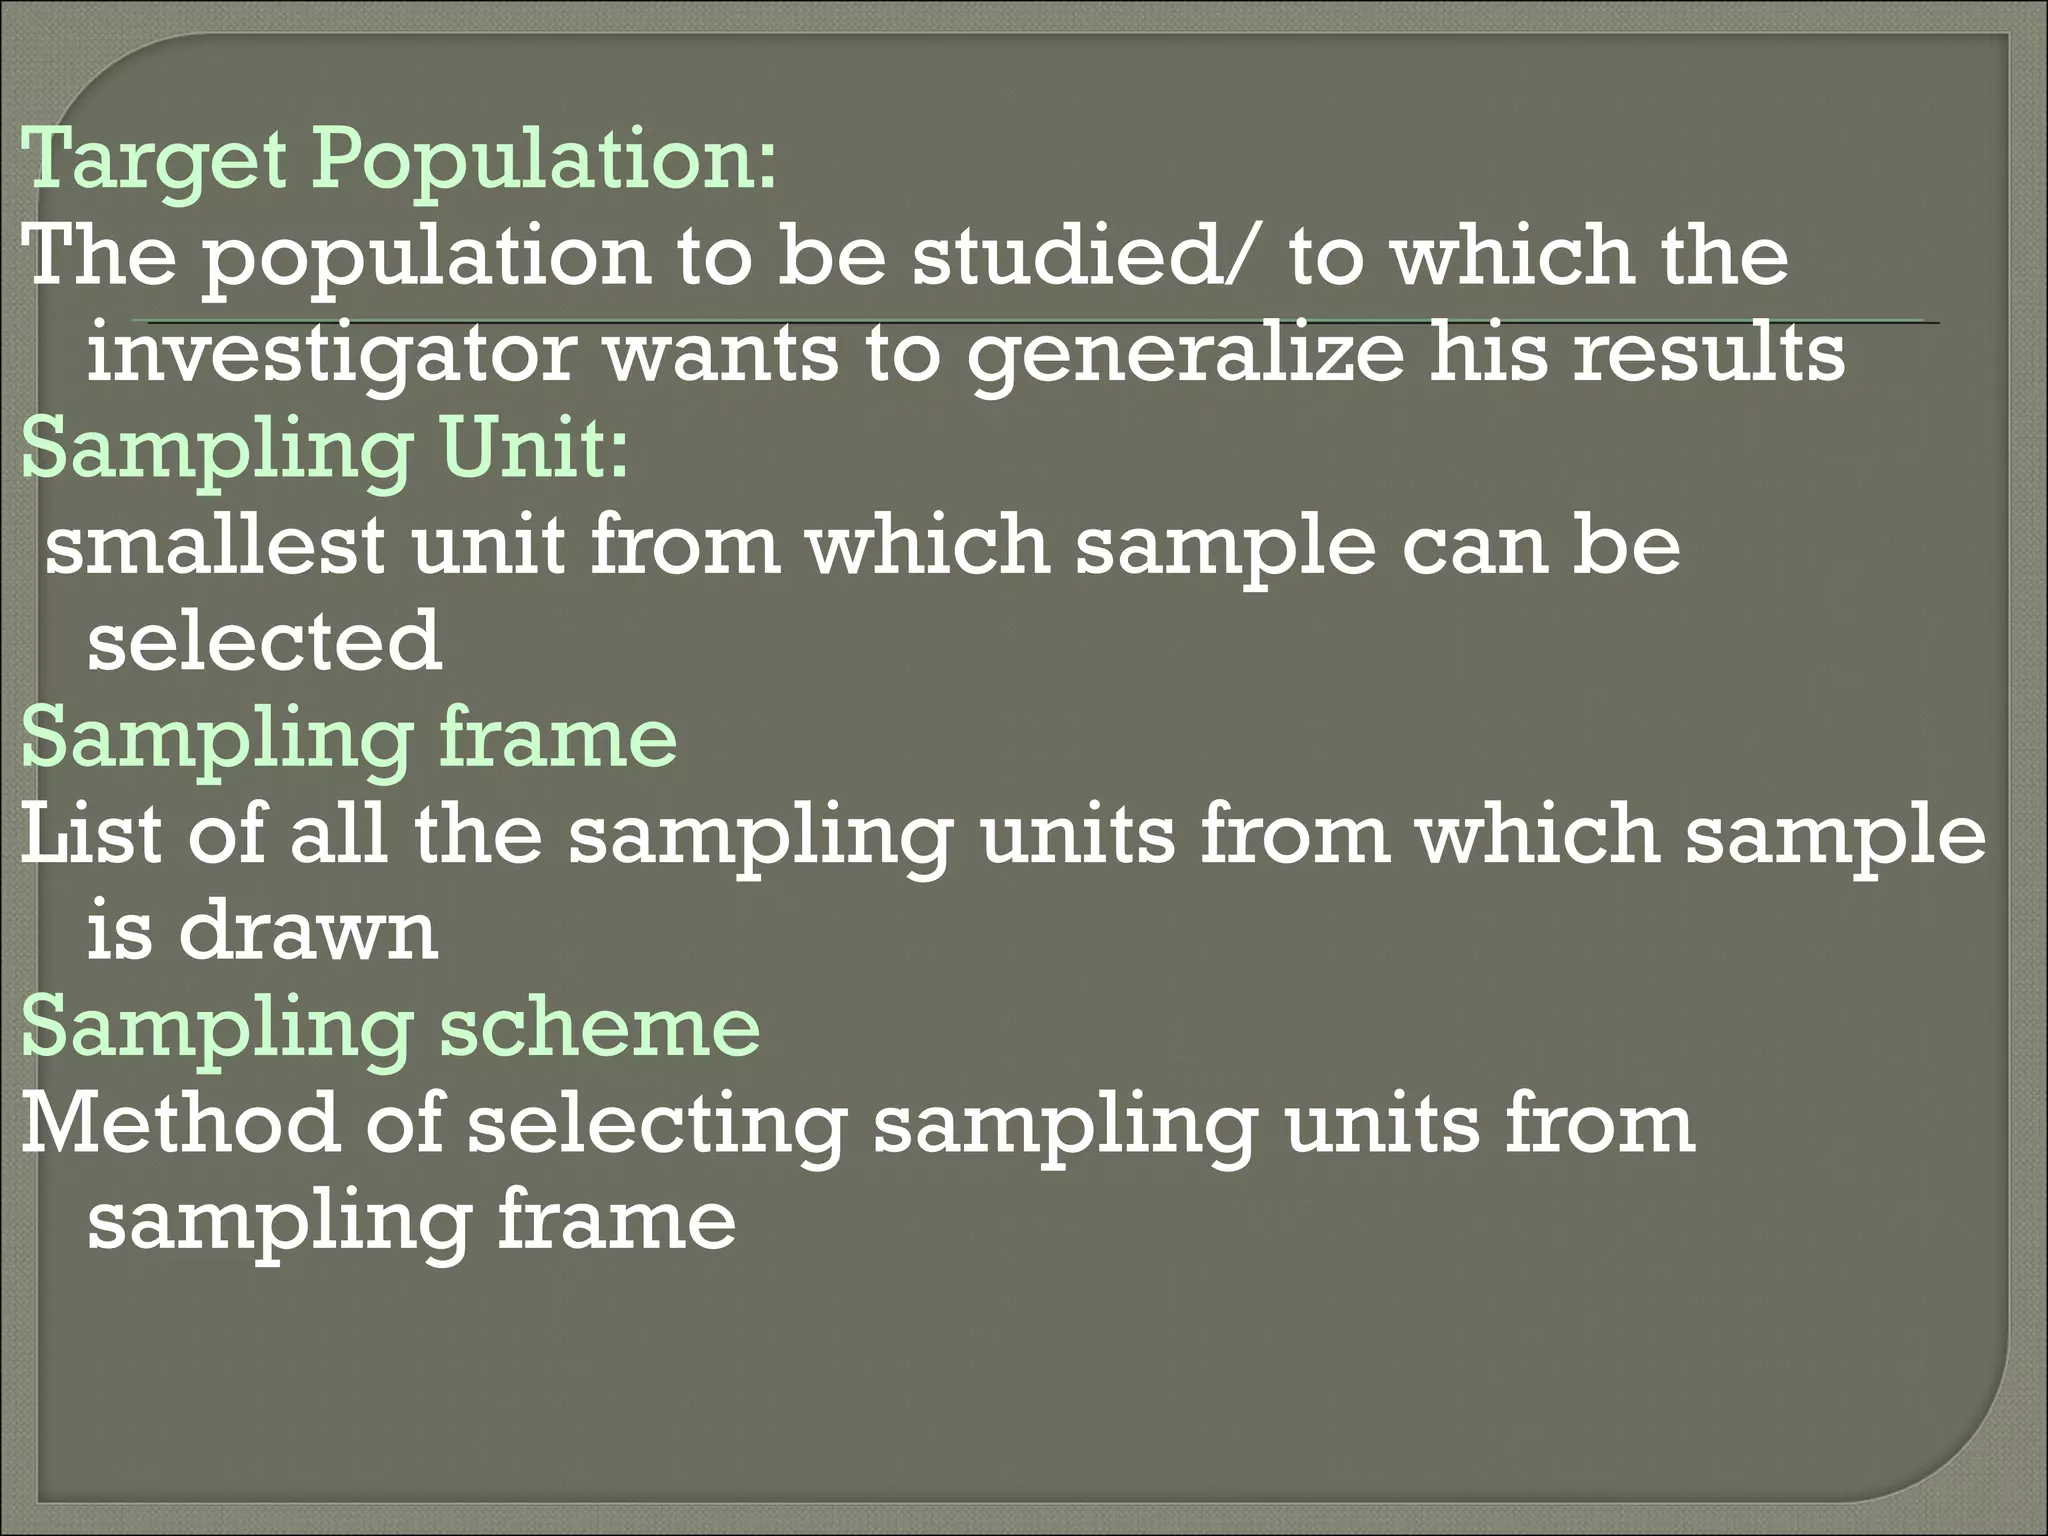
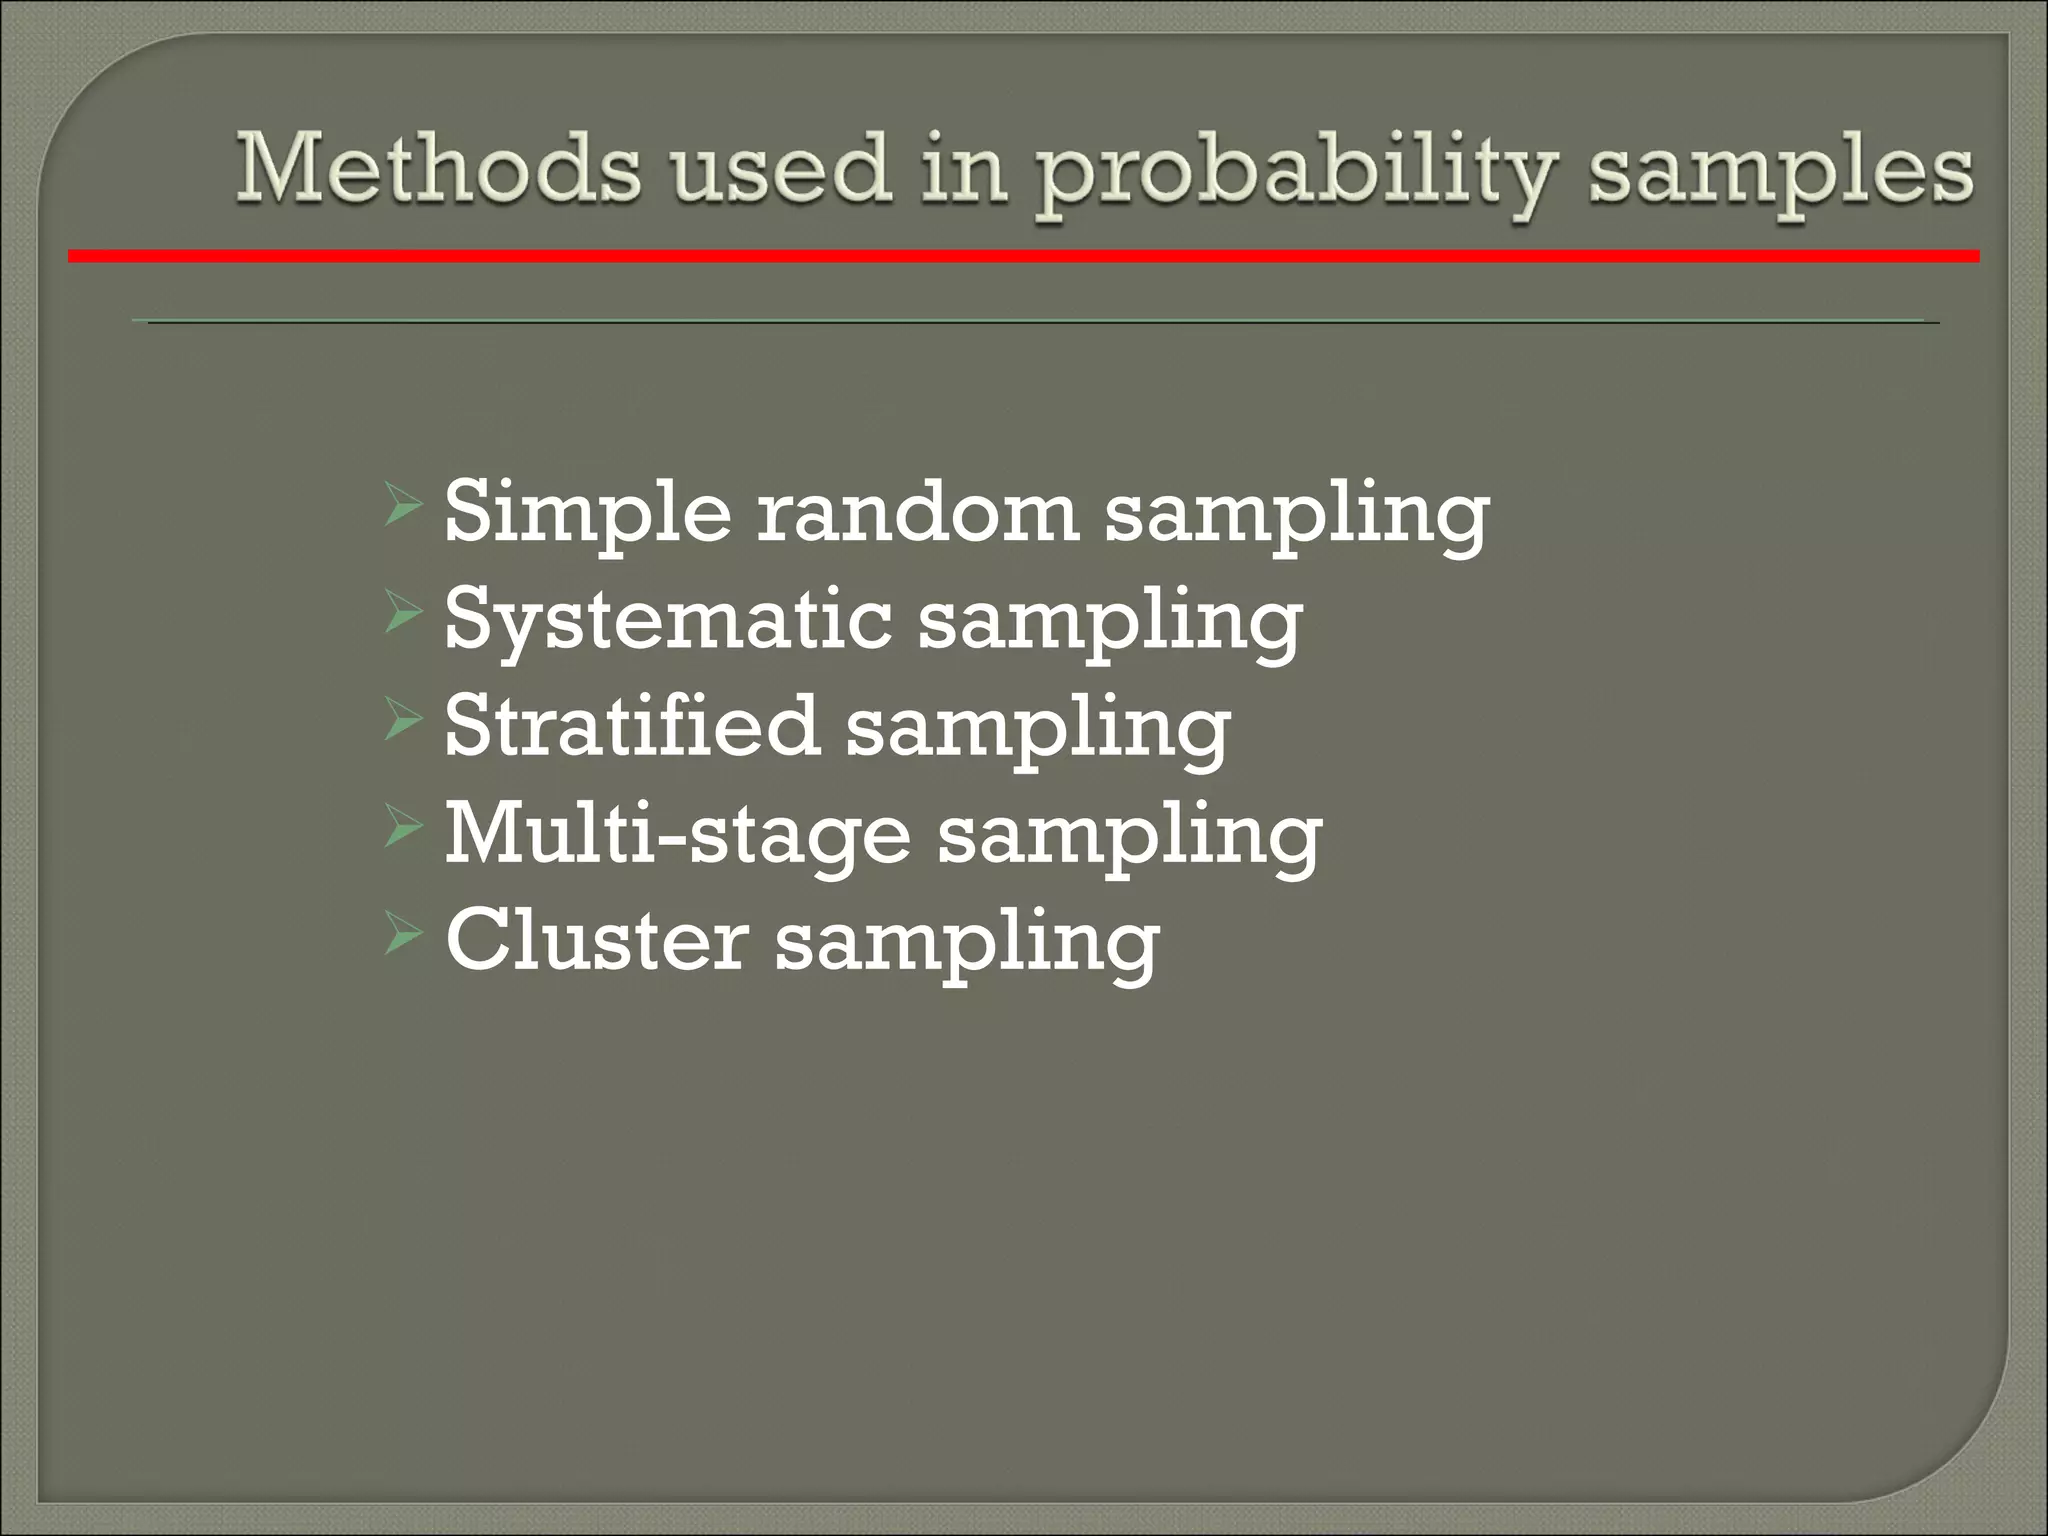
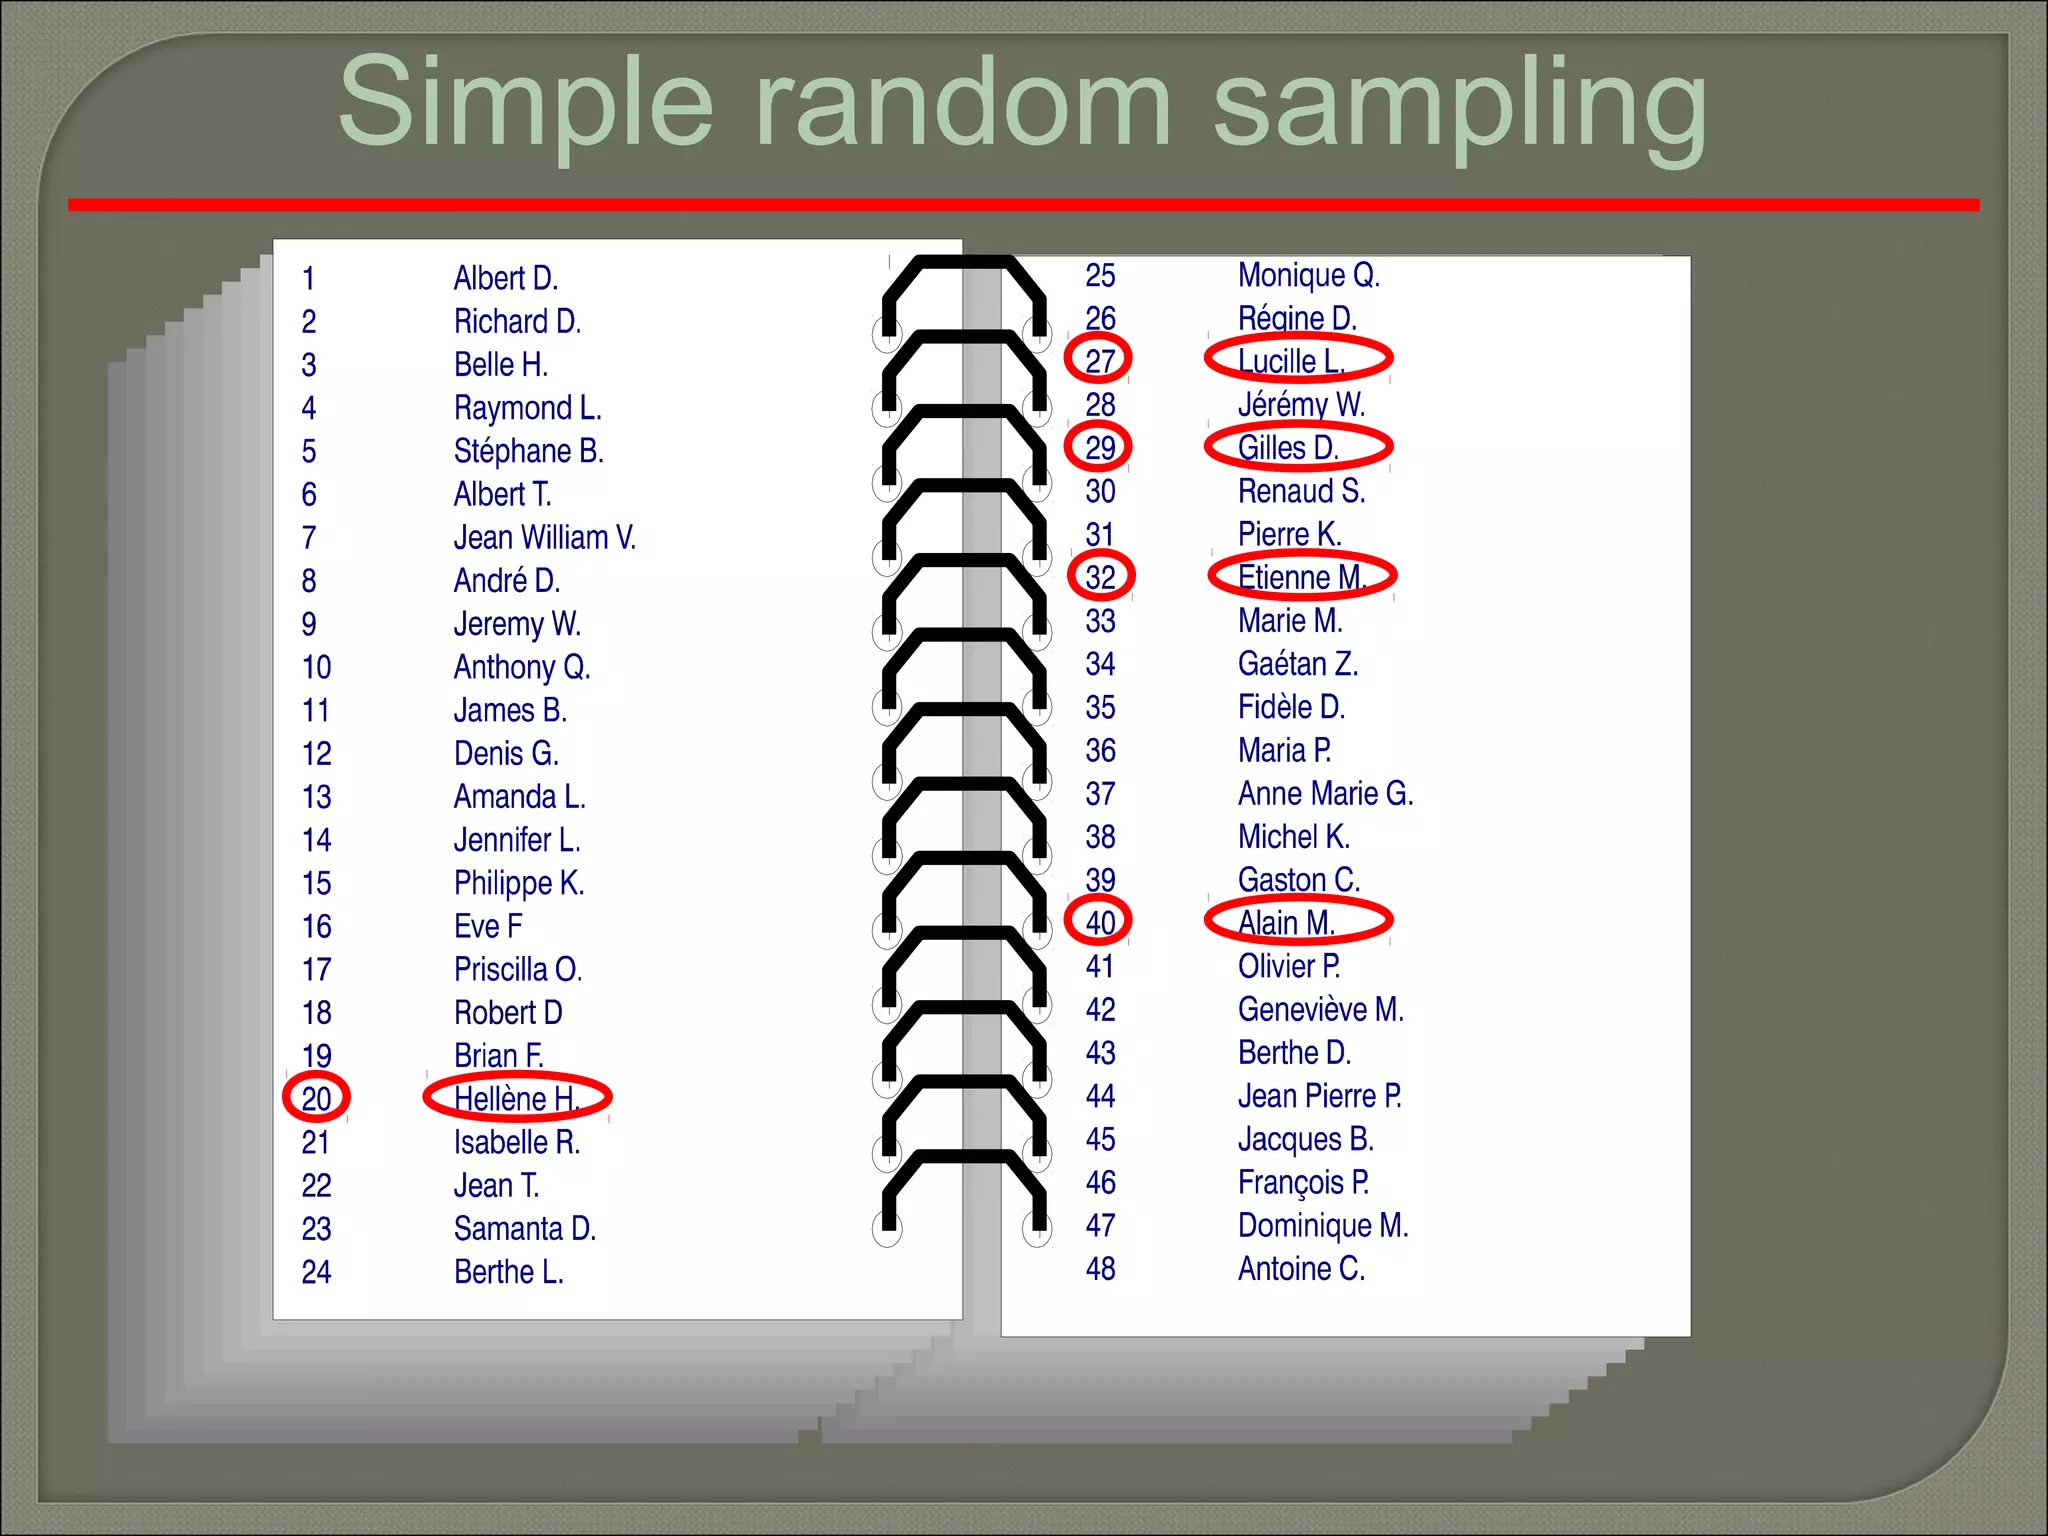
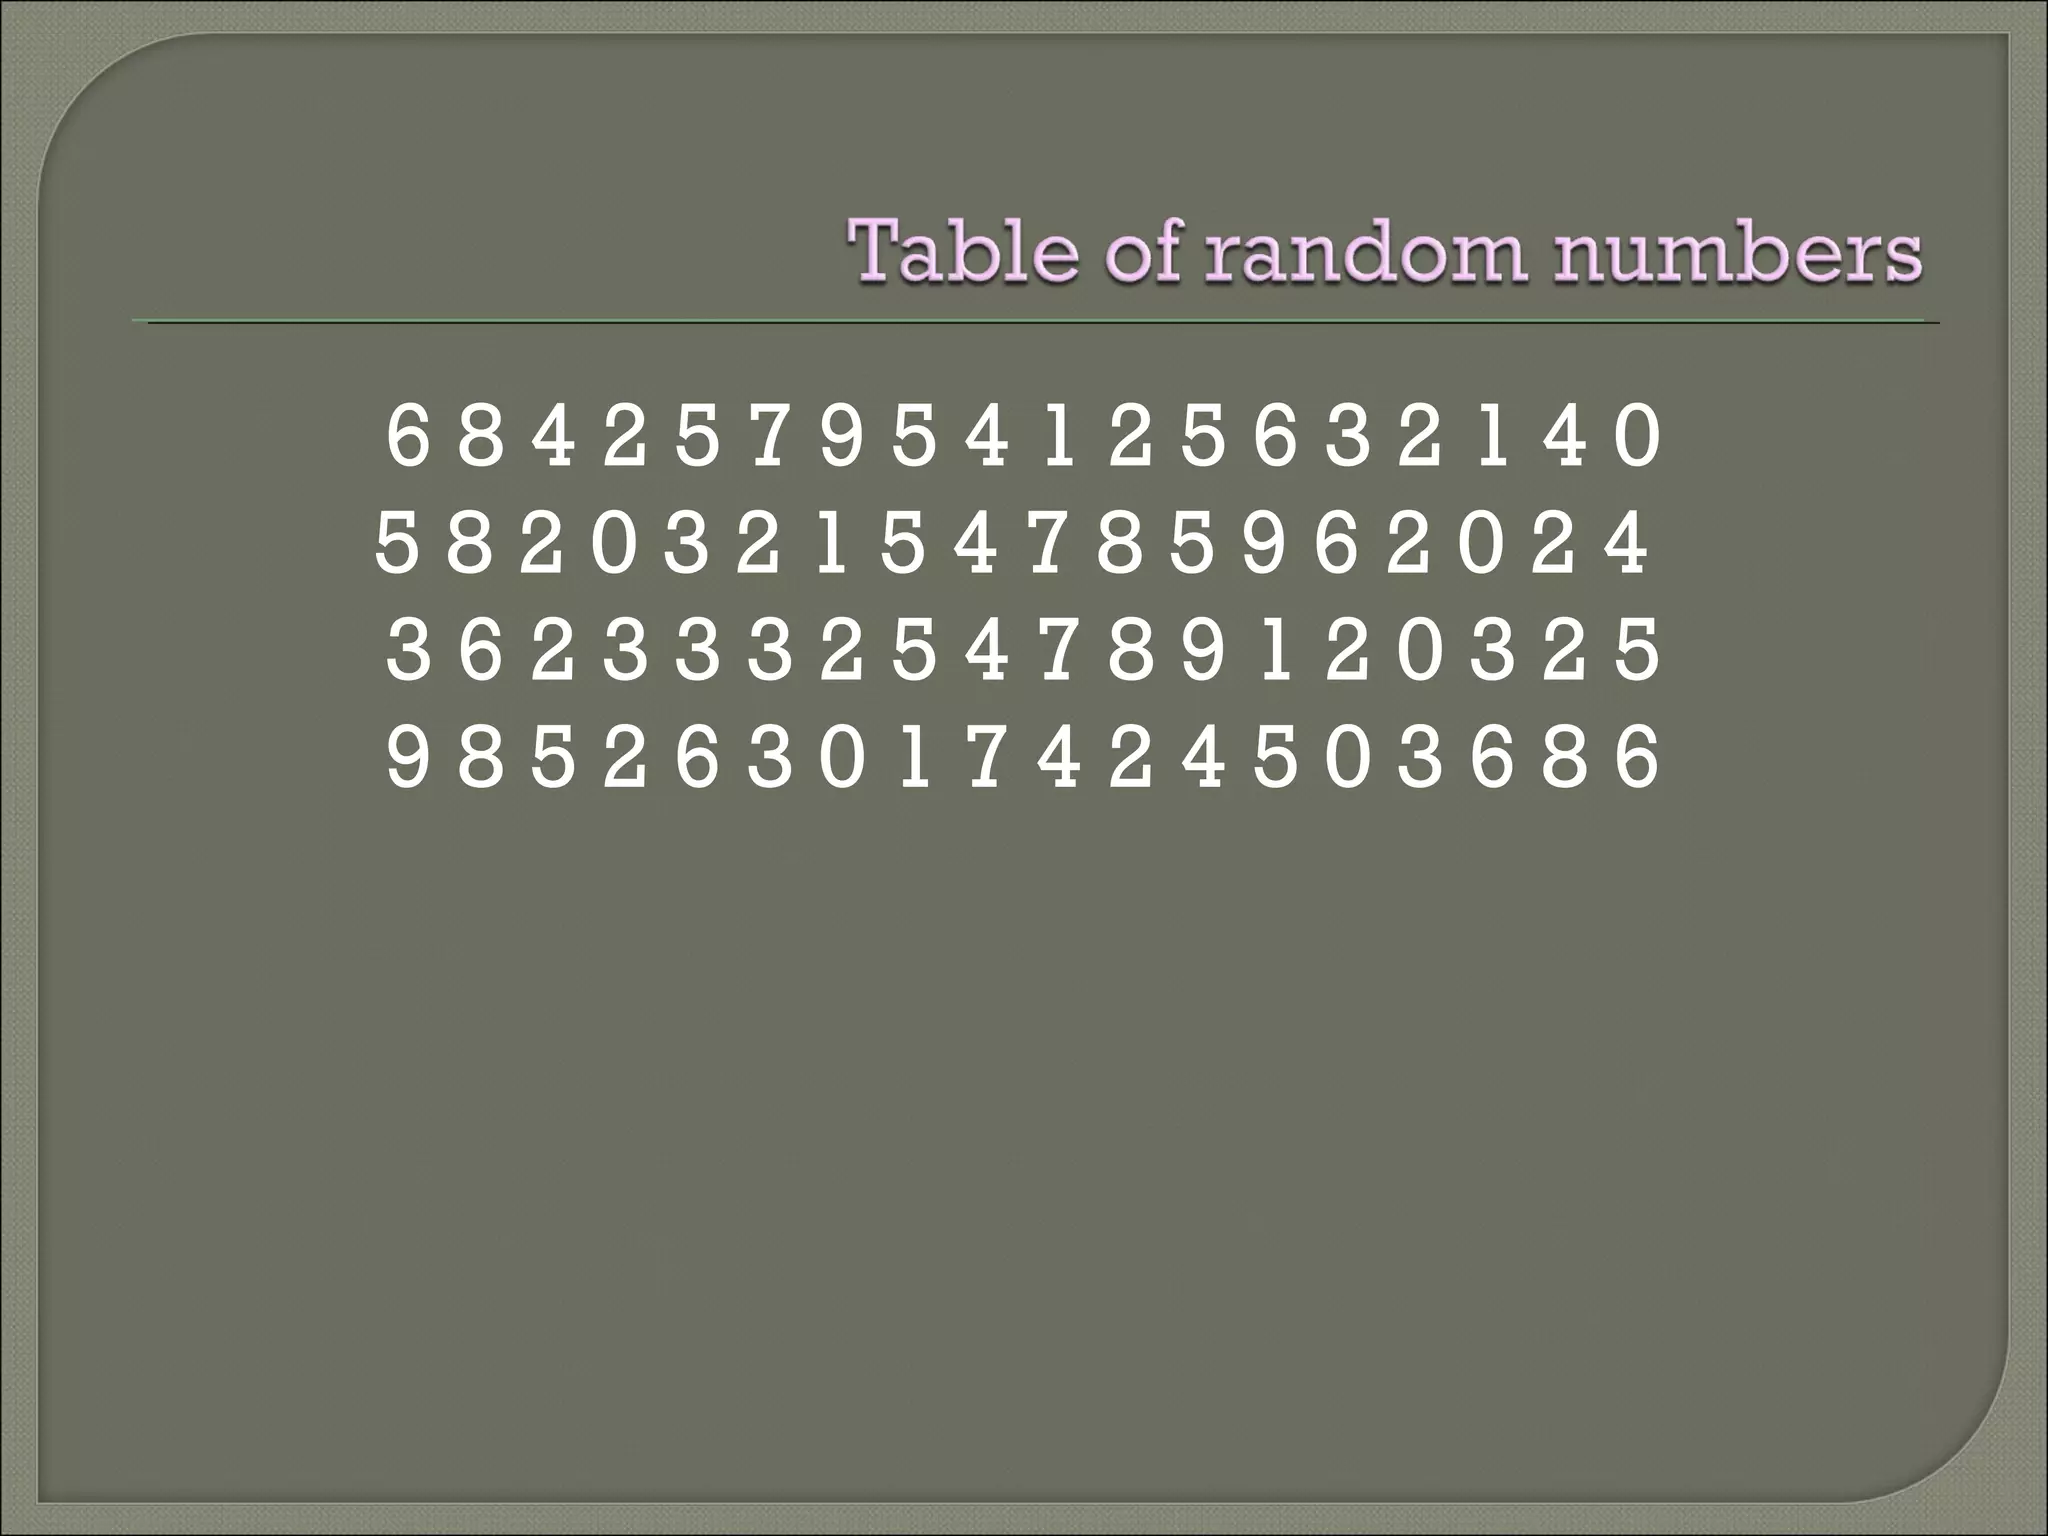
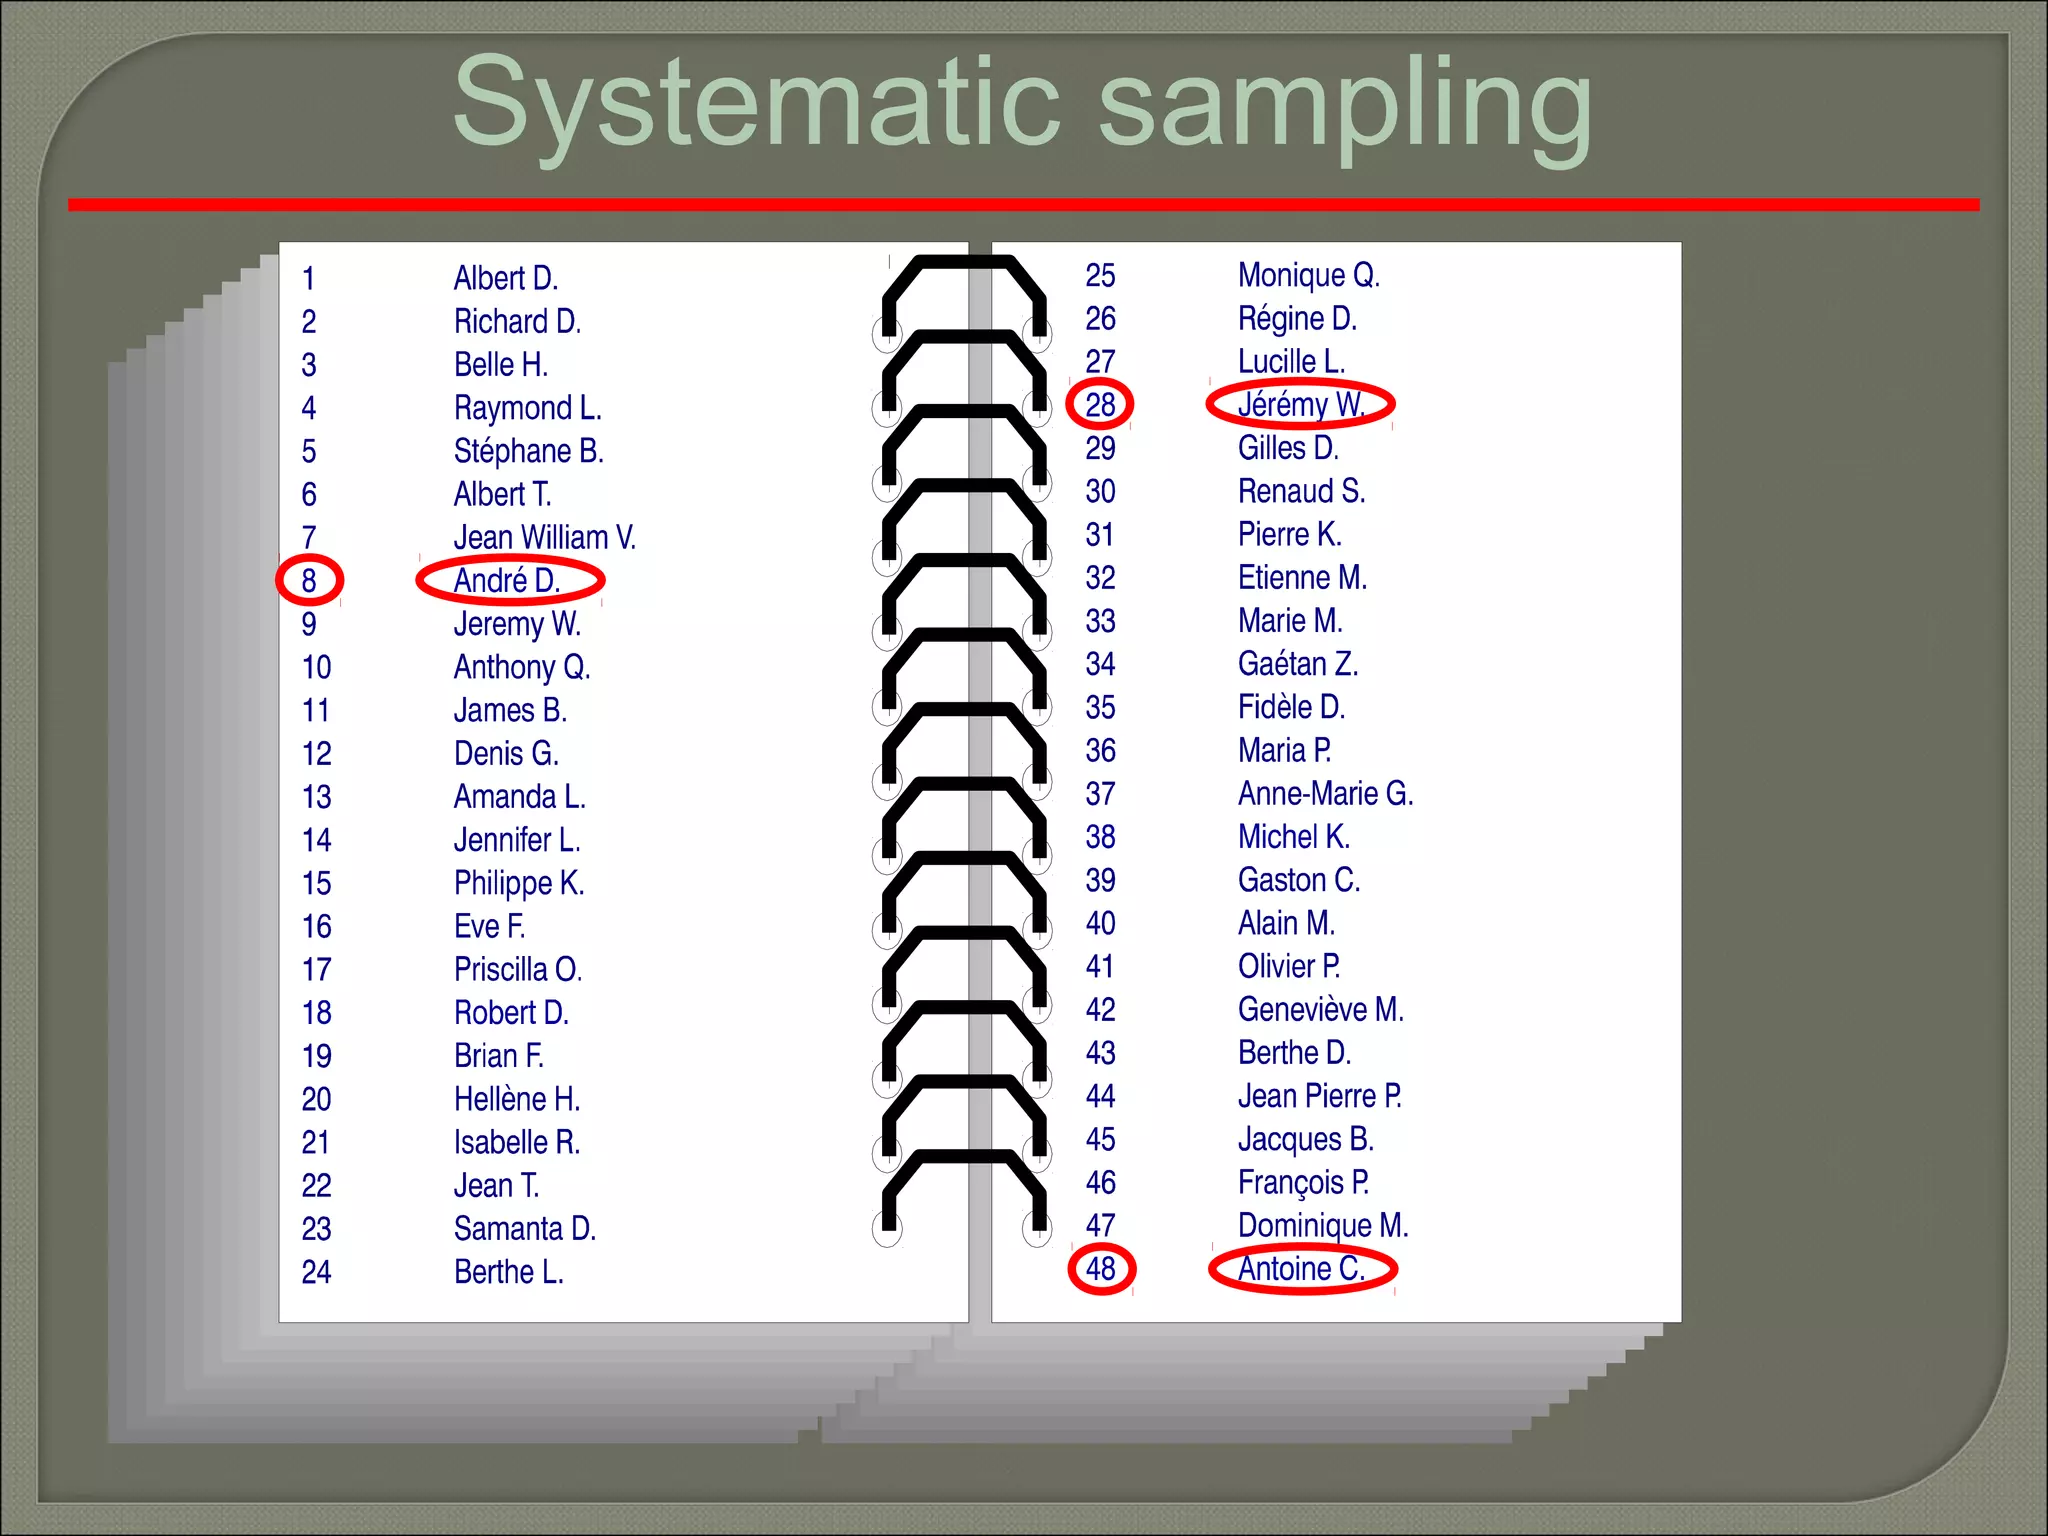
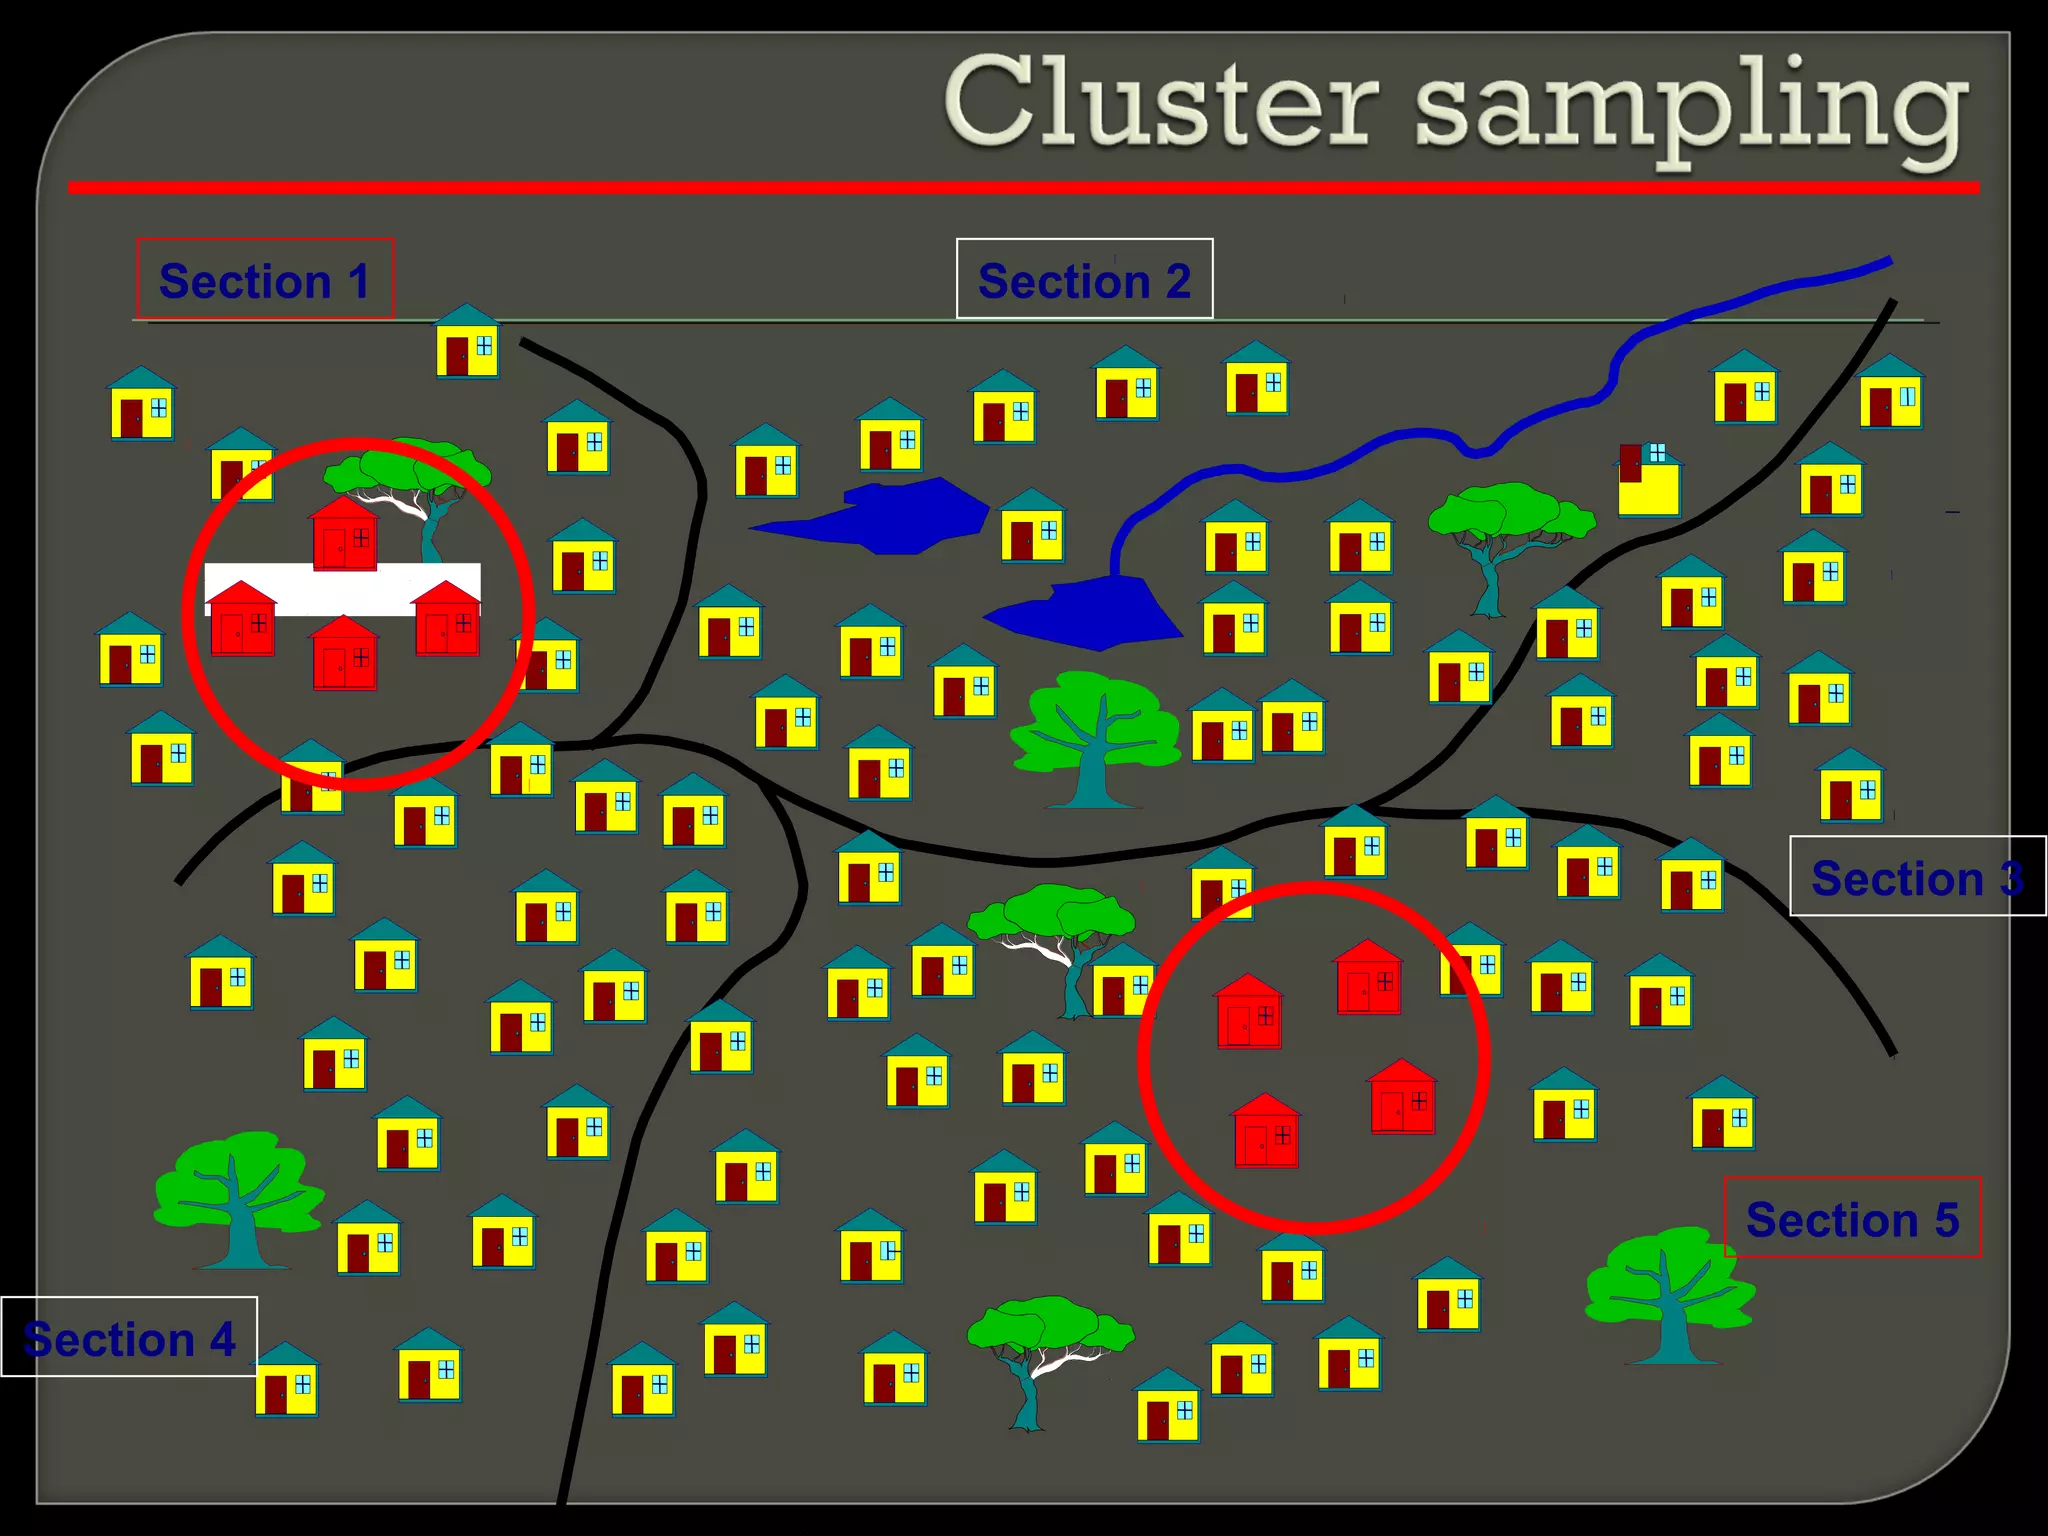
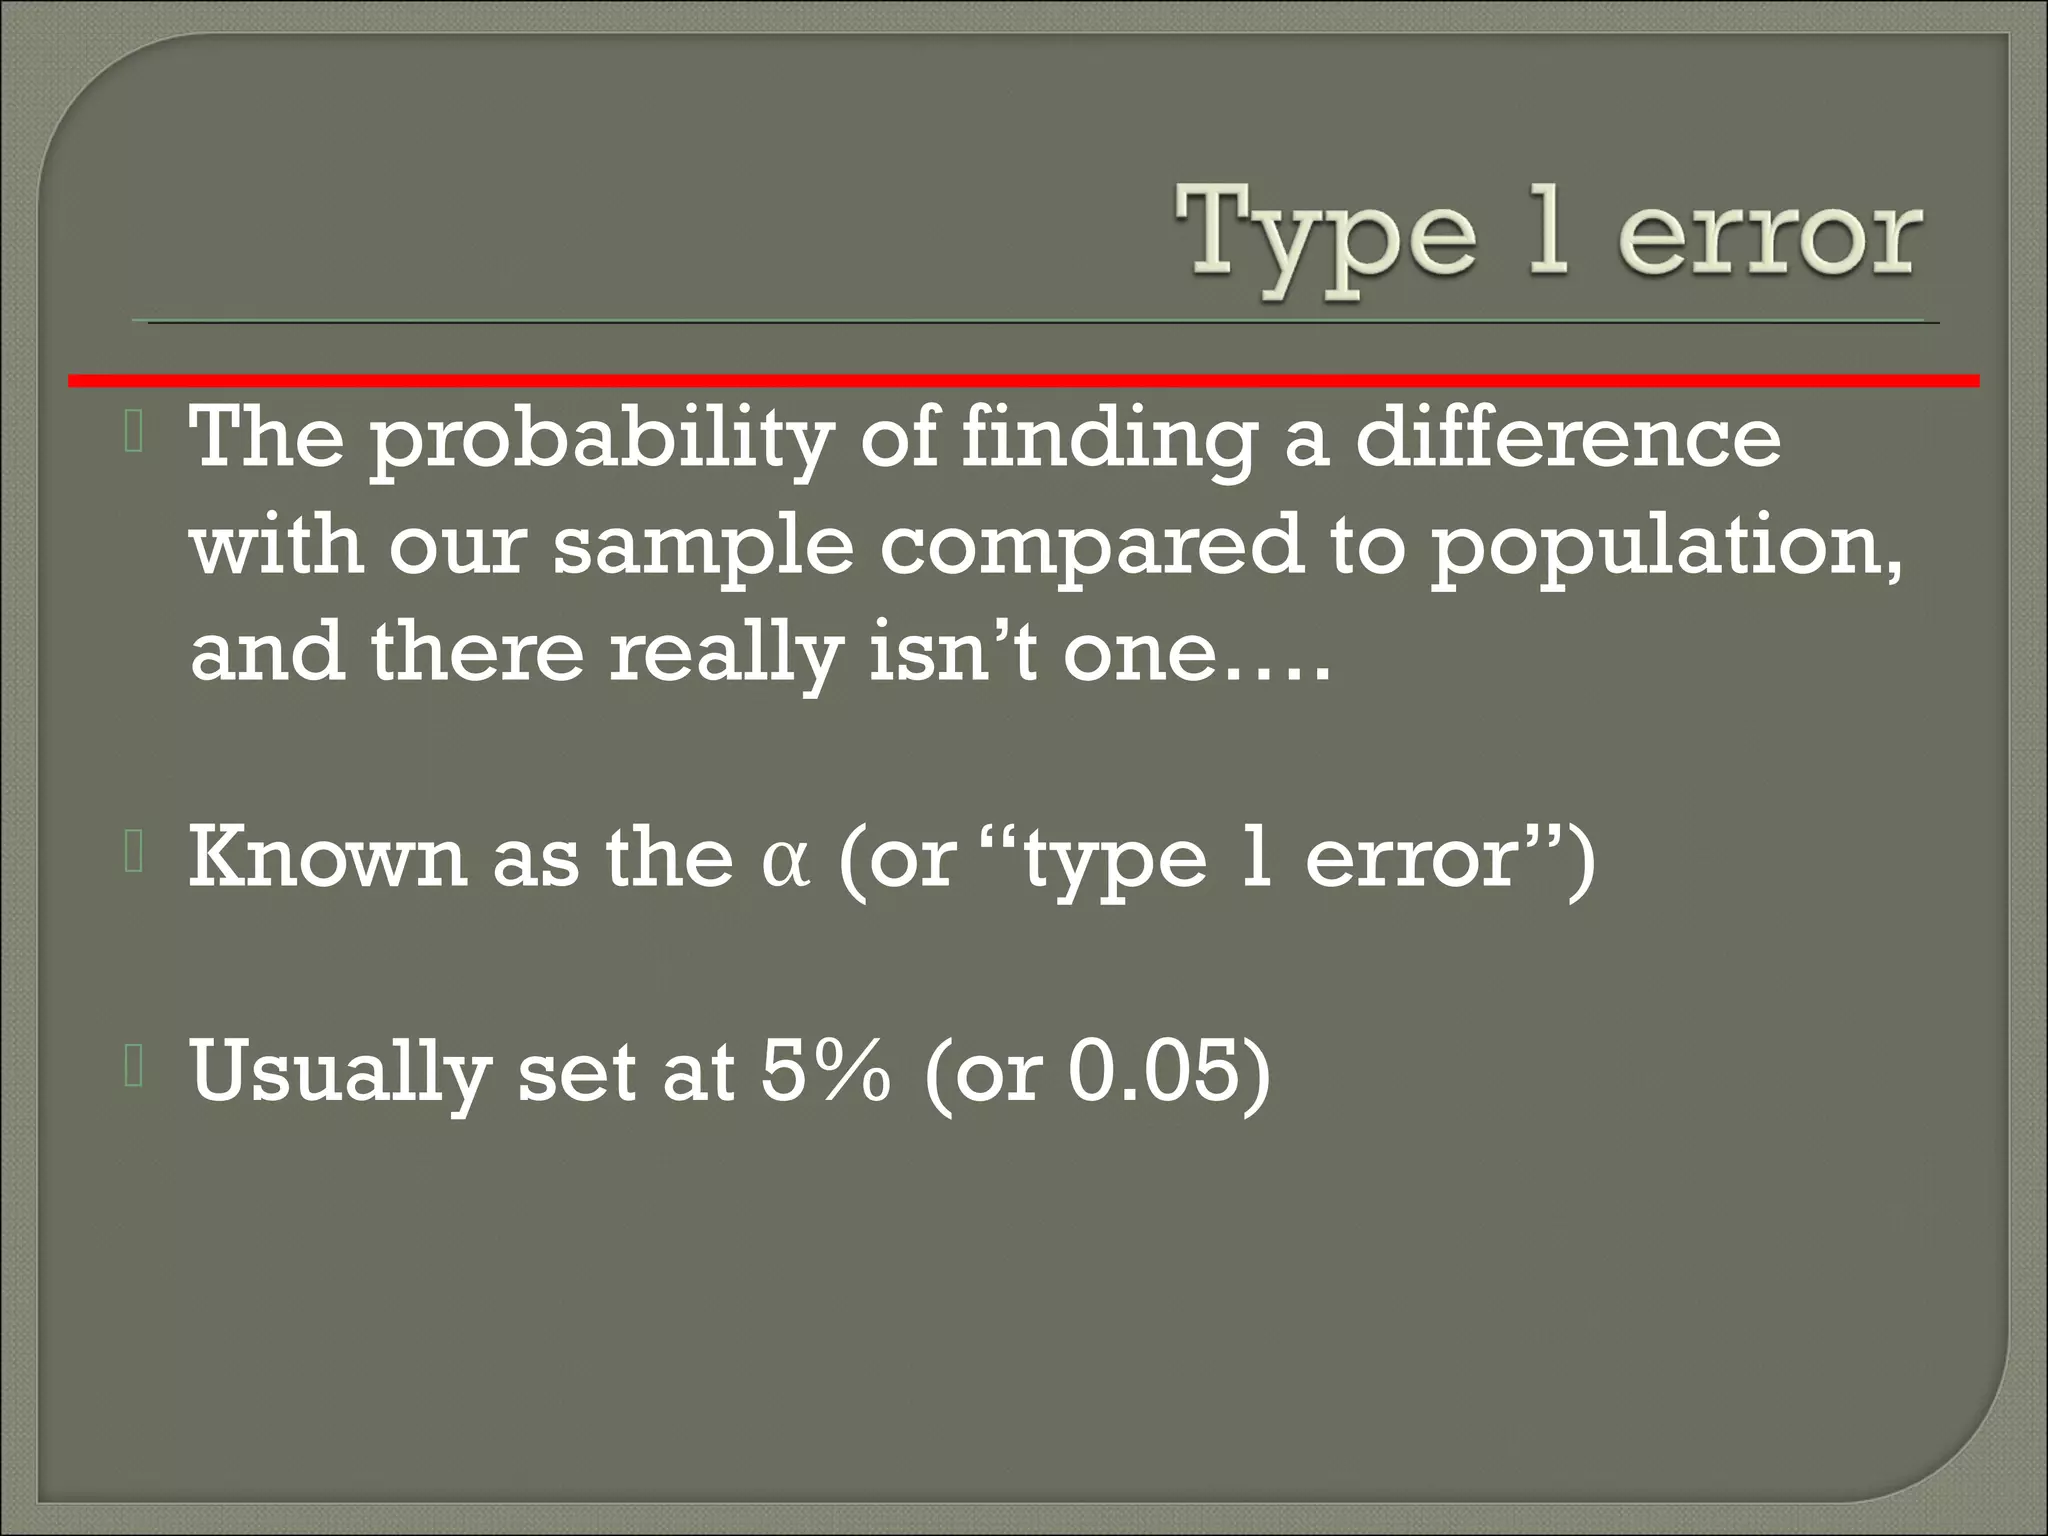
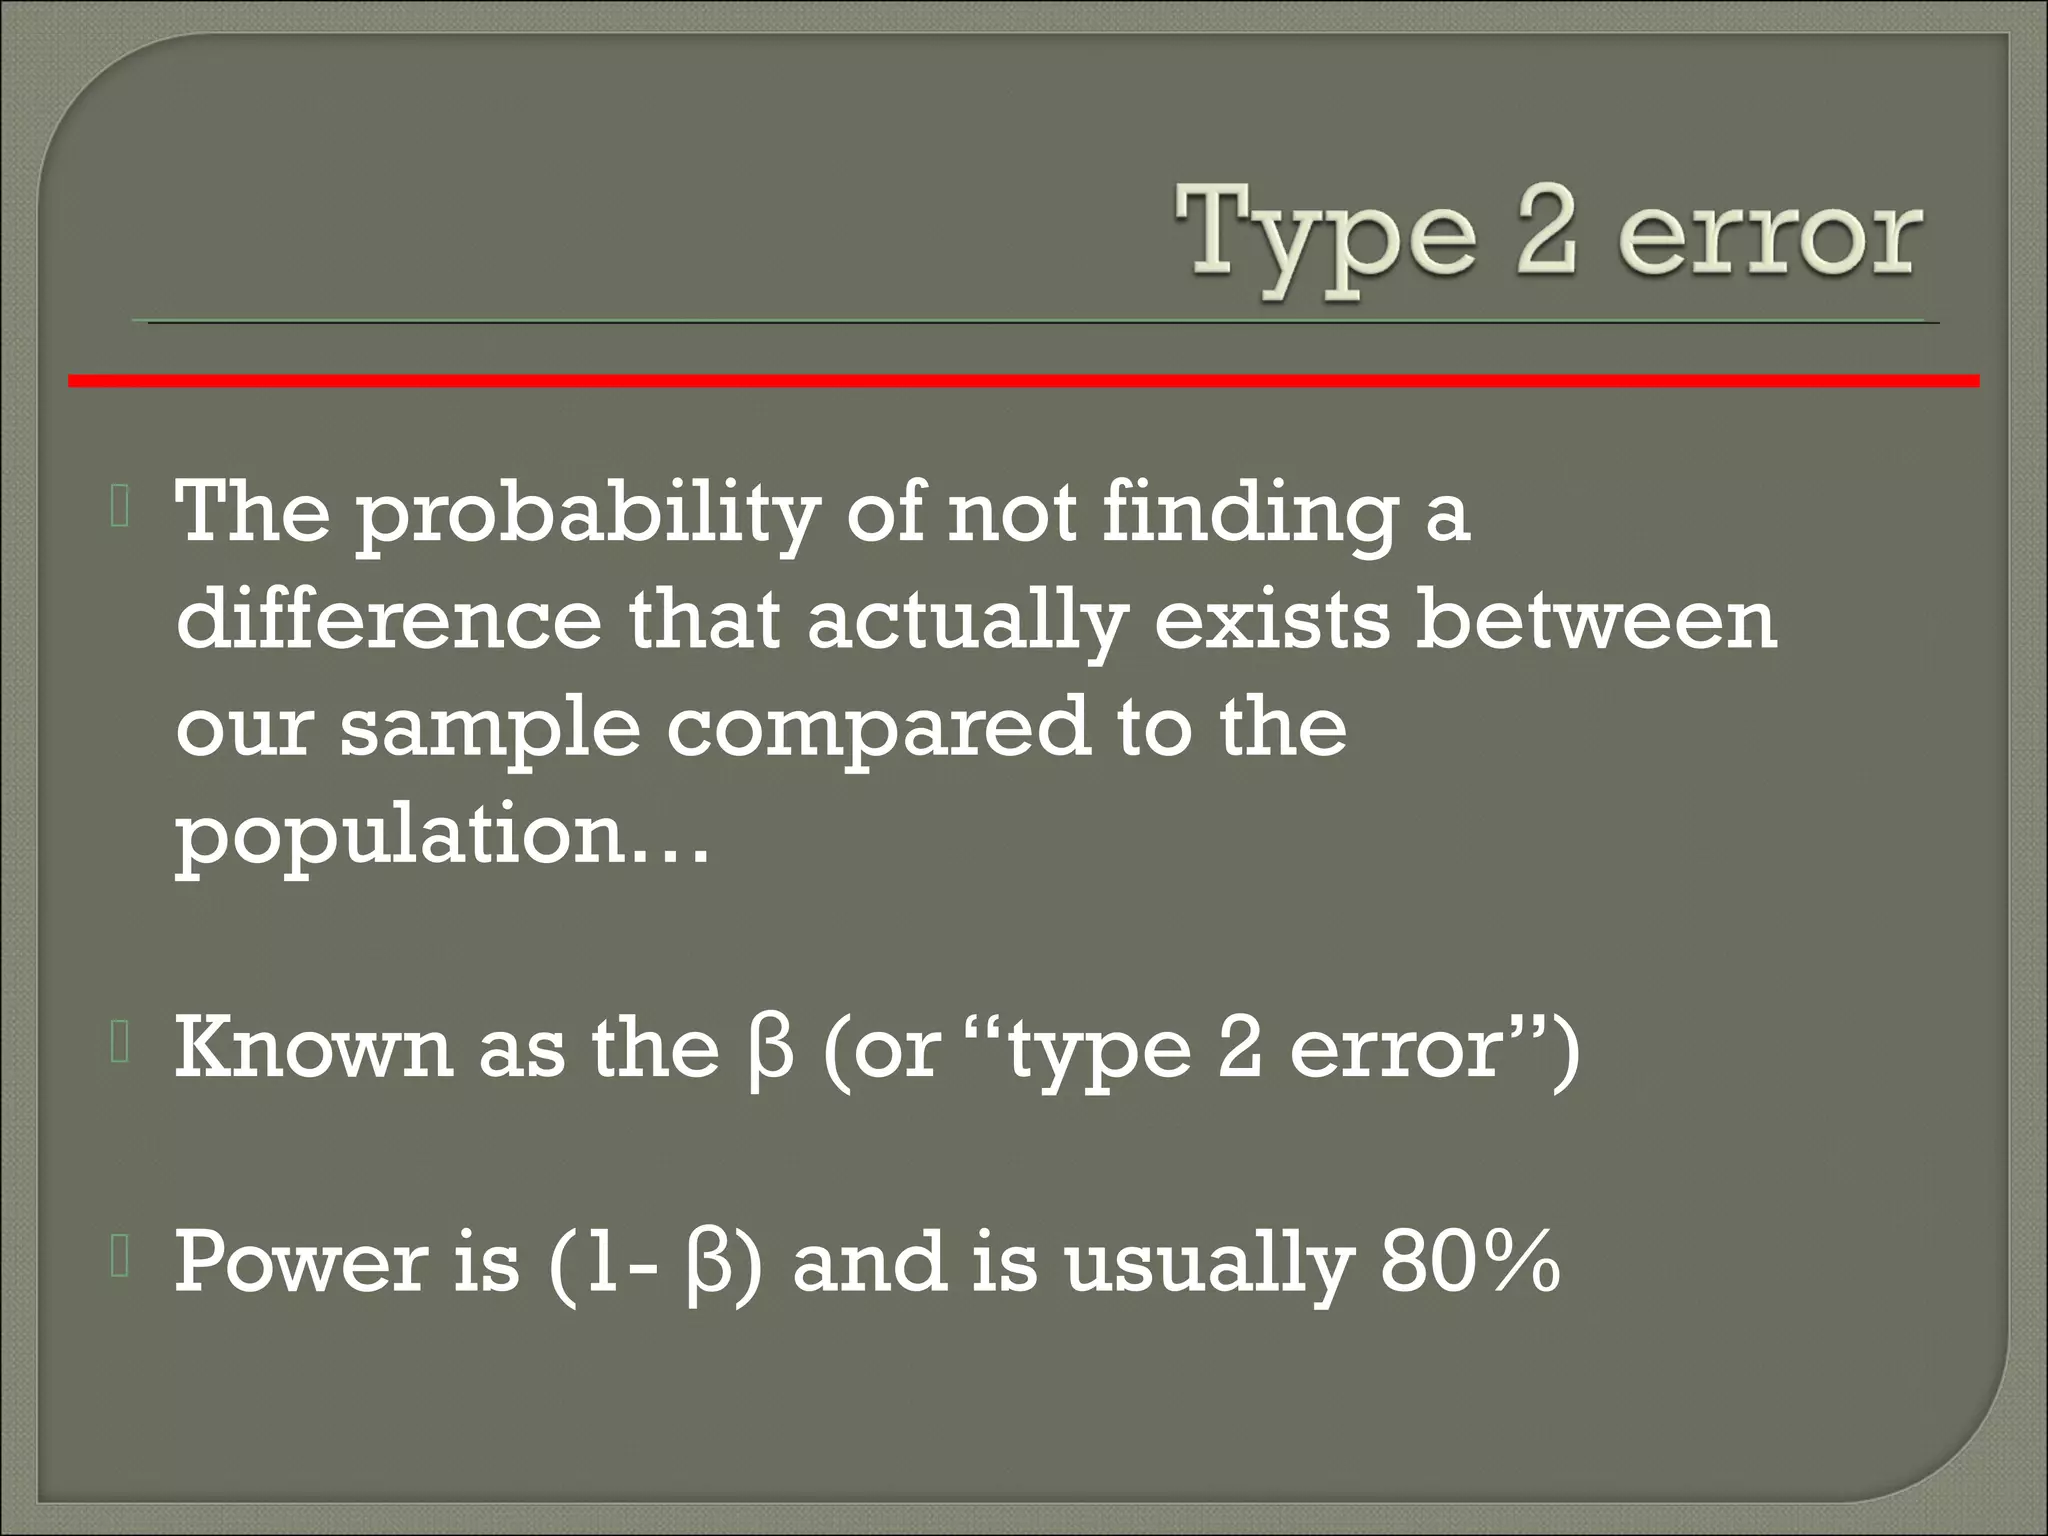
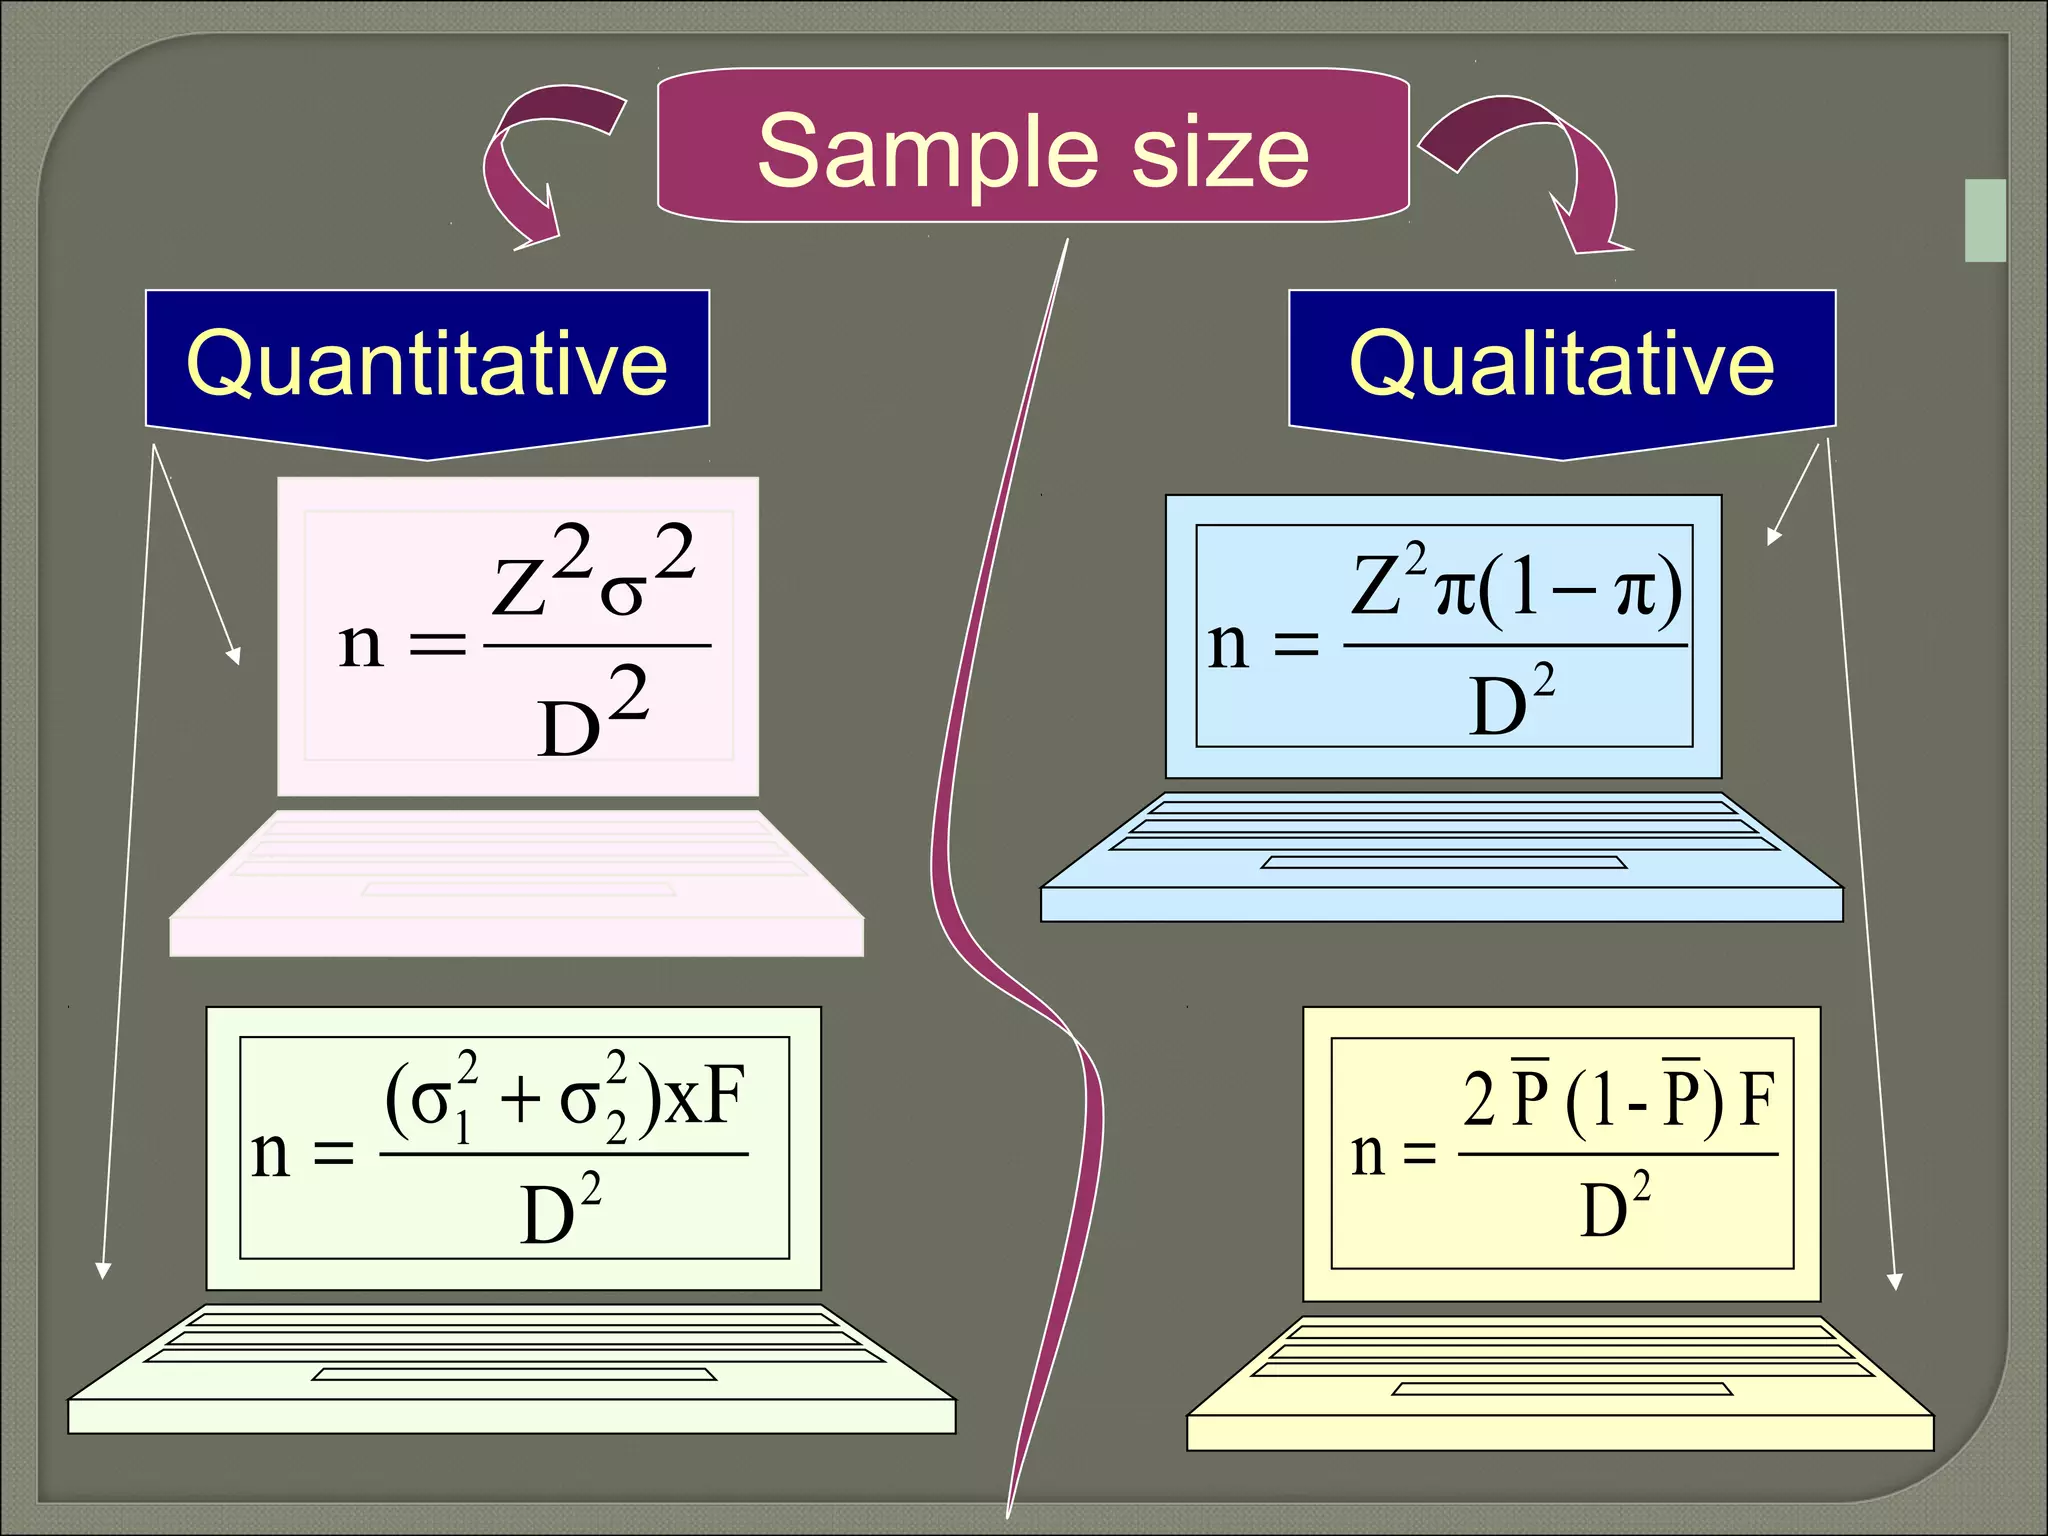
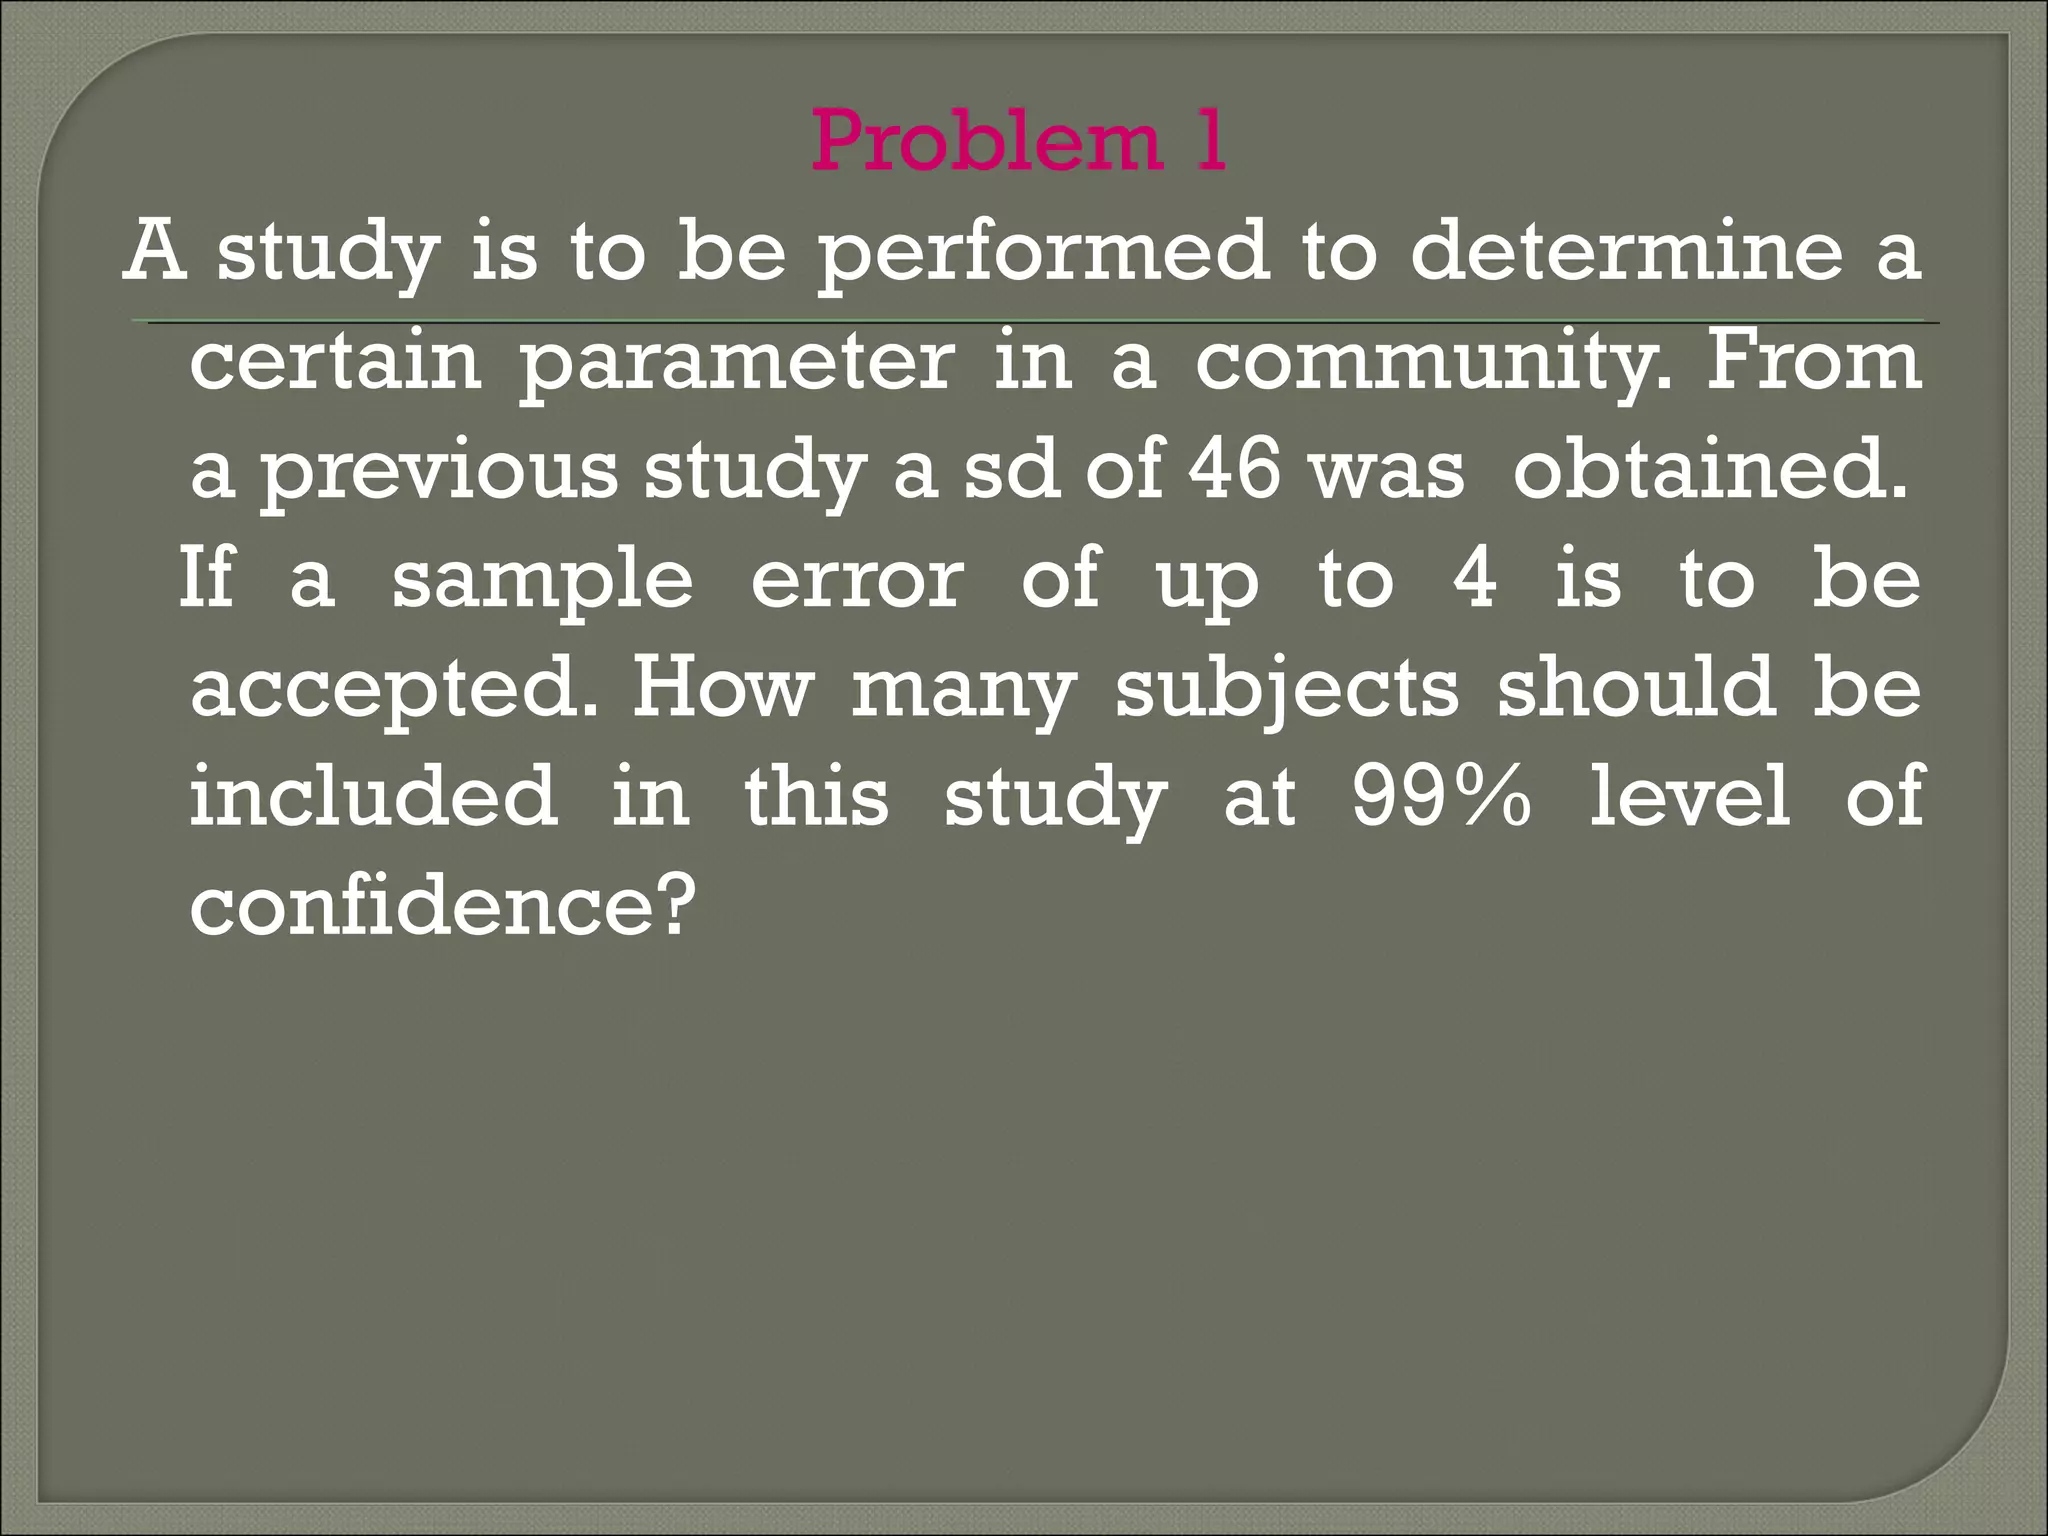
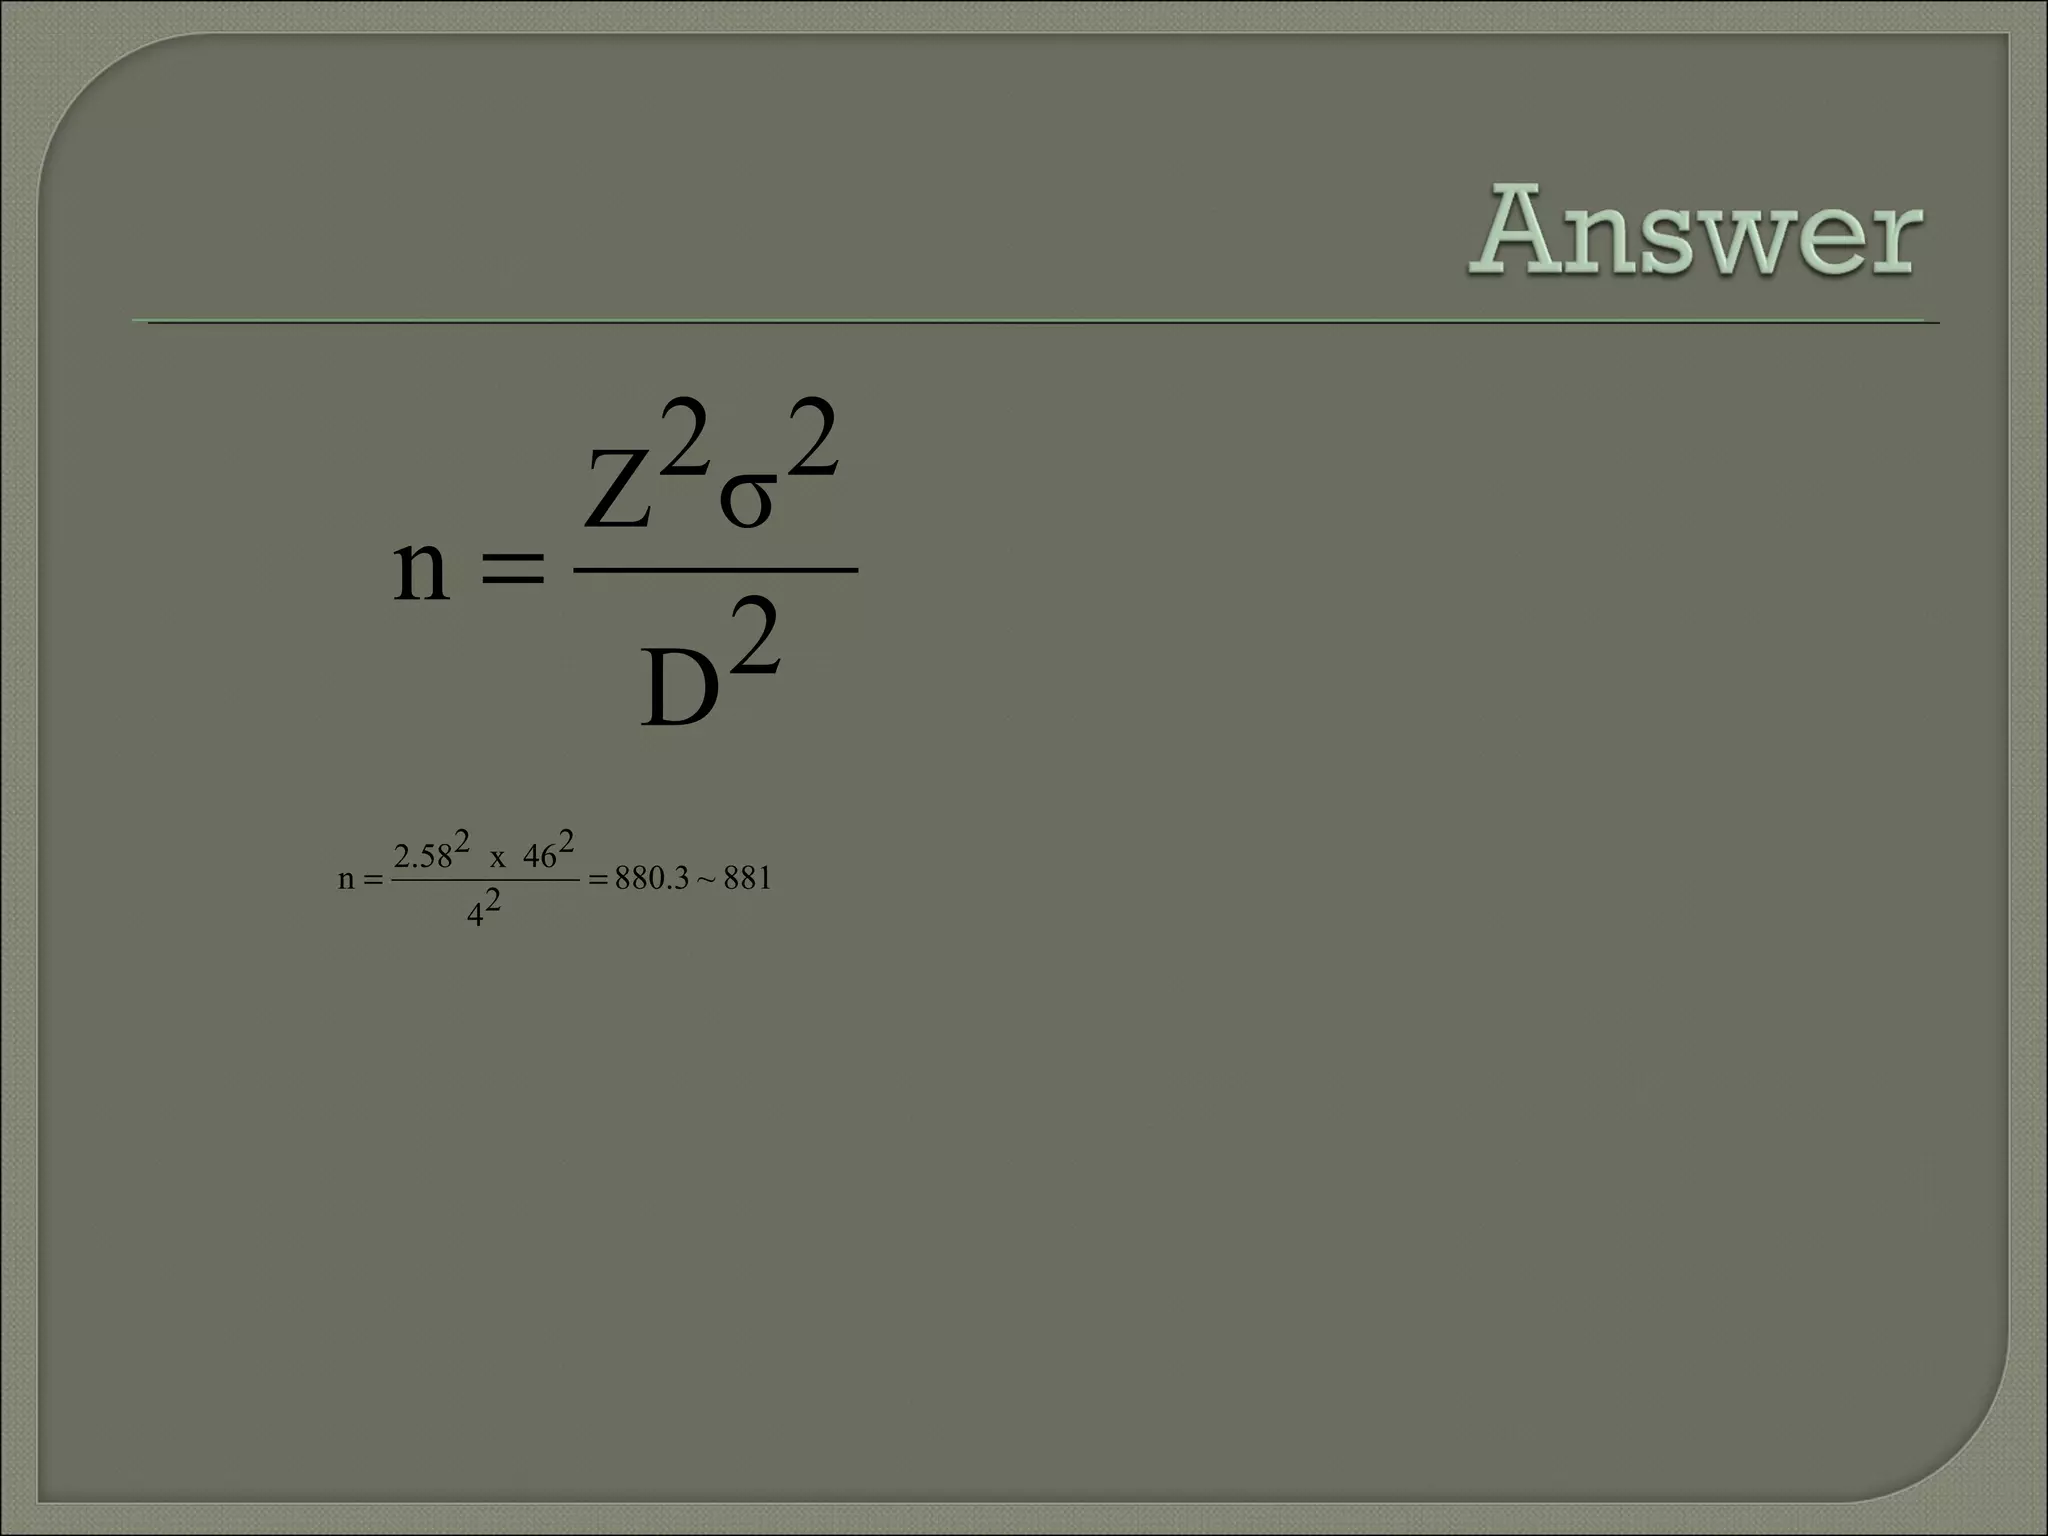
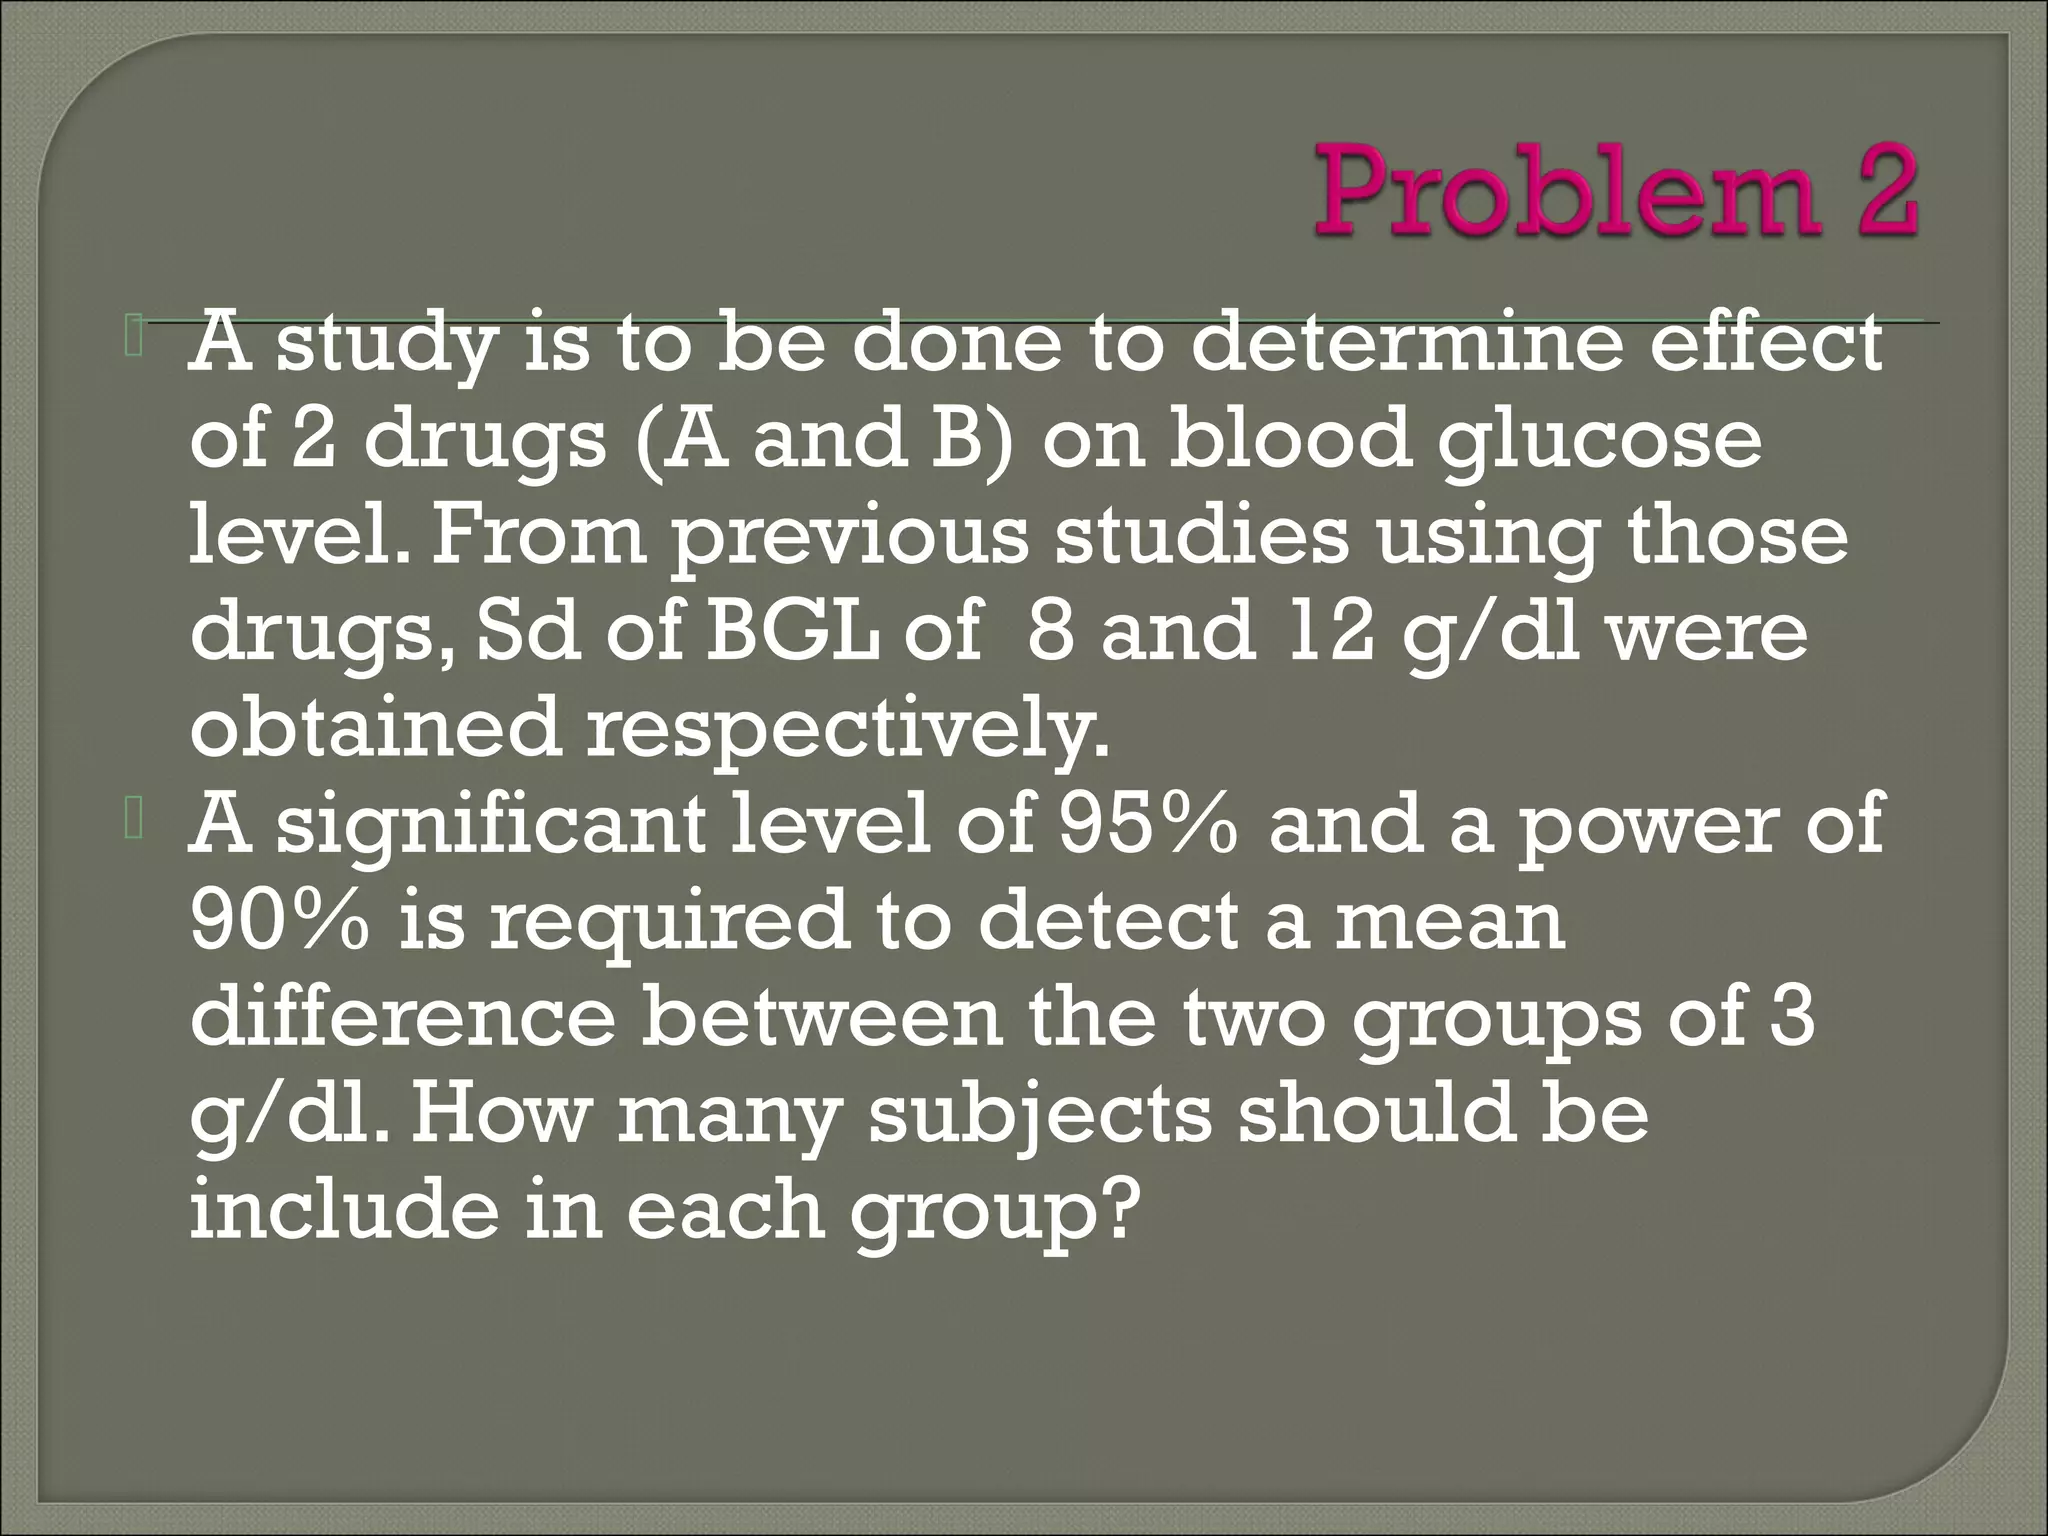
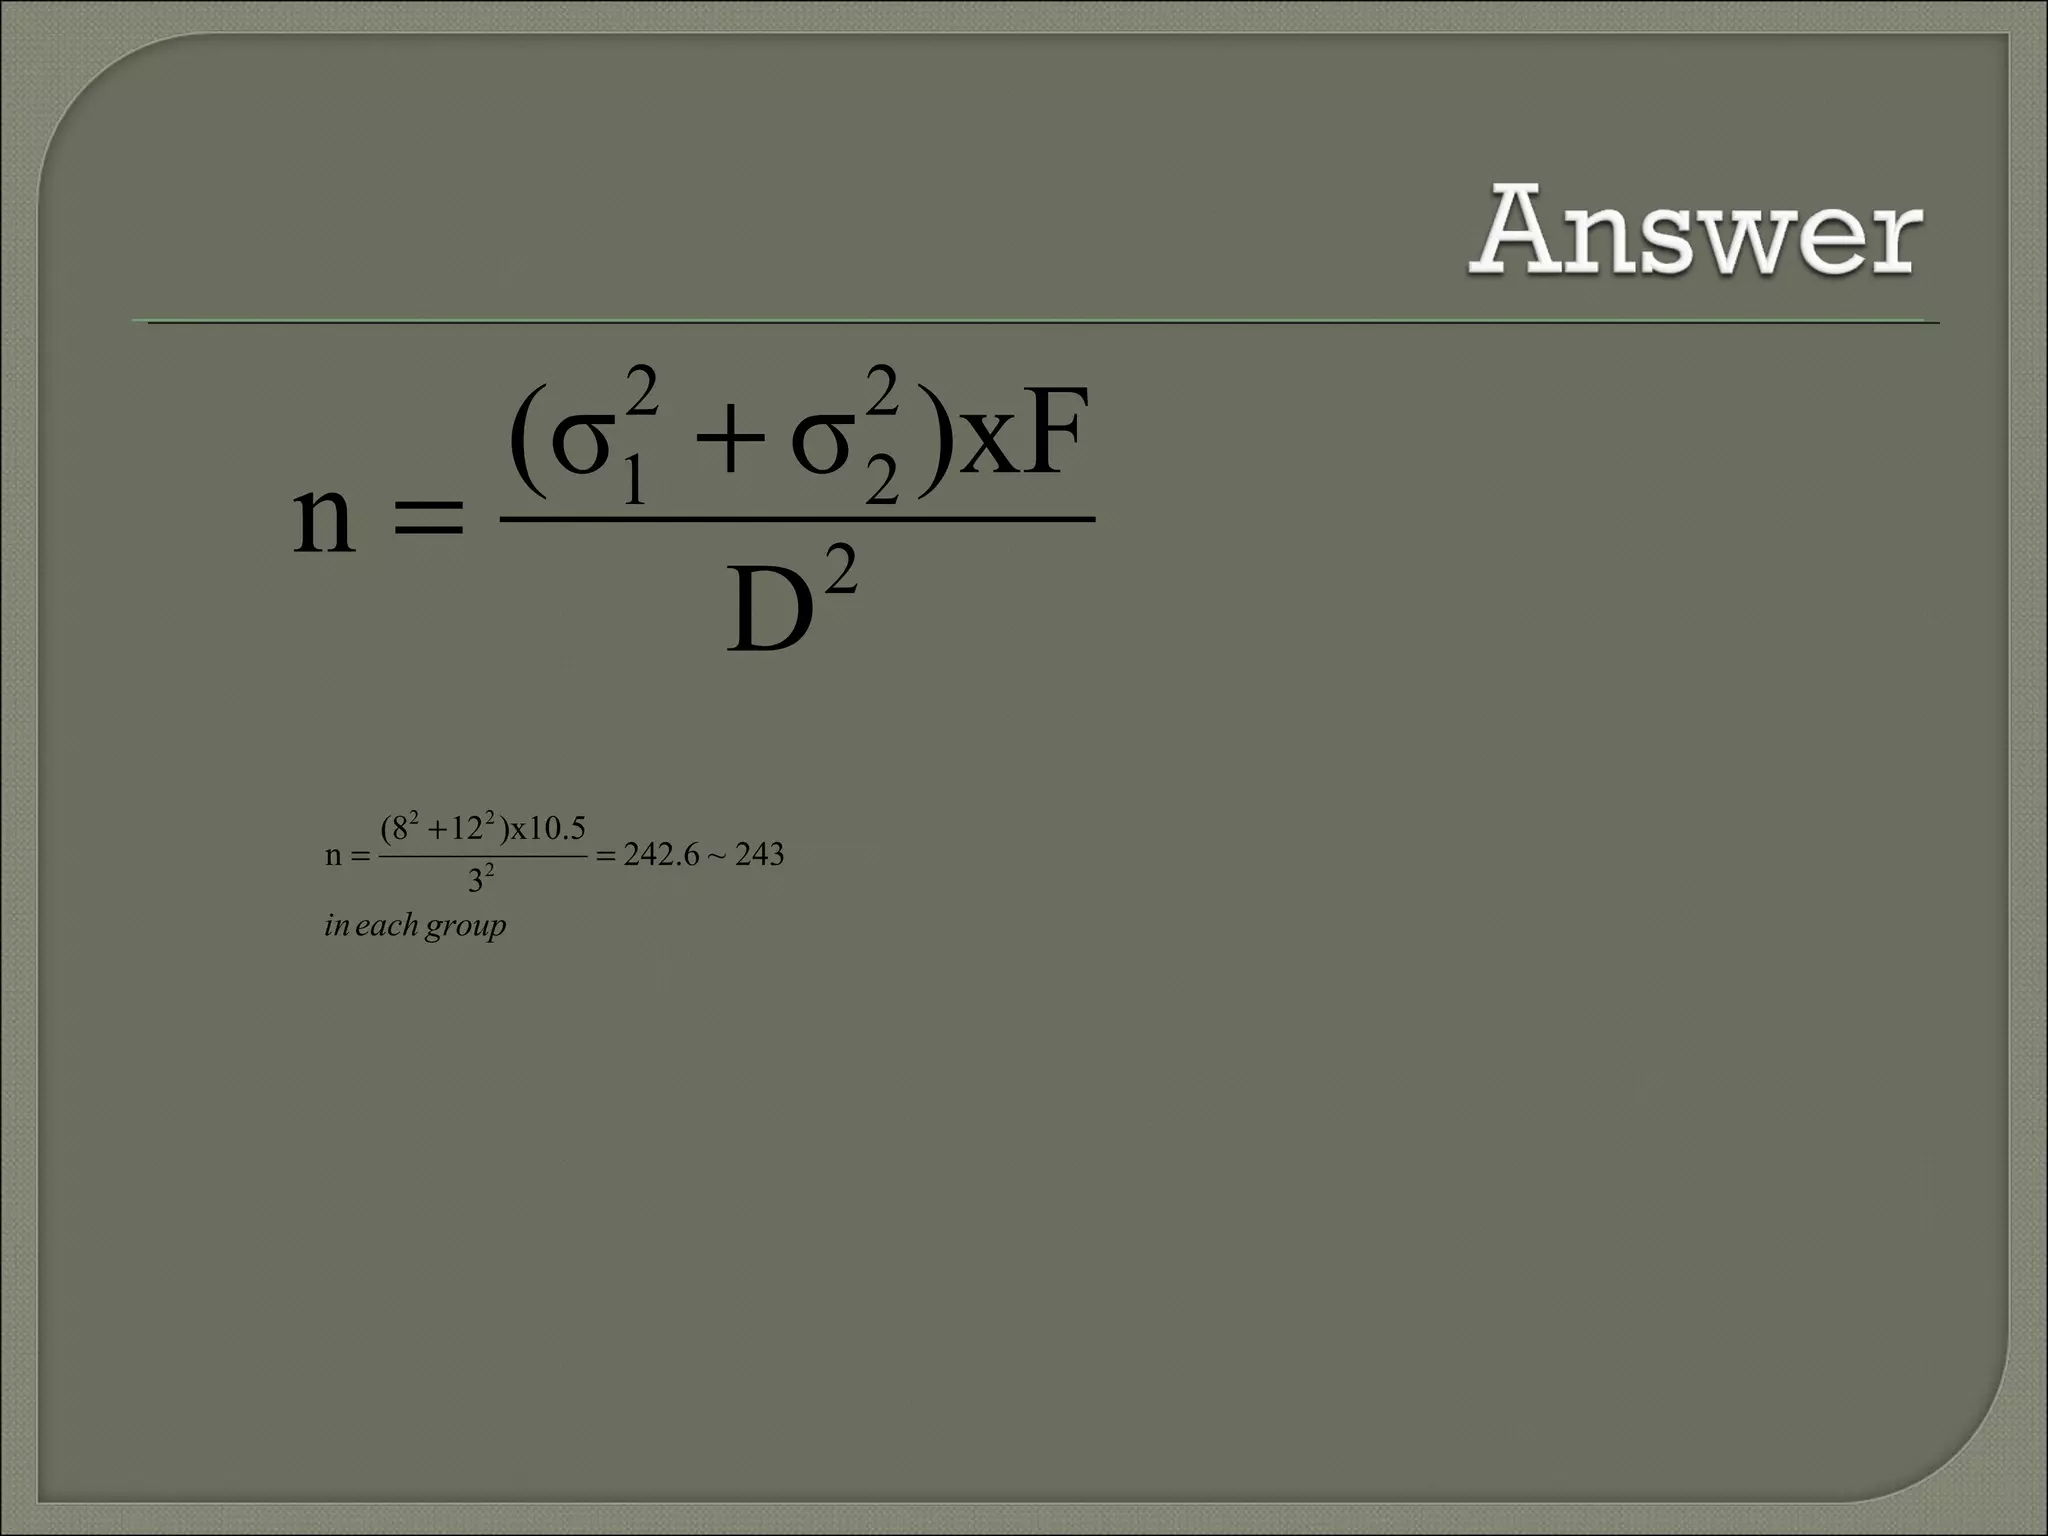
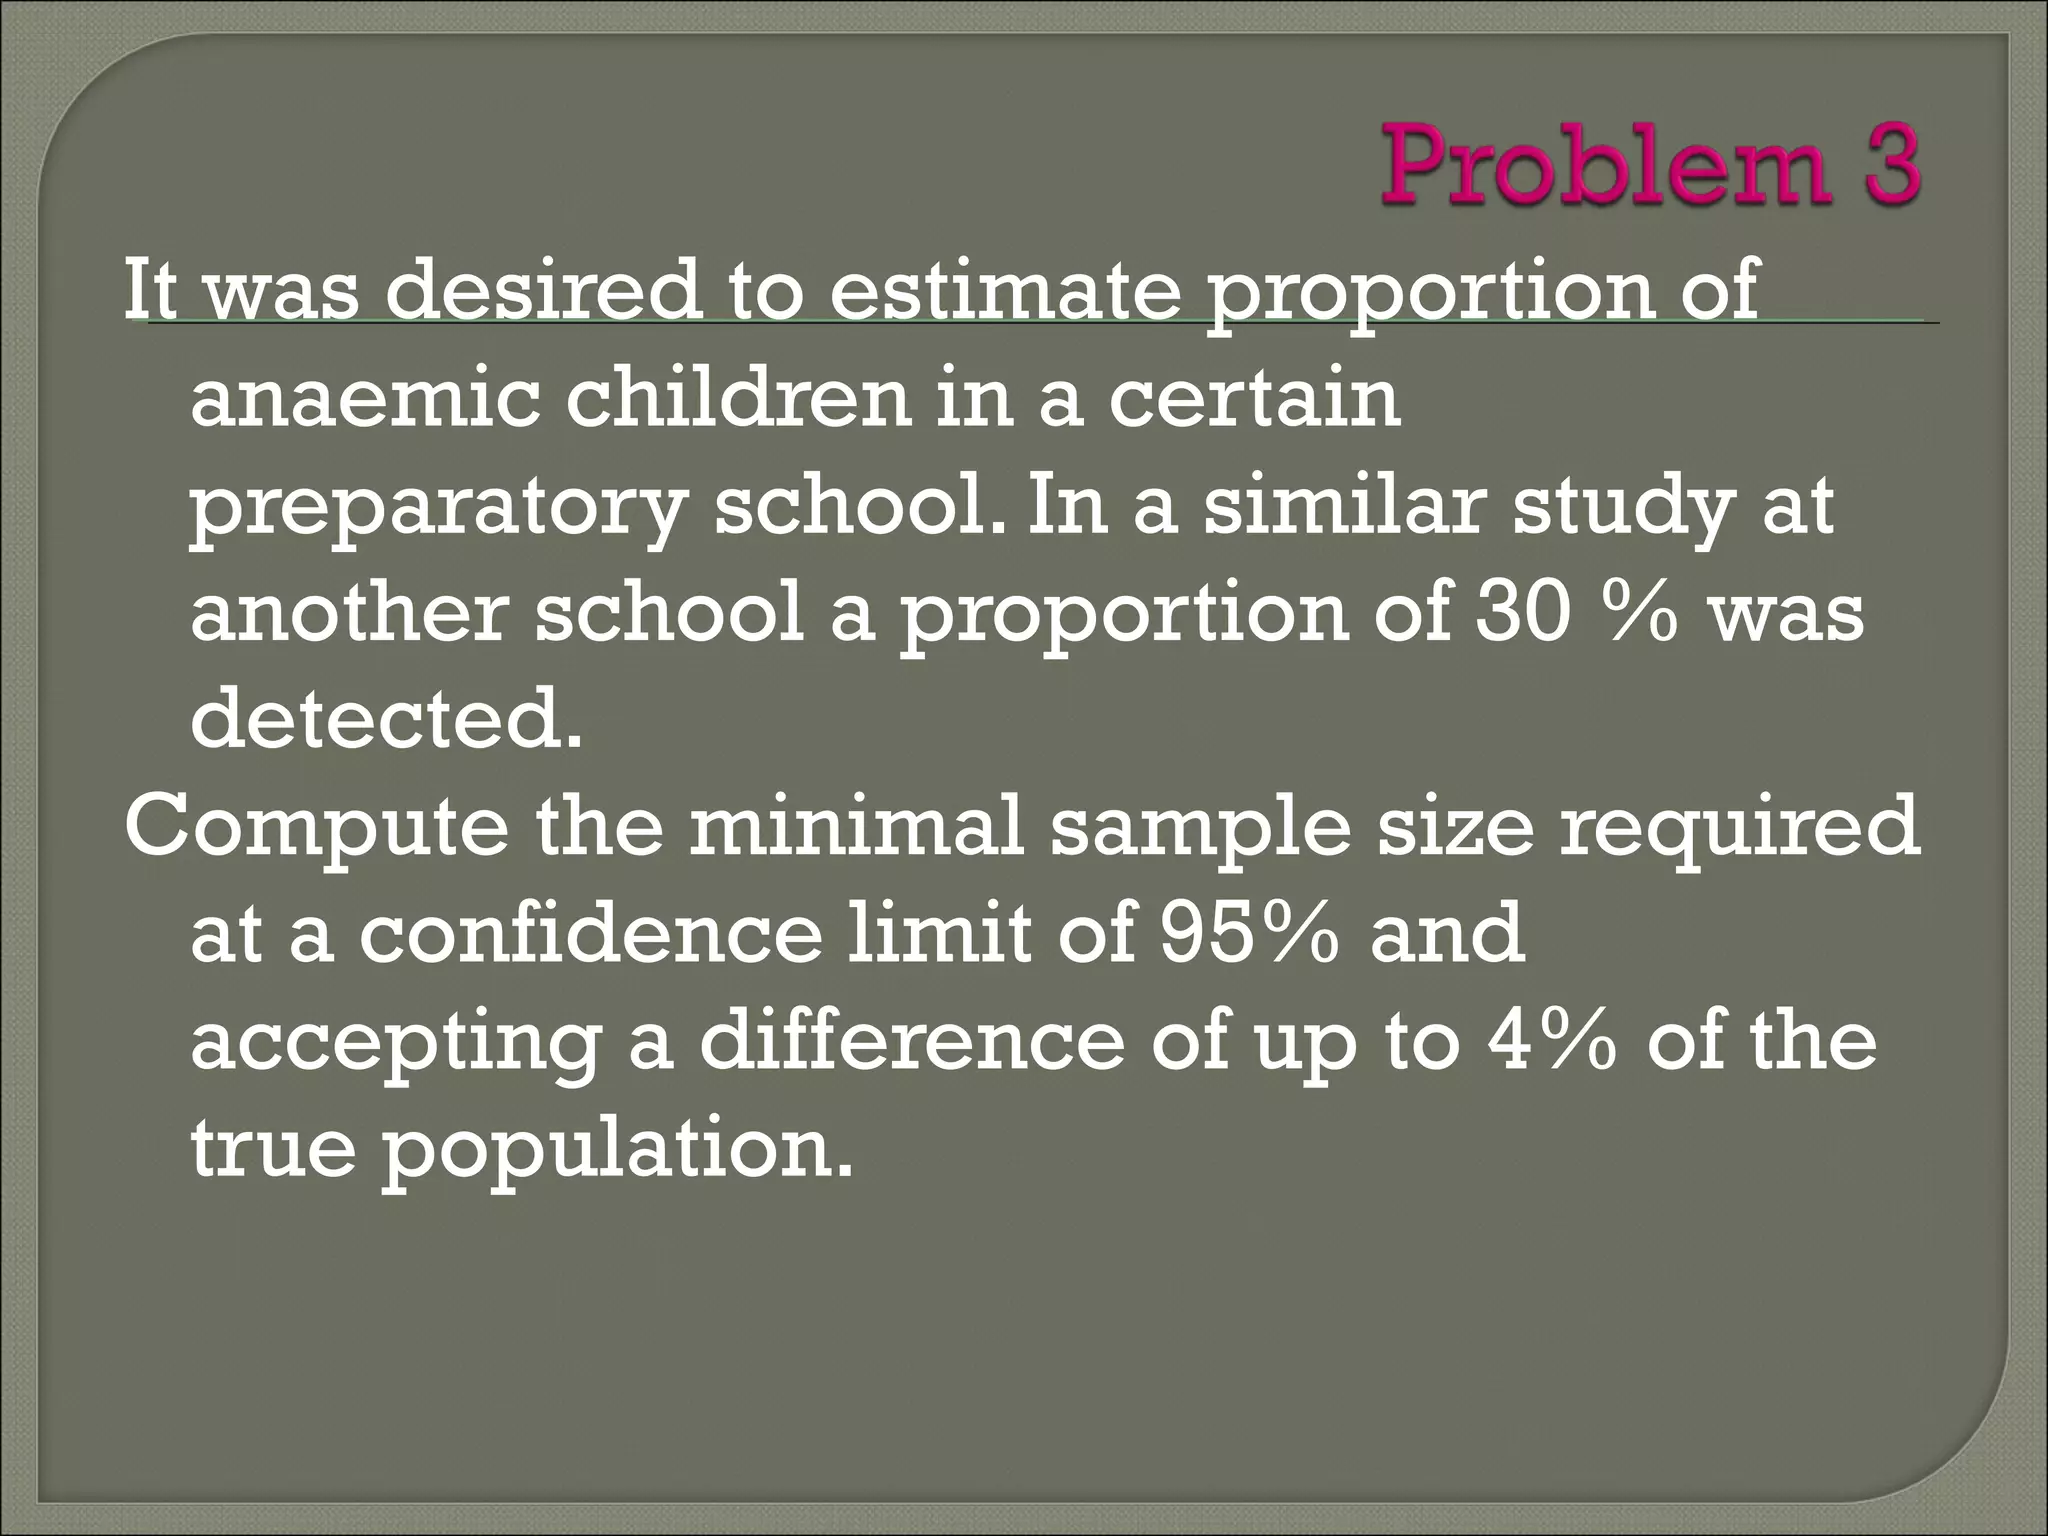
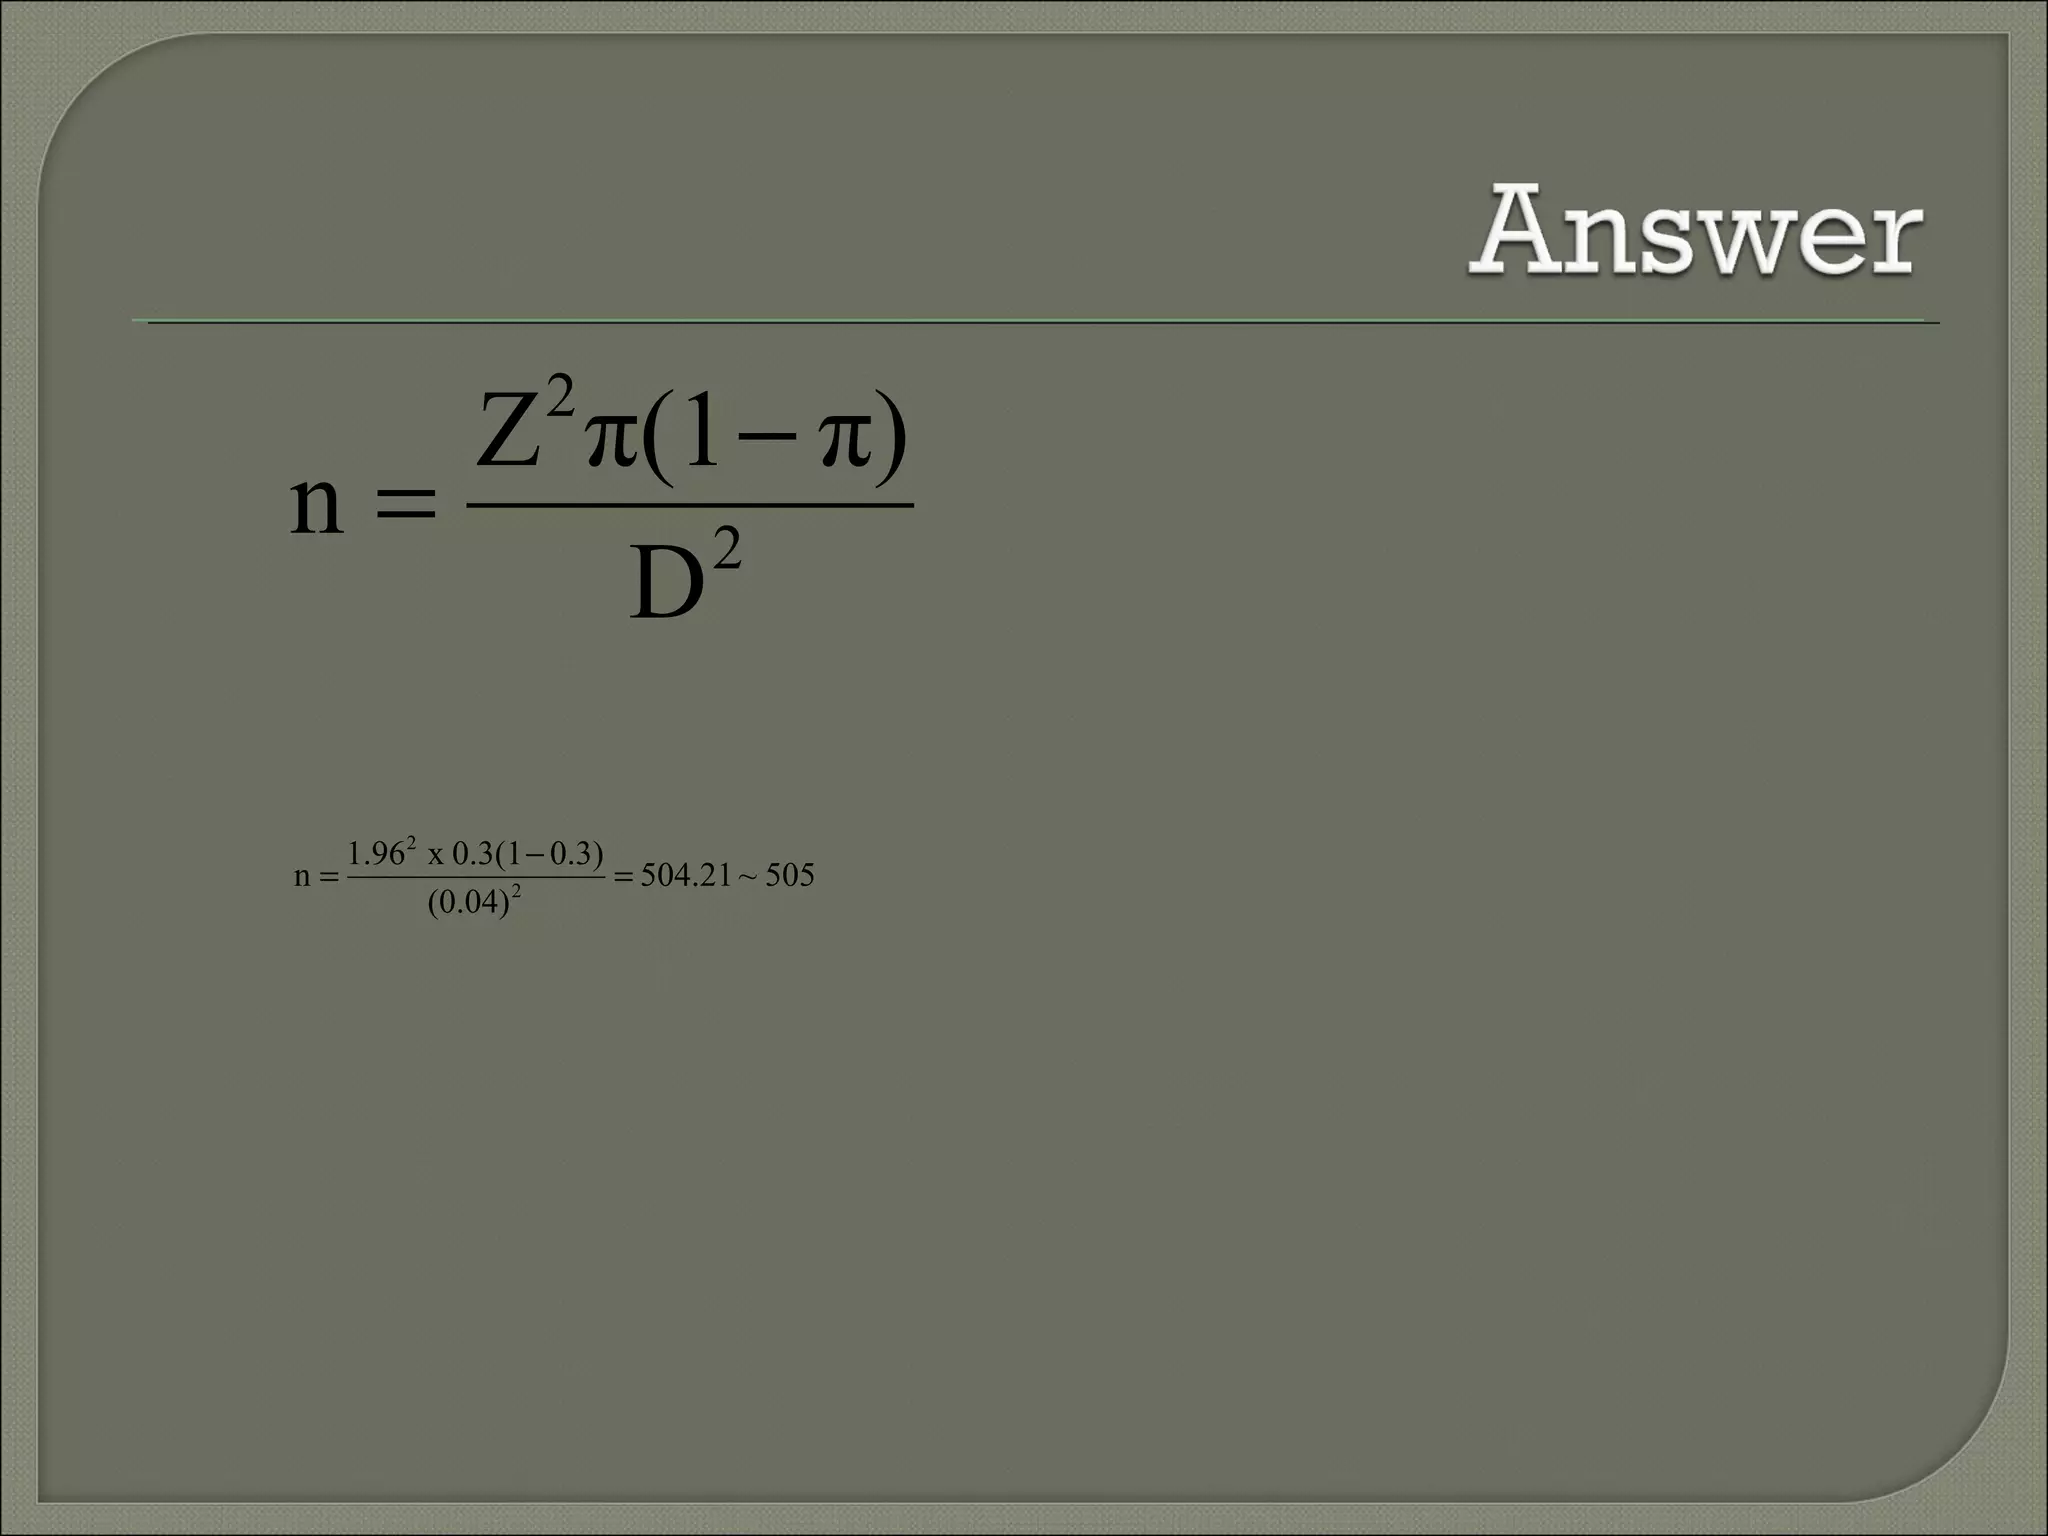
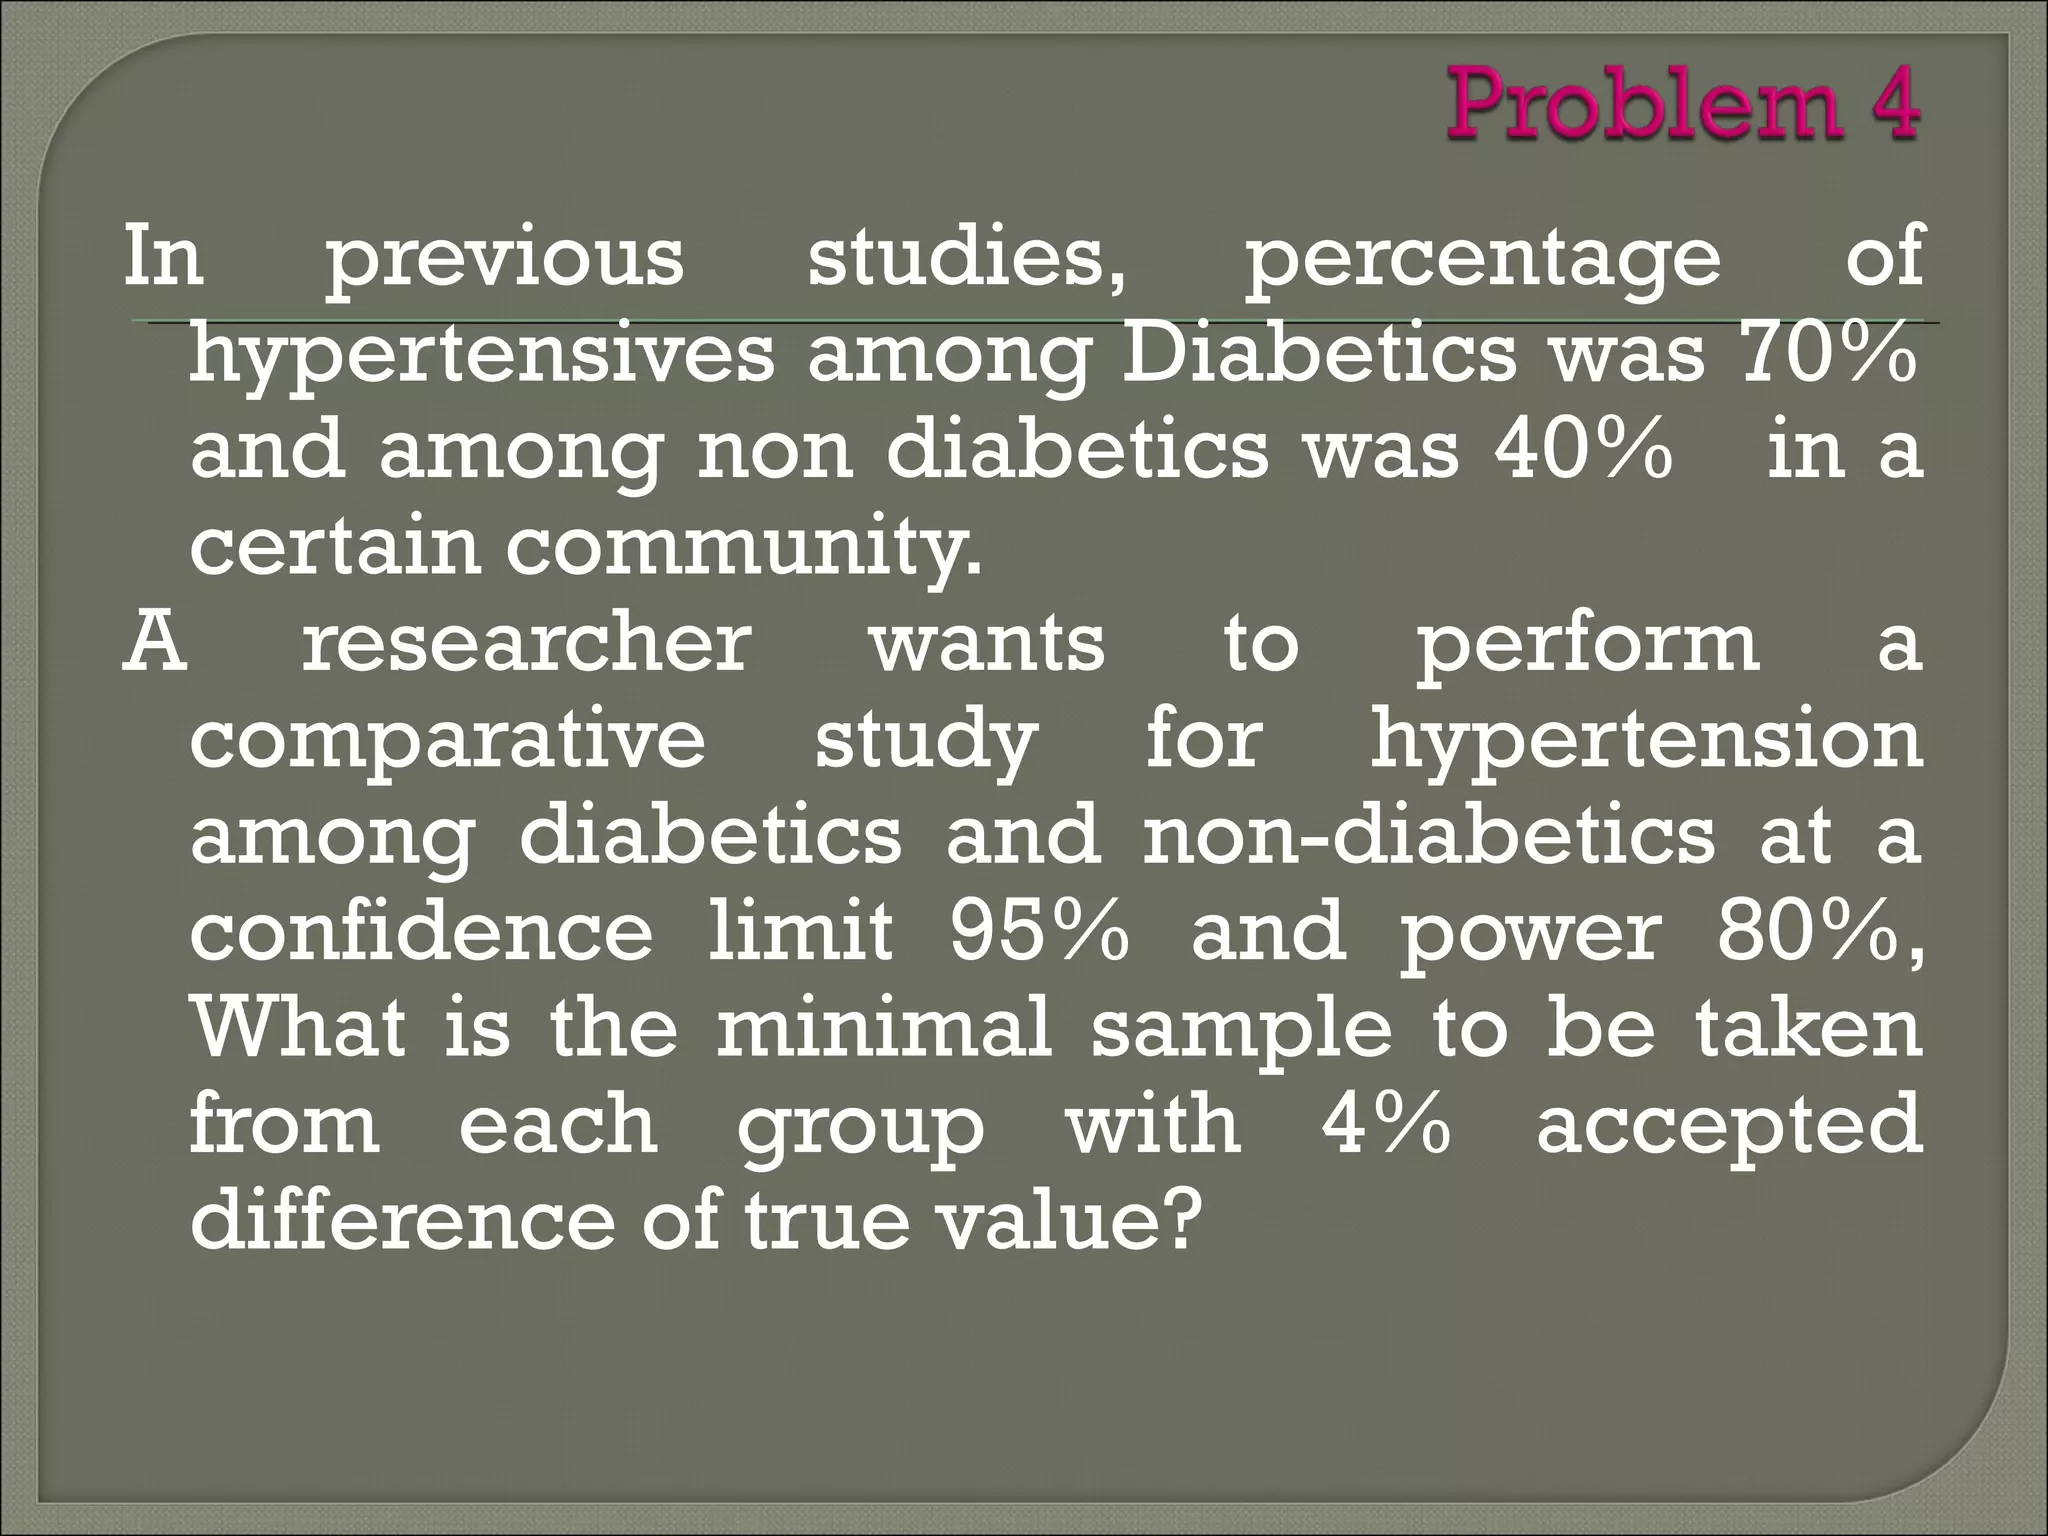

This document discusses key concepts in quantitative techniques related to population, sample, sampling, and sample size calculation. It defines population as the total set of measurements of interest, and sample as a subset of the population. Probability and non-probability sampling methods are described. Probability sampling allows results to be generalized to the population, while non-probability sampling does not. Several probability sampling techniques are explained, including simple random sampling, systematic sampling, stratified sampling, cluster sampling, and multi-stage sampling. The document also covers concepts like sampling error, confidence level, statistical power, and formulas for calculating minimum sample sizes. Sample size determination depends on factors like confidence level, power, expected difference, and standard deviation. Formulas presented can be used


