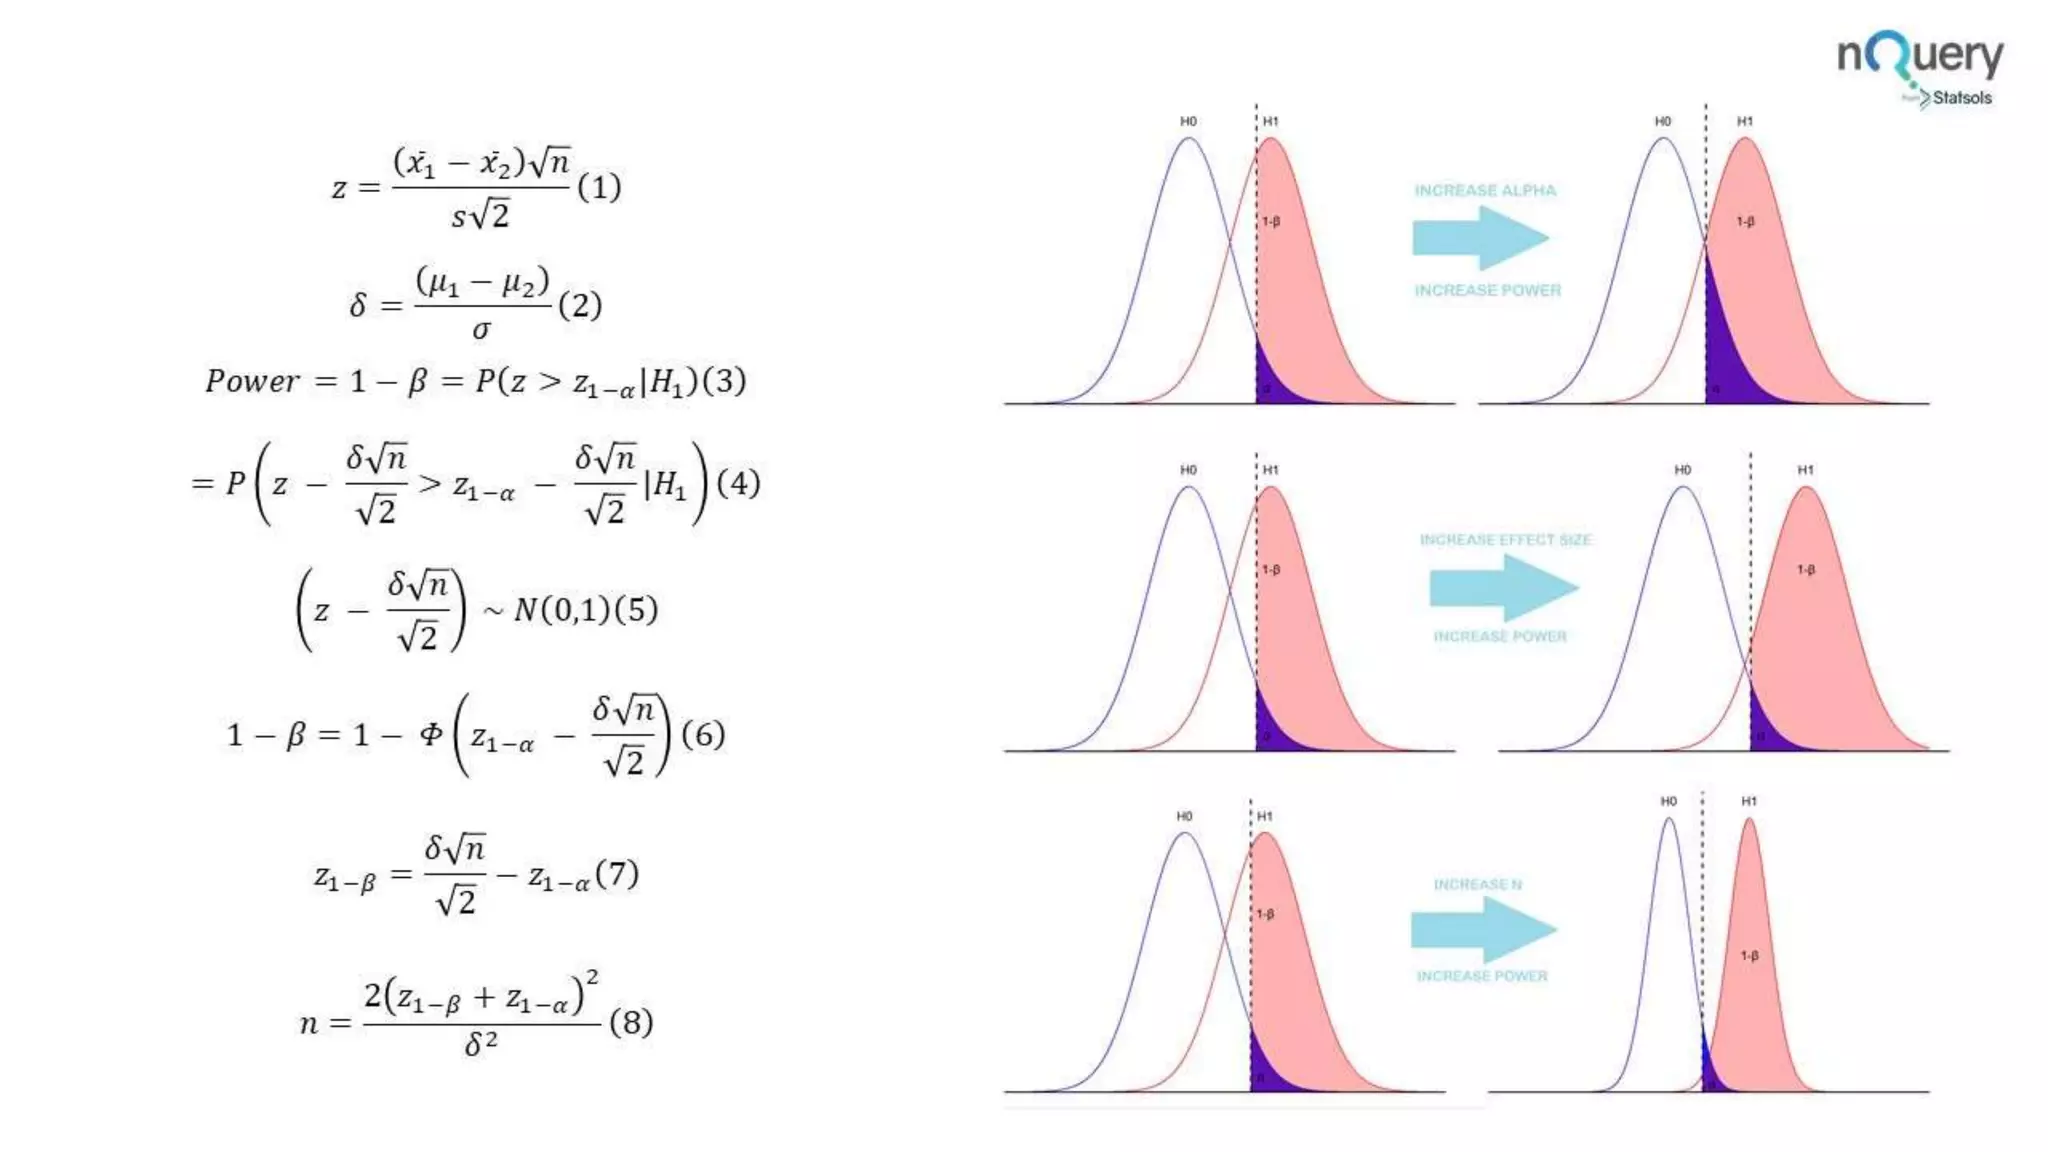
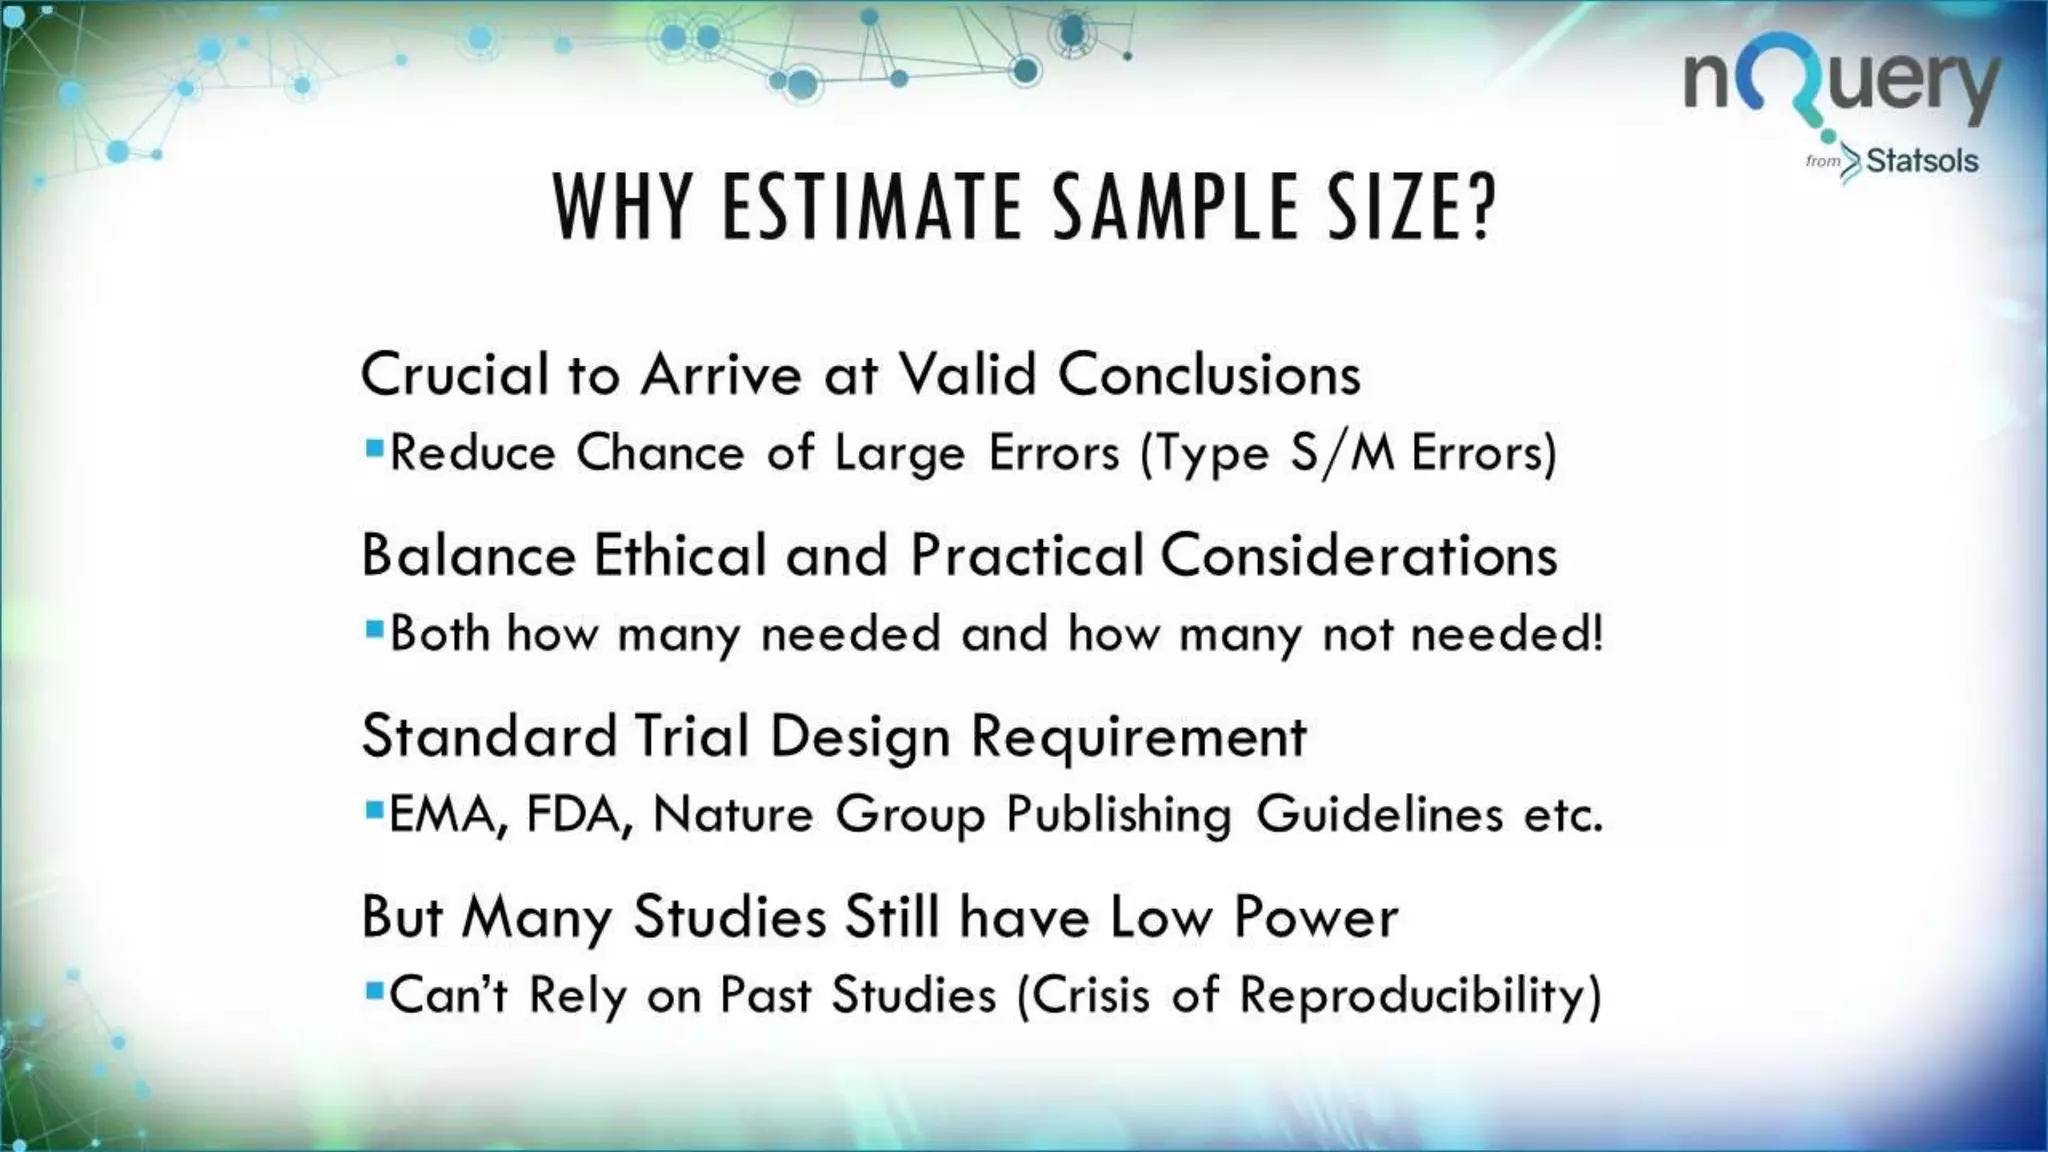
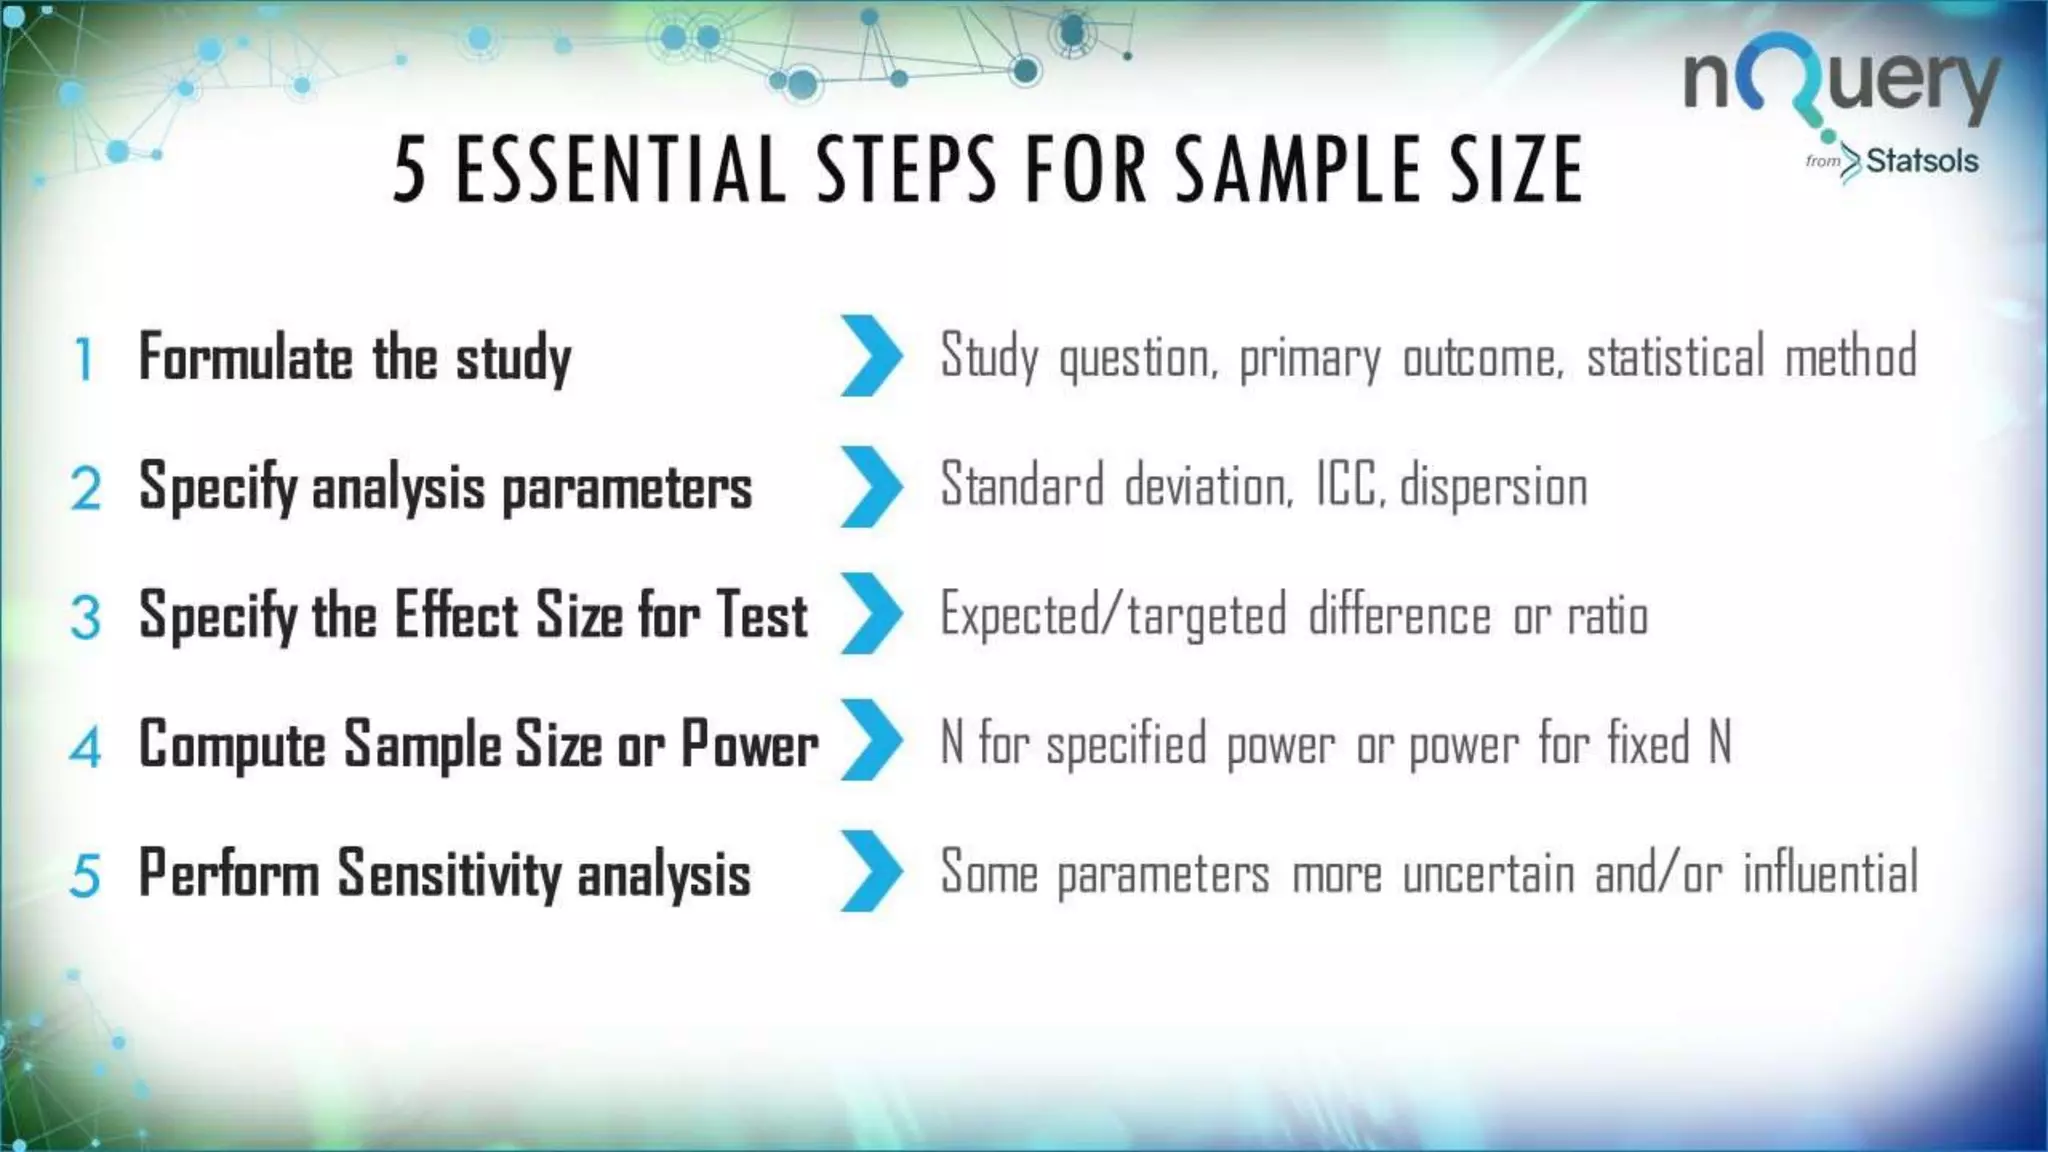
WATCH THE WEBINAR
To watch the webinar,
go to:
http://bit.ly/2thIgmi
HOSTED BY:
Ronan Fitzpatrick
 Head of
Statistics
 FDA Guest
Speaker
 nQuery
Lead
Researcher
 Guest
Lecturer
WEBINAR OVERVIEW – HOST
WEBINAR OVERVIEW – CONTENT
CONTEN
T>
Introducing Sample Size Determination
Bayesian Sample Size Determination
Survival Analysis Demonstration
Introducing nQuery Advanced
Part I
Sample Size
Determination
WHAT IS SAMPLE SIZE
ESTIMATION?
The process for finding the appropriate
sample size for your study.
The most common metric for this is
statistical power
The power is the probability that the
study will be able to detect a true effect
of a specified size.
In other words, Power is the probability of
rejecting the null hypothesis when it is
false
𝑧 =
𝑥1 − 𝑥2 𝑛
𝑠 2
1
𝛿 =
𝜇1 − 𝜇2
𝜎
2
𝑃𝑜𝑤𝑒𝑟 = 1 − 𝛽 = 𝑃 𝑧 > 𝑧1−𝛼 𝐻1 3
= 𝑃 𝑧 −
𝛿 𝑛
2
> 𝑧1−𝛼 −
𝛿 𝑛
2
|𝐻1 4
𝑧 −
𝛿 𝑛
2
~ 𝑁 0,1 5
1 − 𝛽 = 1 − 𝛷 𝑧1−𝛼 −
𝛿 𝑛
2
6
𝑧1−𝛽 =
𝛿 𝑛
2
− 𝑧1−𝛼 7
𝑛 =
2 𝑧1−𝛽 + 𝑧1−𝛼
2
𝛿2
8
WHY ESTIMATE SAMPLE
SIZE?
Crucial to Arrive at Valid Conclusions
Reduce Chance of Large Errors (Type S/M Errors)
Balance Ethical and Practical Considerations
Both how many needed and how many not
needed!
Standard Trial Design Requirement
EMA, FDA, Nature Group Publishing Guidelines
etc.
But Many Studies Still have Low Power
Can’t Rely on Past Studies (Crisis of
5 ESSENTIAL STEPS FOR SAMPLE
SIZE
1 Formulate the study
Study question, primary outcome,
statistical method
2
Specify analysis
parameters
Standard deviation, ICC, dispersion
3
Specify the Effect Size
for Test
Expected/targeted difference or ratio
4
Compute Sample Size
N for specified power or power for
INTRODUCING nQUERY
Over 20 Years of Experience in Sample Size
Determination and Power Analysis for Clinical
Trials
Latest Release had Methods for ~250 Trial
Designs
Used by 45/50 Top Pharma and Biotech
Companies
nQuery’s 20 Years of Success is Based on
1. Being Easy to Use and Accessible to All Users
Part II
Bayesian Sample Size
Determination
BAYESIAN ANALYSIS
Bayesian Analysis continues to grow in
popularity in statistical analysis in clinical trials
Offers ability to integrate domain knowledge
and prior study data for more efficient and
accurate testing
For sample size determination, two broad
schools:
1. Sample Size for Bayesian Methods
2. Bayesian Approaches to Improve Sample Size
BAYESIAN SAMPLE SIZE
1. Sample Size for Bayesian Methods
Sample size for specific values of Bayesian
parameters
e.g. Bayes Factors, Credible Intervals, Posterior
Probability
2. Bayesian Approaches to Improve Sample Size
Integrating Bayesian methods into current
methods to add greater context for parameter
uncertainty
ASSURANCE EXAMPLE
“The outcome variable … is reduction
in CRP after four weeks relative to
baseline, and the principal analysis will
be a one-sided test of superiority at
the 2.5% significance level. The (two)
population variance … is assumed to
be … equal to 0.0625. … the test is
required to have 80% power to detect a
treatment effect of 0.2, leading to a
proposed trial size of n1 = n2 = 25
patients … For the calculation of
assurance, we suppose that the
elicitation of prior information … gives
the mean of 0.2 and variance of
0.0625. If we assume a normal prior
distribution, we can compute
assurances with m = 0:2, v = 0.06 …
Source: Wiley.com
Parameter Value
Significance Level (One-
Sided)
0.05
Prior Mean Difference 0.2
Prior Difference Variance 0.06
Posterior Standard
Deviation
√0.0625=0.25
Sample Size per Group 25
Part III
Survival Analysis
Demonstration
SAMPLE SIZE FOR SURVIVAL
ANALYSIS
Survival Analysis is about the expected
duration of time to an event (e.g. patient death)
Common methods include linear-rank tests and Cox
Regression
Power is related to number of events, not
sample size
Sample Size = Subjects to get no. of events in study
duration
Can Account explicitly for accrual time and
dropout
Can be interested in varying hazards ratio, follow-up
time etc.
SURVIVAL ANALYSIS
EXAMPLE“Using an unstratified log-rank test at
the one-sided 2.5% significance level, a
total of 282 events would allow 92.6%
power to demonstrate a 33% risk
reduction (hazard ratio for
RAD/placebo of about 0.67, as
calculated from an anticipated 50%
increase in median PFS, from 6 months
in placebo arm to 9 months in the
RAD001 arm). With a uniform accrual of
approximately 23 patients per month
over 74 weeks and a minimum follow
up of 39 weeks, a total of 352 patients
would be required to obtain 282 PFS
events, assuming an exponential
progression-free survival distribution
with a median of 6 months in the
Placebo arm and of 9 months in
Source: nejm.org
Parameter Value
Significance Level (One-Sided) 0.025
Placebo Median Survival
(months)
6
Everolimus Median Survival
(months)
9
Hazard Ratio 0.6666
7
Accrual Period (Weeks) 74
Minimum Follow-Up (Weeks) 39
Part IV
Introducing
nQuery Advanced
nQUERY ADVANCED
nQuery Advanced is the leading sample size
and power calculation software used for clinical
trials
Regulatory
Qualification
Just Got Easier
Survival
Analysis
Just Got
Stronger
nQuery
Interface
Just Got
Cleaner
New
Platform
New
Collaboration
What’s new in nQuery Advanced?
17 New Tables Sample Size Assistance Module add-ons & HubIQ/OQ Tools
THANK YOU
•nQuery Advanced will be released
August 2017
•You will automatically be
upgraded to nQuery Advanced if
purchased before then
•Contact sales@statsols.com for
updates, upgrade details and for
any further info

Minimizing Risk In Phase II and III Sample Size Calculation

  • 2.
    WATCH THE WEBINAR Towatch the webinar, go to: http://bit.ly/2thIgmi
  • 3.
    HOSTED BY: Ronan Fitzpatrick Head of Statistics  FDA Guest Speaker  nQuery Lead Researcher  Guest Lecturer WEBINAR OVERVIEW – HOST
  • 4.
    WEBINAR OVERVIEW –CONTENT CONTEN T> Introducing Sample Size Determination Bayesian Sample Size Determination Survival Analysis Demonstration Introducing nQuery Advanced
  • 5.
  • 6.
    WHAT IS SAMPLESIZE ESTIMATION? The process for finding the appropriate sample size for your study. The most common metric for this is statistical power The power is the probability that the study will be able to detect a true effect of a specified size. In other words, Power is the probability of rejecting the null hypothesis when it is false
  • 7.
    𝑧 = 𝑥1 −𝑥2 𝑛 𝑠 2 1 𝛿 = 𝜇1 − 𝜇2 𝜎 2 𝑃𝑜𝑤𝑒𝑟 = 1 − 𝛽 = 𝑃 𝑧 > 𝑧1−𝛼 𝐻1 3 = 𝑃 𝑧 − 𝛿 𝑛 2 > 𝑧1−𝛼 − 𝛿 𝑛 2 |𝐻1 4 𝑧 − 𝛿 𝑛 2 ~ 𝑁 0,1 5 1 − 𝛽 = 1 − 𝛷 𝑧1−𝛼 − 𝛿 𝑛 2 6 𝑧1−𝛽 = 𝛿 𝑛 2 − 𝑧1−𝛼 7 𝑛 = 2 𝑧1−𝛽 + 𝑧1−𝛼 2 𝛿2 8
  • 8.
    WHY ESTIMATE SAMPLE SIZE? Crucialto Arrive at Valid Conclusions Reduce Chance of Large Errors (Type S/M Errors) Balance Ethical and Practical Considerations Both how many needed and how many not needed! Standard Trial Design Requirement EMA, FDA, Nature Group Publishing Guidelines etc. But Many Studies Still have Low Power Can’t Rely on Past Studies (Crisis of
  • 9.
    5 ESSENTIAL STEPSFOR SAMPLE SIZE 1 Formulate the study Study question, primary outcome, statistical method 2 Specify analysis parameters Standard deviation, ICC, dispersion 3 Specify the Effect Size for Test Expected/targeted difference or ratio 4 Compute Sample Size N for specified power or power for
  • 10.
    INTRODUCING nQUERY Over 20Years of Experience in Sample Size Determination and Power Analysis for Clinical Trials Latest Release had Methods for ~250 Trial Designs Used by 45/50 Top Pharma and Biotech Companies nQuery’s 20 Years of Success is Based on 1. Being Easy to Use and Accessible to All Users
  • 11.
    Part II Bayesian SampleSize Determination
  • 12.
    BAYESIAN ANALYSIS Bayesian Analysiscontinues to grow in popularity in statistical analysis in clinical trials Offers ability to integrate domain knowledge and prior study data for more efficient and accurate testing For sample size determination, two broad schools: 1. Sample Size for Bayesian Methods 2. Bayesian Approaches to Improve Sample Size
  • 13.
    BAYESIAN SAMPLE SIZE 1.Sample Size for Bayesian Methods Sample size for specific values of Bayesian parameters e.g. Bayes Factors, Credible Intervals, Posterior Probability 2. Bayesian Approaches to Improve Sample Size Integrating Bayesian methods into current methods to add greater context for parameter uncertainty
  • 14.
    ASSURANCE EXAMPLE “The outcomevariable … is reduction in CRP after four weeks relative to baseline, and the principal analysis will be a one-sided test of superiority at the 2.5% significance level. The (two) population variance … is assumed to be … equal to 0.0625. … the test is required to have 80% power to detect a treatment effect of 0.2, leading to a proposed trial size of n1 = n2 = 25 patients … For the calculation of assurance, we suppose that the elicitation of prior information … gives the mean of 0.2 and variance of 0.0625. If we assume a normal prior distribution, we can compute assurances with m = 0:2, v = 0.06 … Source: Wiley.com Parameter Value Significance Level (One- Sided) 0.05 Prior Mean Difference 0.2 Prior Difference Variance 0.06 Posterior Standard Deviation √0.0625=0.25 Sample Size per Group 25
  • 15.
  • 16.
    SAMPLE SIZE FORSURVIVAL ANALYSIS Survival Analysis is about the expected duration of time to an event (e.g. patient death) Common methods include linear-rank tests and Cox Regression Power is related to number of events, not sample size Sample Size = Subjects to get no. of events in study duration Can Account explicitly for accrual time and dropout Can be interested in varying hazards ratio, follow-up time etc.
  • 17.
    SURVIVAL ANALYSIS EXAMPLE“Using anunstratified log-rank test at the one-sided 2.5% significance level, a total of 282 events would allow 92.6% power to demonstrate a 33% risk reduction (hazard ratio for RAD/placebo of about 0.67, as calculated from an anticipated 50% increase in median PFS, from 6 months in placebo arm to 9 months in the RAD001 arm). With a uniform accrual of approximately 23 patients per month over 74 weeks and a minimum follow up of 39 weeks, a total of 352 patients would be required to obtain 282 PFS events, assuming an exponential progression-free survival distribution with a median of 6 months in the Placebo arm and of 9 months in Source: nejm.org Parameter Value Significance Level (One-Sided) 0.025 Placebo Median Survival (months) 6 Everolimus Median Survival (months) 9 Hazard Ratio 0.6666 7 Accrual Period (Weeks) 74 Minimum Follow-Up (Weeks) 39
  • 18.
  • 19.
    nQUERY ADVANCED nQuery Advancedis the leading sample size and power calculation software used for clinical trials Regulatory Qualification Just Got Easier Survival Analysis Just Got Stronger nQuery Interface Just Got Cleaner New Platform New Collaboration What’s new in nQuery Advanced? 17 New Tables Sample Size Assistance Module add-ons & HubIQ/OQ Tools
  • 20.
    THANK YOU •nQuery Advancedwill be released August 2017 •You will automatically be upgraded to nQuery Advanced if purchased before then •Contact sales@statsols.com for updates, upgrade details and for any further info

Editor's Notes

  • #3 Appropriate would usually be defined in terms of preventing too low sample size, though too high has practical costs. Other metrics include confidence interval width (precision), cost based and Bayesian methods. Important to note that you need to specify an exact value for the effect even though alternative hypothesis acceptance space can technically can be any non-null hypothesis point value (commonly any non-zero value) Can be though of as the area of the alternative pdf which is contained within the rejection region of the null hypothesis. Interesting to note that power of 50% is equivalent to lower limit of CI being equal to zero for zero-based z-statistic null
  • #7 Appropriate would usually be defined in terms of preventing too low sample size, though too high has practical costs. Other metrics include confidence interval width (precision), cost based and Bayesian methods. Important to note that you need to specify an exact value for the effect even though alternative hypothesis acceptance space can technically can be any non-null hypothesis point value (commonly any non-zero value) Can be though of as the area of the alternative pdf which is contained within the rejection region of the null hypothesis. Interesting to note that power of 50% is equivalent to lower limit of CI being equal to zero for zero-based z-statistic null
  • #9 Point 1: http://rsos.royalsocietypublishing.org/content/1/3/140216 -> Screening problem analogy. Type S Error = Sign Error i.e. sign of estimate is different than actual population value Type M Error = Magnitude Error i.e. estimate is order of magnitude different than actual value Point 2: Know we have only 100 subjects available. Need to know what power will this give us, i.e. is there enough power to justify even doing the study. Stage III clinical trials constitute 90% of trial costs, vital to reduce waste and ensure can fulfil goal. Point 3: Sample Size requirements described in ICH Efficacy Guidelines 9: STATISTICAL PRINCIPLES FOR CLINICAL TRIALS See FDA/NIH draft protocol template here: http://osp.od.nih.gov/sites/default/files/Protocol_Template_05Feb2016_508.pdf (Section 10.5) Nature Statistical Checklist: http://www.nature.com/nature/authors/gta/Statistical_checklist.doc Point 4: In Cohen’s (1962) seminal power analysis of the journal of Abnormal and Social Psychology he concluded that over half of the published studies were insufficiently powered to result in statistical significance for the main hypothesis. Many journals (e.g. Nature) now require that authors submit power estimates for their studies. Power/Sample size one of areas highlighted when discussing “crisis of reproducibility” (Ioannidis). Relatively easy fix compared to finding p-hacking etc.
  • #10 More detail available on our website via a whitepaper.
  • #14 Alternative linear rank tests include Tahone-Ware, Gehan. Planned for next release circa. Summer 2016. Sample size mainly asking “How many subjects needed to attain X events?” Most methods optimised for exponential survival but could enter piece-wise linear approximation of probability at time t for other distributions (e.g. Weibull) Analytic vs Simulation = Much wider debate. Usually have ease of use vs flexibility trade-off. Simulation better suited to programming environment e.g. R
  • #17 Alternative linear rank tests include Tahone-Ware, Gehan. Planned for next release circa. Summer 2016. Sample size mainly asking “How many subjects needed to attain X events?” Most methods optimised for exponential survival but could enter piece-wise linear approximation of probability at time t for other distributions (e.g. Weibull) Analytic vs Simulation = Much wider debate. Usually have ease of use vs flexibility trade-off. Simulation better suited to programming environment e.g. R
  • #20 Alternative linear rank tests include Tahone-Ware, Gehan. Planned for next release circa. Summer 2016. Sample size mainly asking “How many subjects needed to attain X events?” Most methods optimised for exponential survival but could enter piece-wise linear approximation of probability at time t for other distributions (e.g. Weibull) Analytic vs Simulation = Much wider debate. Usually have ease of use vs flexibility trade-off. Simulation better suited to programming environment e.g. R