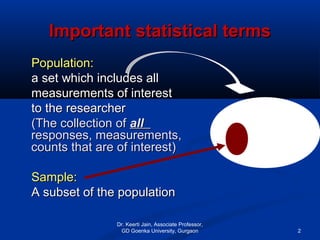
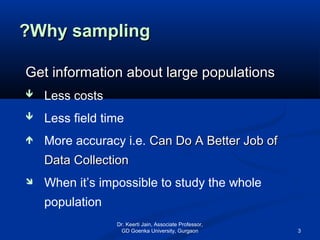
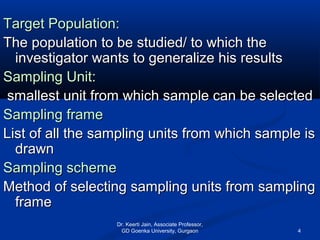
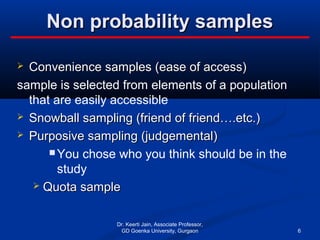
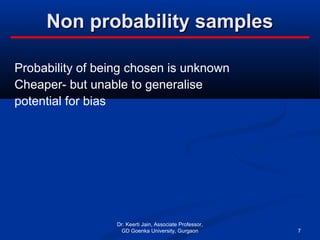
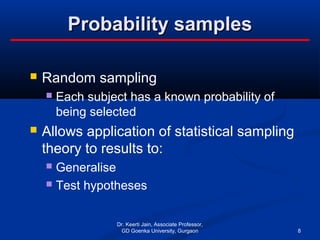
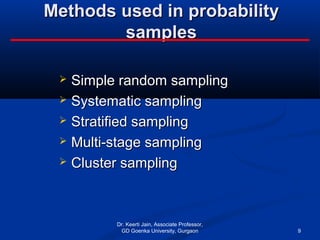
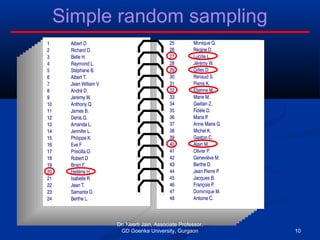
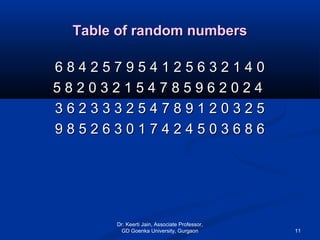
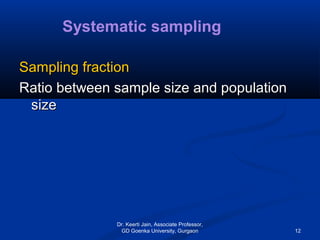
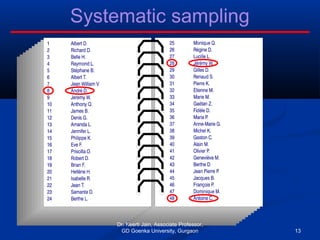
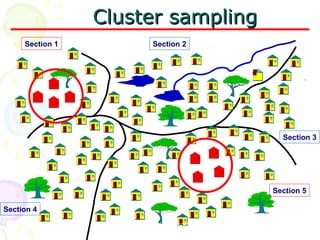
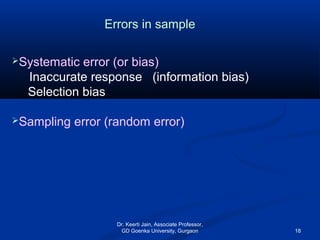
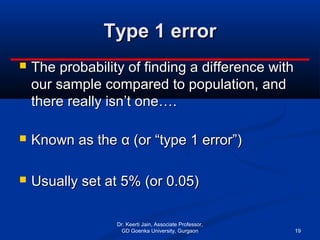
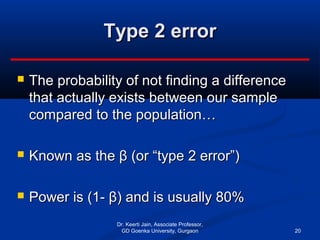
Dr. Keerti Jain
Important statistical termsImportant statistical terms
Population:Population:
a set which includes alla set which includes all
measurements of interestmeasurements of interest
to the researcherto the researcher
(The collection of(The collection of allall
responses, measurements,responses, measurements, oror
counts that are of interest)counts that are of interest)
Sample:Sample:
A subset of the populationA subset of the population
Dr. Keerti Jain, Associate Professor,
GD Goenka University, Gurgaon 2
Why samplingWhy sampling??
Get information about large populationsGet information about large populations
 Less costs
 Less field time
 More accuracy i.e. Can Do A Better Job ofCan Do A Better Job of
Data CollectionData Collection
 When it’s impossible to study the whole
population
Dr. Keerti Jain, Associate Professor,
GD Goenka University, Gurgaon 3
Target Population:Target Population:
The population to be studied/ to which theThe population to be studied/ to which the
investigator wants to generalize his resultsinvestigator wants to generalize his results
Sampling Unit:Sampling Unit:
smallest unit from which sample can be selectedsmallest unit from which sample can be selected
Sampling frameSampling frame
List of all the sampling units from which sample isList of all the sampling units from which sample is
drawndrawn
Sampling schemeSampling scheme
Method of selecting sampling units from samplingMethod of selecting sampling units from sampling
frameframe
Dr. Keerti Jain, Associate Professor,
GD Goenka University, Gurgaon 4
Types of samplingTypes of sampling
 Non-probability samples
 Probability samples
Dr. Keerti Jain, Associate Professor,
GD Goenka University, Gurgaon 5
Non probability samplesNon probability samples
 Convenience samples (ease of access)Convenience samples (ease of access)
sample is selected from elements of a population
that are easily accessible
 Snowball sampling (friend of friend….etc.)Snowball sampling (friend of friend….etc.)
 Purposive sampling (judgemental)Purposive sampling (judgemental)
 You chose who you think should be in the
study
 Quota sampleQuota sample
Dr. Keerti Jain, Associate Professor,
GD Goenka University, Gurgaon 6
Non probability samplesNon probability samples
Probability of being chosen is unknown
Cheaper- but unable to generalise
potential for bias
Dr. Keerti Jain, Associate Professor,
GD Goenka University, Gurgaon 7
Probability samplesProbability samples
 Random sampling
 Each subject has a known probability of
being selected
 Allows application of statistical sampling
theory to results to:
 Generalise
 Test hypotheses
Dr. Keerti Jain, Associate Professor,
GD Goenka University, Gurgaon 8
Methods used in probabilityMethods used in probability
samplessamples
 Simple random samplingSimple random sampling
 Systematic samplingSystematic sampling
 Stratified samplingStratified sampling
 Multi-stage samplingMulti-stage sampling
 Cluster samplingCluster sampling
Dr. Keerti Jain, Associate Professor,
GD Goenka University, Gurgaon 9
Simple random sampling
Dr. Keerti Jain, Associate Professor,
GD Goenka University, Gurgaon 10
Table of random numbersTable of random numbers
6 8 4 2 5 7 9 5 4 1 2 5 6 3 2 1 4 06 8 4 2 5 7 9 5 4 1 2 5 6 3 2 1 4 0
5 8 2 0 3 2 1 5 4 7 8 5 9 6 2 0 2 45 8 2 0 3 2 1 5 4 7 8 5 9 6 2 0 2 4
3 6 2 3 3 3 2 5 4 7 8 9 1 2 0 3 2 53 6 2 3 3 3 2 5 4 7 8 9 1 2 0 3 2 5
9 8 5 2 6 3 0 1 7 4 2 4 5 0 3 6 8 69 8 5 2 6 3 0 1 7 4 2 4 5 0 3 6 8 6
Dr. Keerti Jain, Associate Professor,
GD Goenka University, Gurgaon 11
Sampling fractionSampling fraction
Ratio between sample size and populationRatio between sample size and population
sizesize
Systematic sampling
Dr. Keerti Jain, Associate Professor,
GD Goenka University, Gurgaon 12
Systematic sampling
Dr. Keerti Jain, Associate Professor,
GD Goenka University, Gurgaon 13
Cluster samplingCluster sampling
Cluster: a group of sampling units close to each
other i.e. crowding together in the same area or
neighborhood
Dr. Keerti Jain, Associate Professor,
GD Goenka University, Gurgaon 14
Cluster samplingCluster sampling
Section 4
Section 5
Section 3
Section 2Section 1
Dr. Keerti Jain, Associate
Professor, GD Goenka
15
 Stratified samplingStratified sampling
 Multi-stage samplingMulti-stage sampling
Dr. Keerti Jain, Associate Professor,
GD Goenka University, Gurgaon 16
ConclusionsConclusions
 Probability samples are the best
 Ensure
 Representativeness
 Precision
Dr. Keerti Jain, Associate Professor,
GD Goenka University, Gurgaon 17
Systematic error (or bias)
Inaccurate response (information bias)
Selection bias
Sampling error (random error)
Errors in sample
Dr. Keerti Jain, Associate Professor,
GD Goenka University, Gurgaon 18
Type 1 errorType 1 error
 The probability of finding a difference withThe probability of finding a difference with
our sample compared to population, andour sample compared to population, and
there really isn’t one….there really isn’t one….
 Known as theKnown as the αα (or “type 1 error”)(or “type 1 error”)
 Usually set at 5% (or 0.05)Usually set at 5% (or 0.05)
Dr. Keerti Jain, Associate Professor,
GD Goenka University, Gurgaon 19
Type 2 errorType 2 error
 The probability of not finding a differenceThe probability of not finding a difference
that actually exists between our samplethat actually exists between our sample
compared to the population…compared to the population…
 Known as the β (or “type 2 error”)Known as the β (or “type 2 error”)
 Power is (1- β) and is usually 80%Power is (1- β) and is usually 80%
Dr. Keerti Jain, Associate Professor,
GD Goenka University, Gurgaon 20
Types of StudiesTypes of Studies
QualitativeQualitative
•Calculating the proportionCalculating the proportion
•Calculating the difference of proportionsCalculating the difference of proportions
QuantitativeQuantitative
Calculating the meanCalculating the mean
Calculating the difference in meanCalculating the difference in mean
Dr. Keerti Jain, Associate Professor,
GD Goenka University, Gurgaon 21
Sample size
Quantitative Qualitative
2D
2σ2Z
n =
2
2
2
2
1
D
)xFσ(σ
n
+
=
2
2
D
π)π(1Z
n
−
=
2
D
F)P-(1P2
n =
Dr. Keerti Jain, Associate Professor,
GD Goenka University, Gurgaon 22
Problem 1Problem 1
A study is to be performed to determine aA study is to be performed to determine a
certain parameter in a community. From acertain parameter in a community. From a
previous study a sd of 46 was obtained.previous study a sd of 46 was obtained.
If a sample error of up to 4 is to beIf a sample error of up to 4 is to be
accepted. How many subjects should beaccepted. How many subjects should be
included in this study at 99% level ofincluded in this study at 99% level of
confidence?confidence?
Dr. Keerti Jain, Associate Professor,
GD Goenka University, Gurgaon 23
AnswerAnswer
881~3.880
24
246x22.58
n ==
2D
2σ2Z
n =
Dr. Keerti Jain, Associate Professor,
GD Goenka University, Gurgaon 24
Problem 2Problem 2
 A study is to be done to determine effectA study is to be done to determine effect
of 2 drugs (A and B) on blood glucoseof 2 drugs (A and B) on blood glucose
level. From previous studies using thoselevel. From previous studies using those
drugs, Sd of BGL of 8 and 12 g/dl weredrugs, Sd of BGL of 8 and 12 g/dl were
obtained respectively.obtained respectively.
 A significant level of 95% and a power ofA significant level of 95% and a power of
90% is required to detect a mean90% is required to detect a mean
difference between the two groups of 3difference between the two groups of 3
g/dl. How many subjects should be includeg/dl. How many subjects should be include
in each group?in each group?
Dr. Keerti Jain, Associate Professor,
GD Goenka University, Gurgaon 25
AnswerAnswer
groupeachin
243~6.242
3
)x10.512(8
n 2
22
=
+
=
2
2
2
2
1
D
)xFσ(σ
n
+
=
Dr. Keerti Jain, Associate Professor,
GD Goenka University, Gurgaon 26
Problem 3Problem 3
It was desired to estimate proportion ofIt was desired to estimate proportion of
anaemic children in a certain preparatoryanaemic children in a certain preparatory
school. In a similar study at another schoolschool. In a similar study at another school
a proportion of 30 % was detected.a proportion of 30 % was detected.
Compute the minimal sample size requiredCompute the minimal sample size required
at a confidence limit of 95% and acceptingat a confidence limit of 95% and accepting
a difference of up to 4% of the truea difference of up to 4% of the true
population.population.
Dr. Keerti Jain, Associate Professor,
GD Goenka University, Gurgaon 27
AnswerAnswer
505~21.504
(0.04)
0.3)0.3(1x1.96
n 2
2
=
−
=
2
2
D
π)π(1Z
n
−
=
Dr. Keerti Jain, Associate Professor,
GD Goenka University, Gurgaon 28
Problem 4Problem 4
In previous studies, percentage ofIn previous studies, percentage of
hypertensives among Diabetics was 70%hypertensives among Diabetics was 70%
and among non diabetics was 40%and among non diabetics was 40% in ain a
certain community.certain community.
A researcher wants to perform aA researcher wants to perform a
comparative study for hypertensioncomparative study for hypertension
among diabetics and non-diabetics at aamong diabetics and non-diabetics at a
confidence limit 95% and power 80%,confidence limit 95% and power 80%,
What is the minimal sample to be takenWhat is the minimal sample to be taken
from each group with 4% acceptedfrom each group with 4% accepted
difference of true value?difference of true value?
Dr. Keerti Jain, Associate Professor,
GD Goenka University, Gurgaon 29
AnswerAnswer
2.2413
0.04
x7.80.55)-(10.55x2
n 2
==
2
D
F)P-(1P2
n =
Dr. Keerti Jain, Associate Professor,
GD Goenka University, Gurgaon 30
Precision
Cost
Dr. Keerti Jain, Associate Professor,
GD Goenka University, Gurgaon 31
Dr. Keerti Jain, Associate Professor,
GD Goenka University, Gurgaon 32

Sampling techniques and size

  • 1.
  • 2.
    Important statistical termsImportantstatistical terms Population:Population: a set which includes alla set which includes all measurements of interestmeasurements of interest to the researcherto the researcher (The collection of(The collection of allall responses, measurements,responses, measurements, oror counts that are of interest)counts that are of interest) Sample:Sample: A subset of the populationA subset of the population Dr. Keerti Jain, Associate Professor, GD Goenka University, Gurgaon 2
  • 3.
    Why samplingWhy sampling?? Getinformation about large populationsGet information about large populations  Less costs  Less field time  More accuracy i.e. Can Do A Better Job ofCan Do A Better Job of Data CollectionData Collection  When it’s impossible to study the whole population Dr. Keerti Jain, Associate Professor, GD Goenka University, Gurgaon 3
  • 4.
    Target Population:Target Population: Thepopulation to be studied/ to which theThe population to be studied/ to which the investigator wants to generalize his resultsinvestigator wants to generalize his results Sampling Unit:Sampling Unit: smallest unit from which sample can be selectedsmallest unit from which sample can be selected Sampling frameSampling frame List of all the sampling units from which sample isList of all the sampling units from which sample is drawndrawn Sampling schemeSampling scheme Method of selecting sampling units from samplingMethod of selecting sampling units from sampling frameframe Dr. Keerti Jain, Associate Professor, GD Goenka University, Gurgaon 4
  • 5.
    Types of samplingTypesof sampling  Non-probability samples  Probability samples Dr. Keerti Jain, Associate Professor, GD Goenka University, Gurgaon 5
  • 6.
    Non probability samplesNonprobability samples  Convenience samples (ease of access)Convenience samples (ease of access) sample is selected from elements of a population that are easily accessible  Snowball sampling (friend of friend….etc.)Snowball sampling (friend of friend….etc.)  Purposive sampling (judgemental)Purposive sampling (judgemental)  You chose who you think should be in the study  Quota sampleQuota sample Dr. Keerti Jain, Associate Professor, GD Goenka University, Gurgaon 6
  • 7.
    Non probability samplesNonprobability samples Probability of being chosen is unknown Cheaper- but unable to generalise potential for bias Dr. Keerti Jain, Associate Professor, GD Goenka University, Gurgaon 7
  • 8.
    Probability samplesProbability samples Random sampling  Each subject has a known probability of being selected  Allows application of statistical sampling theory to results to:  Generalise  Test hypotheses Dr. Keerti Jain, Associate Professor, GD Goenka University, Gurgaon 8
  • 9.
    Methods used inprobabilityMethods used in probability samplessamples  Simple random samplingSimple random sampling  Systematic samplingSystematic sampling  Stratified samplingStratified sampling  Multi-stage samplingMulti-stage sampling  Cluster samplingCluster sampling Dr. Keerti Jain, Associate Professor, GD Goenka University, Gurgaon 9
  • 10.
    Simple random sampling Dr.Keerti Jain, Associate Professor, GD Goenka University, Gurgaon 10
  • 11.
    Table of randomnumbersTable of random numbers 6 8 4 2 5 7 9 5 4 1 2 5 6 3 2 1 4 06 8 4 2 5 7 9 5 4 1 2 5 6 3 2 1 4 0 5 8 2 0 3 2 1 5 4 7 8 5 9 6 2 0 2 45 8 2 0 3 2 1 5 4 7 8 5 9 6 2 0 2 4 3 6 2 3 3 3 2 5 4 7 8 9 1 2 0 3 2 53 6 2 3 3 3 2 5 4 7 8 9 1 2 0 3 2 5 9 8 5 2 6 3 0 1 7 4 2 4 5 0 3 6 8 69 8 5 2 6 3 0 1 7 4 2 4 5 0 3 6 8 6 Dr. Keerti Jain, Associate Professor, GD Goenka University, Gurgaon 11
  • 12.
    Sampling fractionSampling fraction Ratiobetween sample size and populationRatio between sample size and population sizesize Systematic sampling Dr. Keerti Jain, Associate Professor, GD Goenka University, Gurgaon 12
  • 13.
    Systematic sampling Dr. KeertiJain, Associate Professor, GD Goenka University, Gurgaon 13
  • 14.
    Cluster samplingCluster sampling Cluster:a group of sampling units close to each other i.e. crowding together in the same area or neighborhood Dr. Keerti Jain, Associate Professor, GD Goenka University, Gurgaon 14
  • 15.
    Cluster samplingCluster sampling Section4 Section 5 Section 3 Section 2Section 1 Dr. Keerti Jain, Associate Professor, GD Goenka 15
  • 16.
     Stratified samplingStratifiedsampling  Multi-stage samplingMulti-stage sampling Dr. Keerti Jain, Associate Professor, GD Goenka University, Gurgaon 16
  • 17.
    ConclusionsConclusions  Probability samplesare the best  Ensure  Representativeness  Precision Dr. Keerti Jain, Associate Professor, GD Goenka University, Gurgaon 17
  • 18.
    Systematic error (orbias) Inaccurate response (information bias) Selection bias Sampling error (random error) Errors in sample Dr. Keerti Jain, Associate Professor, GD Goenka University, Gurgaon 18
  • 19.
    Type 1 errorType1 error  The probability of finding a difference withThe probability of finding a difference with our sample compared to population, andour sample compared to population, and there really isn’t one….there really isn’t one….  Known as theKnown as the αα (or “type 1 error”)(or “type 1 error”)  Usually set at 5% (or 0.05)Usually set at 5% (or 0.05) Dr. Keerti Jain, Associate Professor, GD Goenka University, Gurgaon 19
  • 20.
    Type 2 errorType2 error  The probability of not finding a differenceThe probability of not finding a difference that actually exists between our samplethat actually exists between our sample compared to the population…compared to the population…  Known as the β (or “type 2 error”)Known as the β (or “type 2 error”)  Power is (1- β) and is usually 80%Power is (1- β) and is usually 80% Dr. Keerti Jain, Associate Professor, GD Goenka University, Gurgaon 20
  • 21.
    Types of StudiesTypesof Studies QualitativeQualitative •Calculating the proportionCalculating the proportion •Calculating the difference of proportionsCalculating the difference of proportions QuantitativeQuantitative Calculating the meanCalculating the mean Calculating the difference in meanCalculating the difference in mean Dr. Keerti Jain, Associate Professor, GD Goenka University, Gurgaon 21
  • 22.
    Sample size Quantitative Qualitative 2D 2σ2Z n= 2 2 2 2 1 D )xFσ(σ n + = 2 2 D π)π(1Z n − = 2 D F)P-(1P2 n = Dr. Keerti Jain, Associate Professor, GD Goenka University, Gurgaon 22
  • 23.
    Problem 1Problem 1 Astudy is to be performed to determine aA study is to be performed to determine a certain parameter in a community. From acertain parameter in a community. From a previous study a sd of 46 was obtained.previous study a sd of 46 was obtained. If a sample error of up to 4 is to beIf a sample error of up to 4 is to be accepted. How many subjects should beaccepted. How many subjects should be included in this study at 99% level ofincluded in this study at 99% level of confidence?confidence? Dr. Keerti Jain, Associate Professor, GD Goenka University, Gurgaon 23
  • 24.
    AnswerAnswer 881~3.880 24 246x22.58 n == 2D 2σ2Z n = Dr.Keerti Jain, Associate Professor, GD Goenka University, Gurgaon 24
  • 25.
    Problem 2Problem 2 A study is to be done to determine effectA study is to be done to determine effect of 2 drugs (A and B) on blood glucoseof 2 drugs (A and B) on blood glucose level. From previous studies using thoselevel. From previous studies using those drugs, Sd of BGL of 8 and 12 g/dl weredrugs, Sd of BGL of 8 and 12 g/dl were obtained respectively.obtained respectively.  A significant level of 95% and a power ofA significant level of 95% and a power of 90% is required to detect a mean90% is required to detect a mean difference between the two groups of 3difference between the two groups of 3 g/dl. How many subjects should be includeg/dl. How many subjects should be include in each group?in each group? Dr. Keerti Jain, Associate Professor, GD Goenka University, Gurgaon 25
  • 26.
  • 27.
    Problem 3Problem 3 Itwas desired to estimate proportion ofIt was desired to estimate proportion of anaemic children in a certain preparatoryanaemic children in a certain preparatory school. In a similar study at another schoolschool. In a similar study at another school a proportion of 30 % was detected.a proportion of 30 % was detected. Compute the minimal sample size requiredCompute the minimal sample size required at a confidence limit of 95% and acceptingat a confidence limit of 95% and accepting a difference of up to 4% of the truea difference of up to 4% of the true population.population. Dr. Keerti Jain, Associate Professor, GD Goenka University, Gurgaon 27
  • 28.
  • 29.
    Problem 4Problem 4 Inprevious studies, percentage ofIn previous studies, percentage of hypertensives among Diabetics was 70%hypertensives among Diabetics was 70% and among non diabetics was 40%and among non diabetics was 40% in ain a certain community.certain community. A researcher wants to perform aA researcher wants to perform a comparative study for hypertensioncomparative study for hypertension among diabetics and non-diabetics at aamong diabetics and non-diabetics at a confidence limit 95% and power 80%,confidence limit 95% and power 80%, What is the minimal sample to be takenWhat is the minimal sample to be taken from each group with 4% acceptedfrom each group with 4% accepted difference of true value?difference of true value? Dr. Keerti Jain, Associate Professor, GD Goenka University, Gurgaon 29
  • 30.
    AnswerAnswer 2.2413 0.04 x7.80.55)-(10.55x2 n 2 == 2 D F)P-(1P2 n = Dr.Keerti Jain, Associate Professor, GD Goenka University, Gurgaon 30
  • 31.
    Precision Cost Dr. Keerti Jain,Associate Professor, GD Goenka University, Gurgaon 31
  • 32.
    Dr. Keerti Jain,Associate Professor, GD Goenka University, Gurgaon 32