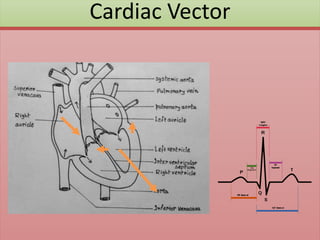
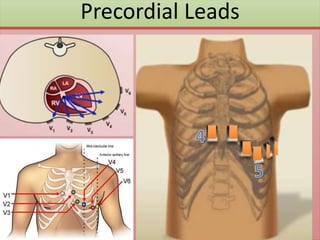
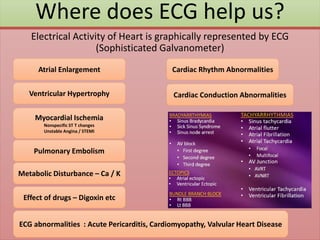
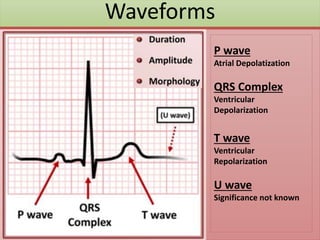
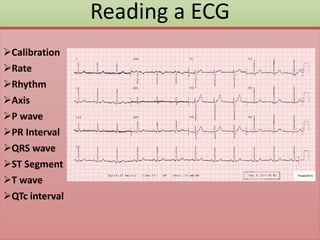
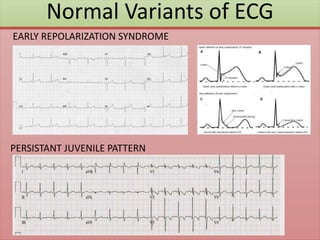
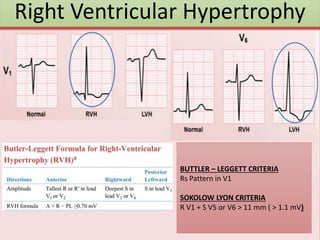
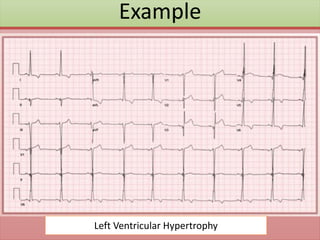
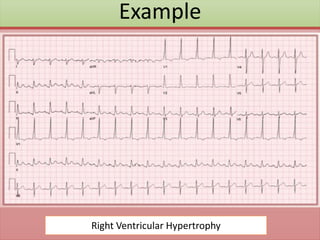
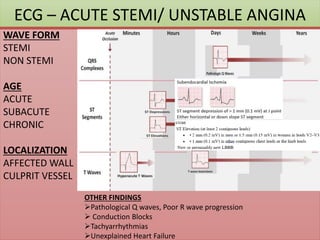
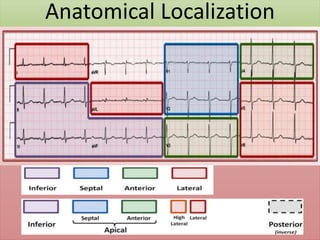
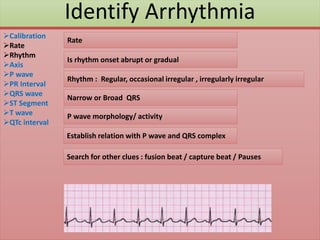
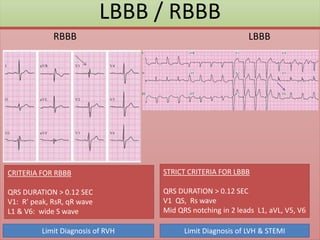
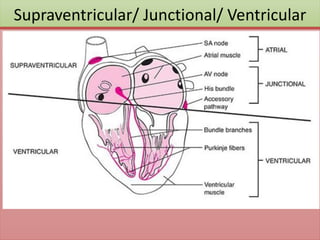
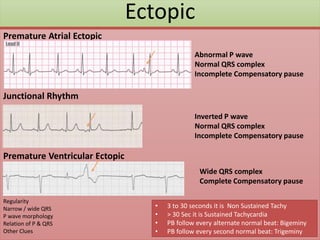
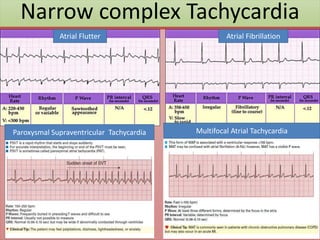
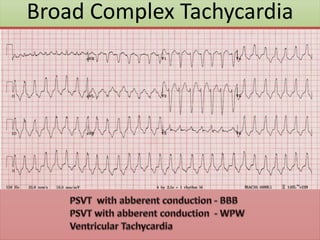
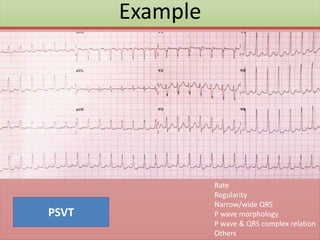
Analyzing ECG
Myocardial Cell
Atria : Myocardial Cells
Ventricle: Myocardial cells
SA Node, AV Node, Purkinjee Fibers
Gap Junctions
Myocardium : Na Ca K Dependent
SA node & AV node : Ca Dependent
Depolarization Repolarization
Plateau Phase
Understanding Vector
.
Atria : Myocardial Cells
Ventricle: Myocardial cells
SA Node, AV Node, Purkinjee Fibers
Positive wave towards
positive charge
+
Negative wave towards
negative charge
+
Depolarization
--
+++
Negative wave away
from positive charge
Repolarization
More cells: Larger vector
Specialized conduction: Faster vector
Direction of Vector
Stimulus
Cardiac Vector
ECG Machine
Ensure
Earthing of
machine
No watch /
Mobile /
Metal on body
Precordial Leads
Limb Leads
Standard Limb Leads
Augumented Limb Leads
Hexa Axial System
Spatial 3D orientation of ECG
Where does ECG help us?
Electrical Activity of Heart is graphically represented by ECG
(Sophisticated Galvanometer)
Atrial Enlargement
Ventricular Hypertrophy
Myocardial Ischemia
Nonspecific ST T changes
Unstable Angina / STEMI
Cardiac Rhythm Abnormalities
Metabolic Disturbance – Ca / K
Effect of drugs – Digoxin etc
ECG abnormalities : Acute Pericarditis, Cardiomyopathy, Valvular Heart Disease
Pulmonary Embolism
Cardiac Conduction Abnormalities
Normal ECG
25 mm/sec
Waveforms
P wave
Atrial Depolatization
QRS Complex
Ventricular
Depolarization
T wave
Ventricular
Repolarization
U wave
Significance not known
Segments & Intervals
Segments
Connect waveforms
Intervals =
Waveforms + Segments
PR Interval
(0.12 to 0.2 Sec)
QRS interval
(<0.12 Sec)
ST Segment
QT interval
Waveforms
(More on QRS Complex)
Reading a ECG
Calibration
Rate
Rhythm
Axis
P wave
PR Interval
QRS wave
ST Segment
T wave
QTc interval
Normal Variants of ECG
EARLY REPOLARIZATION SYNDROME
PERSISTANT JUVENILE PATTERN
Atrial Enlargement
Atrial Enlargement - Example
Left Atrial Enlargement
Atrial Enlargement - Example
Right Atrial Enlargement
Left Ventricular Hypertrophy
ROMHILT ESTES POINT CRITERIA
Axis, V1, V6, Strain pattern
Atria abnormality
Other abnormalities
SOKOLOW – LYON CRITERIA
S V1 + R V5 or V6 > 35 mm ( > 3.5 mV)
R wave in V5 or V6 > 26 mm (> 2.6 mV)
Left Ventricular Hypertrophy
Right Ventricular Hypertrophy
BUTTLER – LEGGETT CRITERIA
Rs Pattern in V1
SOKOLOW LYON CRITERIA
R V1 + S V5 or V6 > 11 mm ( > 1.1 mV)
Example
Left Ventricular Hypertrophy
Example
Right Ventricular Hypertrophy
Acute Coronary Syndrome
STE MI
STE in > 2 contiguous leads
Troponin T Positive
UNSTABLE ANGINA (Troponin T Normal)
NON STEMI (Troponin T Positive)
ECG – ACUTE STEMI/ UNSTABLE ANGINA
WAVE FORM
STEMI
NON STEMI
AGE
ACUTE
SUBACUTE
CHRONIC
LOCALIZATION
AFFECTED WALL
CULPRIT VESSEL
OTHER FINDINGS
Pathological Q waves, Poor R wave progression
 Conduction Blocks
Tachyarrhythmias
Unexplained Heart Failure
Localization – Wall & Culprit Vessel
Anatomical Localization
Example 1
Example 2
Anatomical Localization
Affected wall ECG Lead Artery Affected
SEPTAL V1 V2 LAD
ANTERIOR V3 V4 LAD
LATERAL V5 V6 Cx
HIGH LATERAL I aVL LAD
INFERIOR II III aVF RCA or Cx
Anteroseptal V1 V2 V3 V4 LAD
Anterolateral V3 V4 V5 V6 LAD
Inferolateral II III aVF V5 V6 Cx
Conduction System
Identify Arrhythmia
Calibration
Rate
Rhythm
Axis
P wave
PR Interval
QRS wave
ST Segment
T wave
QTc interval
Rate
Rhythm : Regular, occasional irregular , irregularly irregular
Narrow or Broad QRS
P wave morphology/ activity
Establish relation with P wave and QRS complex
Search for other clues : fusion beat / capture beat / Pauses
Is rhythm onset abrupt or gradual
Intraventricular Conduction Abnormalities
UNI FACICULAR BLOCK :
Lt anterior fascicular block
Lt posterior fascicular block
BUNDLE BRANCH BLOCK
RBBB LBBB
BI FACICULAR BLOCK
RBBB + Lt AF Block or Lt PF Block
LBBB / RBBB
RBBB LBBB
STRICT CRITERIA FOR LBBB
QRS DURATION > 0.12 SEC
V1 QS, Rs wave
Mid QRS notching in 2 leads L1, aVL, V5, V6
CRITERIA FOR RBBB
QRS DURATION > 0.12 SEC
V1: R’ peak, RsR, qR wave
L1 & V6: wide S wave
Limit Diagnosis of LVH & STEMI
Limit Diagnosis of RVH
Supraventricular/ Junctional/ Ventricular
Ectopic
Premature Atrial Ectopic
Junctional Rhythm
Premature Ventricular Ectopic
Rate
Regularity
Narrow / wide QRS
P wave morphology
Relation of P & QRS
Other Clues
• 3 to 30 seconds it is Non Sustained Tachy
• > 30 Sec it is Sustained Tachycardia
• PB follow every alternate normal beat: Bigeminy
• PB follow every second normal beat: Trigeminy
Abnormal P wave
Normal QRS complex
Incomplete Compensatory pause
Wide QRS complex
Complete Compensatory pause
Inverted P wave
Normal QRS complex
Incomplete Compensatory pause
Brady Arrhythmias
FAILURE OF ELECTRICAL IMPULSE
GENERATION (Sinus node Dysfunction)
FAILURE OF EFFECTIVE
CONDUCTION ( AV Node Block)
Sick Sinus Syndrome
Sinus Bradycardia
Inability to increase rate with increased sympathetic activity
Absence of escape rhythms when sinus rate slows
Tachy-brady syndrome
Tachyarrhythmias - Mechanisms
INCREASED
AUTOMATICITY
RE ENTRY
TRIGGERED ACTIVITY
Wide Complex Tachycardia
Ventricular tachycardia
Other: SVT with BBB
SVT with WPW syndrome
(Antidromic AVRT)
A fib/A flutter with variable conduction
SVT
.
Narrow complex Tachycardia
Atrial Flutter Atrial Fibrillation
Multifocal Atrial Tachycardia
Paroxysmal Supraventricular Tachycardia
Broad Complex Tachycardia
Example
Rate
Regularity
Narrow/wide QRS
P wave morphology
P wave & QRS complex relation
Others
PSVT
Example
Rate
Regularity
Narrow/wide QRS
P wave morphology
P wave & QRS complex relation
Others
AF
Example
Rate
Regularity
Narrow/wide QRS
P wave morphology
P wave & QRS complex relation
Others
VT
QUESTIONS?
Paintings made by my Daughter
Patience + Dedication to work hard = Excellence

Electrocardiography basics 2022