This document discusses a study on the effect of magnetic treatment of water on evapotranspiration of tomato plants. Three magnetic flux densities were used to treat water for tomato irrigation, along with a control of non-treated water. The amount of water lost daily from buckets containing tomato plants due to evapotranspiration was measured. Plants irrigated with magnetically treated water had higher daily evapotranspiration rates compared to the control, indicating treated water allowed easier water absorption and faster plant growth despite equal water quantities.
It is a presentation about the use of FBBR for treating the waste water from industrial and domestic sources.
This explains the advantages and the need for FBBR.
It is a presentation about the use of FBBR for treating the waste water from industrial and domestic sources.
This explains the advantages and the need for FBBR.
This was the experiment taken up during training at Central Institute of Agricultural Engineering, Bhopal. The concepts of Precision Farming including Drip Irrigation and plastic mulching have been discussed.
Filtration of Greywater by Natural ProcessRohan Gajbhiye
This is my Under-graduation final year project presentation based on "Filtration of Grey water by Natural Process using Canna India Plant". My goal to to recycle Grey water for various day to day purpose of our life, so that, we can use and reuse the water for day to day needs such as Gardening, Farming, Car Washing and can prevent scarcity of water which also helps us to re-energize and replace the dry land with veggies and greneery .
Hope it helps. It's not just a presentation but it's a social message to all to help themselves by taking little steps everyday to save water and save life.
Stay healthy Stay fit.
Asia Regional Planning Meeting-Efficient use of limited water resource:Safe R...ICRISAT
In developing countries, a large portion of population resides in villageswhere formal waste management systems do not exist.Recycling and reuse of available waste in villages provides sustainable solutions for a waste management system and reduces environmental degradation.Inappropriate reuse of untreated wastewater is unsafefor farmers and consumers.
CPDM Major Project: Solar powered portable water purifier Task ClarificationKashyep M
CPDM Major Project: Solar powered portable water purifier Task Clarification presentation.
First presentation in the main design project, taking care of user survey, market analysis, list of requirements, etc.
Spearmint (Mentha spicata L.) Response to Deficit Irrigationpaperpublications3
Abstract: An experiment was conducted with the objective to identify the level of deficit irrigation which allows achieving optimal yield and investigate the effect of deficit irrigation practice on spearmint (Mentha Spicata L.) yield and yield components. The experiment was conducted at Koka research station of Wondo Genet Agricultural Research Center, Ethiopia latitude 8O26’, longitude 39O2’ and altitude 1602masl for two years (2011/2012 and 2012/2013 dry season). Nine treatments three level of irrigation water amount percentage based on evapo-transpiration of the crop (ETc) (100%ETc, 75%ETc and 50%ETc) and three types of furrow irrigation water application method (alternate furrow, fixed furrow and conventional furrow) were used in randomized completely block design (RCBD) with three replications. The pooled mean of two year data showed different level of deficit irrigation had a significant effect (p<0.05)><0.01) variation among treatments due to deficit irrigation on dry biomass yield per hectare, dry leaf yield per hectare, essential oil yield per hectare and water use efficiency. However, different deficit irrigation level had no significant influence on wet harvesting index. The highest fresh biomass, dry biomass, fresh leaf, dry leaf and essential oil yield per harvesting cycle of 12093kg/ha, 3746kg/ha, 8133kg/ha, 2441.1kg/ha and 37.0kg/ha respectively was obtained due to 100%ETc with conventional furrow application method. Moreover, the highest water use efficiency of 16.3x10⁻³kg/m3 was achieved due to deficit irrigation to 50%ETc with alternate furrow irrigation water application method. The study showed that the best treatment is deficit irrigation to 50%ETc with conventional furrow application method which had no significant variation with treatments that showed higher yields of spearmint including water use efficiency.
Keywords: Alternate furrow, conventional furrow, deficit irrigation, fixed furrow, spearmint.
performance evaluation and characterization of wetted soil parameters of impr...IJEAB
Field study was conducted to evaluate the emission uniformity (EU), global coefficient of variation (CGv), emitter flow variation (Qvar) and distribution uniformity (DU), and determine the wetted radius (rw) on soil surface of improvised medi-emitters installed in a tomato field. Soil water content (SWC) at four layers was determined after different periods of irrigation. Radius of wetted soil surface was determined and predicted. Irrigation frequency had no significant effect on the average discharge rate of the medi-emitters throughout the growing cycle. Average Qvar and CGv were significantly (P=0.05) influenced by the frequency of application while the EU and DU did not significantly (P=0.05) differ among the treatments. There were significant differences in the average values of SWC in different soil layers under the different periods of irrigation. Both the observed and calculated rw on the soil surface were fitted with fourth order polynomial. The model performance parameters of MAE and RMSE between the calculated and observed radii were low, indicating good prediction. Medical infusion set can successfully replace the more expensive conventional emitters for drip irrigation system.
Effects of drip irrigation frequency and depth on soil hydro-physical propert...inventionjournals
International Journal of Engineering and Science Invention (IJESI) is an international journal intended for professionals and researchers in all fields of computer science and electronics. IJESI publishes research articles and reviews within the whole field Engineering Science and Technology, new teaching methods, assessment, validation and the impact of new technologies and it will continue to provide information on the latest trends and developments in this ever-expanding subject. The publications of papers are selected through double peer reviewed to ensure originality, relevance, and readability. The articles published in our journal can be accessed online.
Effect of Deficit Irrigation on Yield and Water Productivity of Onion (Allium...Premier Publishers
The field experiment was conducted in Bennatsemay Woreda, Enchete kebele during 2018 season with objective of investigating the effect of deficit irrigation on yield and water productivity of onion under conventional furrow irrigation system. Six treatments (T1=100% ETc, T2=85% ETc, T3=70% ETc, T4=50% ETc, T5=100% ETc Is, 85% ETc Ds, 70% ETc Ms, 50% ETc Ls and T6=85% ETc Is, 70% ETc Ds, 50% ETc Ms, 0% ETc Ls) were imposed on onion (Allium cepa L.) and laid out in randomized complete block design (RCBD) with four replications. Results indicated that the different deficit irrigation levels had highly significant (p < 0.01) effect on vegetative growth, yield, yield components and water use efficiency of onion. The highest bulb yield of 21.3 t/ha were obtained from T1 which was significantly different to all other treatments while yield from T6 (12.86 t/ha) was recorded as the lowest one. Similarly, the highest IWUE (2.41 kg/m3) and CWUE (4.02 kg/m3) were obtained from T6. However, at T4 and T6 high yield reduction was recorded which may not be attractive for producers. Therefore, it could be concluded that increased water saving and water productivity through irrigation at 70% ETc deficit irrigation level under conventional furrow irrigation system can solve the problem of water shortage and would ensure the opportunity of further irrigation development in the study area and similar agro-ecology.
Spearmint (Mentha spicata L.) Response to Deficit Irrigationpaperpublications3
Abstract: An experiment was conducted with the objective to identify the level of deficit irrigation which allows achieving optimal yield and investigate the effect of deficit irrigation practice on spearmint (Mentha Spicata L.) yield and yield components. The experiment was conducted at Koka research station of Wondo Genet Agricultural Research Center, Ethiopia latitude 8O26’, longitude 39O2’ and altitude 1602masl for two years (2011/2012 and 2012/2013 dry season). Nine treatments three level of irrigation water amount percentage based on evapo-transpiration of the crop (ETc) (100%ETc, 75%ETc and 50%ETc) and three types of furrow irrigation water application method (alternate furrow, fixed furrow and conventional furrow) were used in randomized completely block design (RCBD) with three replications. The pooled mean of two year data showed different level of deficit irrigation had a significant effect (p<0.05)><0.01) variation among treatments due to deficit irrigation on dry biomass yield per hectare, dry leaf yield per hectare, essential oil yield per hectare and water use efficiency. However, different deficit irrigation level had no significant influence on wet harvesting index. The highest fresh biomass, dry biomass, fresh leaf, dry leaf and essential oil yield per harvesting cycle of 12093kg/ha, 3746kg/ha, 8133kg/ha, 2441.1kg/ha and 37.0kg/ha respectively was obtained due to 100%ETc with conventional furrow application method. Moreover, the highest water use efficiency of 16.3x10⁻³kg/m3 was achieved due to deficit irrigation to 50%ETc with alternate furrow irrigation water application method. The study showed that the best treatment is deficit irrigation to 50%ETc with conventional furrow application method which had no significant variation with treatments that showed higher yields of spearmint including water use efficiency.
Response of Hot Pepper (Capsicum Annuum L.) to Deficit Irrigation in Bennatse...Premier Publishers
This study was conducted at Enchete kebele in Benna-Tsemay Woreda, South Omo Zone to evaluate the response of hot pepper to deficit irrigation on yield and water productivity under furrow irrigation system. The experiment comprised four treatments (100 % of ETc, 85% of ETc, 70 % of ETc and 50% of ETc), respectively. The experiment was laid out in RCBD and replicated four times. The two years combined yield results indicated that, the maximum total yield (20.38 t/ha) was obtained from 100% ETc while minimum yield (12.92 t/ha) was obtained from 50% of ETc deficit irrigation level. The highest WUE 5.22 kg/ha mm-1 was obtained from 50% of ETc. Treatment of 100% ETc irrigation application had highest benefit cost ratio (4.5) than all others treatments. Applying 50% of ETc reduce the yield by 37% when compared to 100 % ETc. Accordingly, to achieve maximum hot pepper yield in areas where water is not scarce, applying 100% ETc irrigation water application level throughout whole growing season under furrow irrigation system is recommended. But, in the study area water scarcity is the major limiting factor for crop production. So, it is possible to get better yield and water productivity of hot pepper when we apply 85% ETc irrigation water throughout growing season under furrow irrigation system.
Evapotranspiration partitioning components in an irrigated winter wheat field...Agriculture Journal IJOEAR
Abstract— The arid and semi-arid regions constitute roughly one third of the total earth’s surface. In these regions water scarcity is one of the main limiting factors for economic growth. The impact of such water scarcity is amplified by inefficient irrigation practices, especially since about 85% of available water is used for irrigation in these regions. Therefore, a sound and efficient irrigation practice is an important step for achieving sustainable management of water resources in these regions. In this regard, a better understanding of the water balance is essential to explore water-saving techniques. In the context CRP project, experimental setups were conceived to monitor seasonal water consumption on the wheat crop irrigated by flood irrigation in Sidi Rahal station (middle of morocco. The partitioning of evapotranspiration compounds shows that transpiration dominates the evaporation about 68 % for three days (22, 23 and 24 February 2012). In addition the wheat absorbs the soil water from 10 cm to 20 cm (90%) at this growing stage according to the multiple-source mass balance assessment.
Evaluation of Irrigation Application Efficiency: Case Study of Chanchaga Irri...AZOJETE UNIMAID
Water is an integral issue needed to attain the desired targets but good quality water for irrigation purpose is gradually become scarce. The seasonal nature of rainfall can give rise to water stress at critical periods of growth. This research attempts to evaluate the irrigation application efficiency of Chanchaga irrigation scheme, Minna, Niger state. A hand auger was used to bore to a desired depth to remove samples of the moist soil. Samples of the moist soil removed was placed in a can, covered and taken to the laboratory. The specific gravity (apparent) of the soil particle and the depth of water applied were determined using volumetric method, water application efficiency is determined using Gravimetric Method of Soil Moisture Content (Pw) Determination. The moisture content of the field after irrigation water is applied falls between the ranges of 51.1% and 51.5%, with an average of 51.28%, in this case the average amount of water applied is about 4.68%, this shows a little increase in the moisture content of the soil in the field. It was concluded that the efficiency of water application obtained is adequate and a good result considering the available management practice in terms of system operation, monitoring and evaluation.
Integrated Effect of Mulching Materials and Furrow Irrigation Methods on Yiel...Premier Publishers
A field experiment was conducted at Werer, Middle Awash Valley during the dry season of the 2016-17, 2017-18 and 2018-19 to investigate the effects of mulching materials and furrow irrigation methods on onion yield and water productivity under semi-arid conditions. Split plot design with three replications, in which the irrigation methods (Conventional, Fixed and Alternate Furrow) were assigned to the main plot and the three mulching materials (no mulch, wheat straw and white plastic mulch), were to the sub-plot. Results indicate that marketable onion bulb yield and water use efficiency were affected by the main effect of furrow irrigation methods and mulching materials (p< 0.05). But the interaction of irrigation methods and mulch had no significant effect on marketable onion bulb yield and water use efficiency. The conventional furrow irrigation (10081.52kg ha-1) and wheat straw mulch (12121.63 kg ha-1) resulted in the maximum marketable bulb yield. The highest water use efficiency (3.27 kg/m3) was obtained from alternate furrow irrigation method with straw mulch. This suggests that under limited irrigation water, alternate furrow irrigation along with wheat straw mulch minimize evaporation loss; maximize water productivity and sustain onion production at Amibara and similar agro-ecology and soil type.
Water Requirement and Crop Coefficient of Onion (Red Bombay) in the Central R...paperpublications3
Abstract: Determination of crop water requirement is the primary duty in any irrigation planning. This can be obtained through determining crop coefficient (Kc) which integrates the effect of characteristics that distinguish a typical field crop from the grass reference that has a constant appearance and a complete ground cover. Consequently, different crops will have different Kc coefficients. The changing characteristics of the crop over the growing season also affect the Kc coefficient. Hence crop coefficient (Kc), the ratio of potential crop evapotranspiration to reference evapotranspiration, is an important parameter in irrigation planning and management. However, this information is not available for many important crops for a specific area. A study was carried out at Melkassa Agricultural Research Center of Ethiopian Institute of Agricultural Research, which is located in a semi arid climate of the great central rift valley. A drainage type lysimeters was used to measure the daily evapotranspiration of Onion, Red Bombay variety, on a clay loam soil. Crop coefficient was developed from measured crop evapotranspiration (3.00, 4.58, 6.11 and 4.63) and calculated reference evapotranspiration using weather data (4.92, 5.33, 5.99 and 5.79). The measured values of crop coefficient for the crop were 0.34, 0.70, 1.01 and 0.68 during initial, development, mid-season and late-season growth stages respectively. These locally determined values can be used by irrigation planners and users in the central rift valley and other areas with similar agroecological conditions.
Treatment Performance of Domestic Wastewater in a Tropical Constructed Wetlan...Oswar Mungkasa
prepared by Jonah S Butler* *Fulbright Scholar, DILG-GTZ Affiliate in Philippines: For Environmental Science Study on Wastewater Treatment. (Email: Jonahsbutler@gmail.com) for Urban Environments in Asia, 25-28 May 2011, Manila, Philippines. organized by International Water Association (IWA).
Effect of Drip Irrigation and Fertilizer Management on Capsicum (Capsicum Ann...iosrjce
An experiment was conducted during the rabi season of 2008-09 to study the effect of drip irrigation
and fertilizer management on Capsicum at Research area farms of Assam Agriculture University Jorhat
(Assam) India. Result reviled that the effect of drip irrigation and fertilizer management treatments (T3) were
significant in respect of percent nitrogen content both in plant (2.18%) and fruits (1.19%). Similarly the highest
uptake af p2o5 by plants (7.37 kg/ha) and by fruits (3.64 kg/ha) k2o by plant (47.05 kg/ha) and by fruits (26.07
kg/ha) recorded in treatment T3 at 100% EPR alone with the application of 75% RD of N and K through drip.
The total Uptake of N (69.16 kg/ha) p2o 5 (11.0 kg/ha) and K20 (73.12 kg/ha) were also significant over the
treatment T9 (N-48.27 kg/ha)p2o 5 (7.41 kg/ha) and K2o (48.85 kg/ha) respectively. The nutrient status
determined in terms of available N, p2o 5, and K+O in kg/ha was significantly influenced by different drip
irrigation and fertilizer management significantly highest fruit yield (87.20 q/ha) was recorded in drip irrigation
at 100 EPR along application of 75 % Rd of N through drip irrigation over treatments.
pillow irrigation is the advance stage of the drip irrigation and furrow irrigation where the weed control can be done without any expenditure and mechanical work
Turbidity and Colour Reduction of Pond Water Using Extracts of Diospyros mesp...AZOJETE UNIMAID
The study examined the coagulation performance of leaves and root bark extracts of Diospyros mespiliformis, Mitragyna inermis, Piliostigma reticulatum and Tamarindus indica. The plant materials were collected along River Kubwa in Damboa local Government area of Borno State, Nigeria. The crude extracts of these plant materials were prepared based on soxhlet method using soxhlet solvent extractor. About 400mg of each pulverized sample was used for the extraction process. Three (3) liters of distilled water was used for the extraction process. The extracts were each added to highly turbid (422 NTU) pond water samples at various dosages of 60, 75, 90, 105, 120, and 135mg/l and a conventional coagulation-flocculation jar tests were conducted. The nature of the flocs formation for all the plant extracts were observed to be smoky rather than aggregating into denser masses and resulted in turbidity and colour removal efficiencies of 0.71-18.57% and 1.17-22.38% respectively. The coagulation activities were subjected to T-Test Analysis and it indicated that there was statistically (P< 0.05) significance difference at different concentrations. The results also revealed slight decrease in pH in the range of 8.1-7.55 exhibited by all the extracts. From the results of the turbidity and colour removal efficiencies, it can be concluded that these plant materials have the potential of improving the quality of pond or surface water (which most rural communities in developing countries depend for many purposes) that are heavily turbid; However, for them to perform effectively, a coagulant aid is required.
Phyto-Chemical Screening and Antibacterial Activities of Aqueous Extracts of ...AZOJETE UNIMAID
The phytochemical contents and antimicrobial activities of leaves and root bark extracts of Diospyros mespiliformis, Mitragyna inermis, Piliostigma reticulatum and Tamarindus indica were investigated. The plant materials were collected along River Kubwa in Damboa local Government area of Borno State, Nigeria. The crude extracts of these plant materials were prepared based on soxhlet method using soxhlet extractor. About 400mg of each pulverized sample was used for the extraction process. Three (3) liters of distilled water was used for the extraction process. All the extracts showed the presence of carbohydrates, cardiac glocosides, saponins, tannins and flavonoids. Terpenoids was detected in Diospyros mespiliformis, Tamarindus indica extracts and Piliostigma reticulatum root bark extract. Disc sensitivity technique was conducted on eight bacteria isolates. These bacteria are: staphylococcus aureus, bacillus subtilis, Escherichia coli, salmonella typhi streptococcus faecolis pseudomonas aeruginosa coreynebacteria species and shigelladysenteriae. The growth inhibition studies on the test isolates indicated that most of the plant extracts had significant effects against some of the isolates (microorganisms). The antimicrobial activities were subjected to Two-way Analysis of Variance (ANOVA) and it indicated that there was statistically (P < 0.05) significant difference at different concentrations. It is concluded that these plant materials have the potential of improving the bacteriological quality of pond or surface water (which most rural communities in developing countries depend for many purposes) that are heavily polluted with pathogenic microbes.
Sedimentology and Paleoenvironment of Deposition of the Deba-Fulani Member of...AZOJETE UNIMAID
The sedimentology and paleoenvironment of the Deba-Fulani Member of the Pindiga Formation were investigated on the basis of their grain size distribution. Granulometric analysis has indicated that the samples are generally well to moderately sorted with skewness values ranging from negatively to positively skewed which may indicate influence of both marine and fluvial conditions. Bivariate plot relationships of standard deviation vs. mean, standard deviation vs. skewness, first percentile vs. mean also indicated both fluvial and marine setting for the middle part of the Pindiga Formation member. However, most of the bivariate plot showed dominance of fluvial environment. The probability curve plot shows a prevalence of three-sand population curves which are usually associated with wave processes indicating marine conditions for most part of the Deba-Fulani Member.
Characterisation of Natural Moulding Sands from selected Deposits in Maidugur...AZOJETE UNIMAID
Natural moulding sands consist of refractory sand grains associated with clay right from their deposit locations. In Maiduguri, there are some sand casting activities taking place. However, there seems to be no single graded source of moulding sand that the practitioners can use for producing qualitative sand castings. Therefore, this study was carried out to characterise moulding sands from five selected deposits in Maiduguri for possible use in sand casting applications. Chemical compositions of sand samples were determined using XRF Analyser while American Foundrymen’s Society (AFS) standard laboratory tests were used to determine the physico-mechanical properties. The results of the characterisation revealed the following ranges of values; clay content from 21.8% to 47.2% corresponding to Pompomari and Gwange/Fori, grain fineness number from 50.94 AFS to 95.02 AFS corresponding to Pompomari and Gwange/Fori deposits.. Other physico-mechanical properties determined included; green and dry compressive strengths, permeability, loss on ignition and refractoriness. Results of chemical composition analysis show SiO2 having dominance in all the samples (90.10 % to 66.77 %) with trace elements of CaO, Fe2O3, Al2O3, MgO, TiO2, K2O, NaO2 also present within acceptable limits. The overall results show that all deposits have potential for use in sand casting applications for the casting of nonferrous metals and malleable and ductile iron. However, the clay content range given above is a major problem compared with the standards recommended by the American Foundry Society. This did not only limit their uses to low melting point alloys because of relatively lower refractoriness values but also possesses danger to their life expectancy. In conclusion, the use of the deposits characterised especially the Gwange/Fori deposit with clay content of 47.2 % should be used with caution because of the possibility of developing gas defects like blowholes and pinholes. All the other four deposits have been recommended for full exploitation for use in sand casting applications for casting of nonferrous metals as well as malleable and ductile irons. Finally, on the basis of the overall properties, the five deposits have rated in the following order of preferences; Dala Lawanti, Pompomari, Gwange/Fori, Gamboru and University of Maiduguri respectively.
Statistical Modelling of the Energy Content of Municipal Solid Wastes in Nort...AZOJETE UNIMAID
The ability to predict the quantity of energy to be produced is of paramount importance in every country. It would assist in setting up a waste management plan which will lead to a sustainable energy policy. This paper presents the development of a statistical linear regression mathematical model to predict the amount of energy contained in municipal solid wastes from the knowledge of such characteristics of the wastes as physical composition and/or moisture content. Major cities of Kano, Katsina, Dutse, Damaturu, Maiduguri, Bauchi, Birnin Kebbi, Gusau and Sokoto in Northern Nigeria, with high population densities and intense industrial activities constituted the area of study. Ten kilogram each, of the municipal solid waste was collected from the government designated refuse dumping sites in both highly dense populated low income areas and government residential areas, during the hottest months of February, March and April and during the rainy season in the month of August for three years. The waste material was prepared for the determination of its physical characteristics by sifting through. Proximate, ultimate analyses and calorific values were determined using ASTM analytical techniques and formulas from the literature. An empirical linear regression based mathematical model was developed using statistical methods and experimental data. Comparison between experimental and predicted values of the calorific values showed an agreement of about 70% with an average deviation of 5.03% while the standard deviation was found to be 5.29%.
Development of Wind Operated Passive Evaporative Cooling Structures for Stora...AZOJETE UNIMAID
A Wind operated passive evaporative cooler was developed. Two cooling chambers were made with clay container (cylindrical and square shapes). These two containers were separately inserted inside bigger clay pot inter- spaced with clay soil of 7 cm (to form pot-in-pot and wall-in wall) with the outside structure wrapped with jute sack. The soil and the jute sacks were wetted with salt solution. Five blades were constructed inside the cooling chambers with aluminium material which were connected with a shaft to a vane located on a wooden cover outside the cooling chamber. The vanes (made of aluminium) were to be powered by the wind which in turn rotates the blades inside the cooling chamber. The total volume of 40500cm3 and storage capacity of 31500cm3 were recorded for the square structures while total volume of 31792.5cm3 and storage capacity of 24727.5cm3 were recorded for the cylindrical structures. During the test period, the average temperatures of 27.07oC, 27.09oC and 33.6oC were obtained for the pot-in-pot (cylindrical), wall-in-wall (square) and the ambient respectively. The average relative humidity of 92.27%, 91.99% and 69.41% were obtained for the pot-in-pot (cylindrical), wall-in-wall (square) and the ambient respectively. The average minimum and maximum wind speed recorded for the month of October was 2.5m/s and 2.6m/s respectively
Development and Performance Evaluation of a Re-Circulatory Vegetable MoisturizerAZOJETE UNIMAID
A re-circulatory vegetable moisturizer for preventing wilting in vegetables was developed and its performance evaluation carried out. Freshly harvested Amaranthus vegetables were used for the experiments. The temperature and relative humidity were monitored daily. The vitamin A of this produce was determined at intervals of two days for 9 days. The effects of the storage parameters (temperature and relative humidity) on the nutritional value of the produce were determined using statistical analysis of variance (ANOVA). Further analysis by Duncan’s New Multiple Range Test (DNMRT) was carried out to compare the means. The vegetable moisturizer was evaluated by comparing the change in nutritional (vitamin A) of Amaranthus vegetable with hand wetting system and no wetting condition. The results showed that the moisturizer had higher mean vitamin A content (4.93mg/100g)compared to the mean vitamin A content of the manual wetting (4.88mg/100g) and no wetting condition (4.57mg/100g). The sensory characteristics showed that the Moisturizer was more desirable when compared to the manual wetting and no wetting condition after nine days. It was concluded that the Moisturizer preserved the nutritional and sensory characteristics (texture and colour) better than the manual and no wetting condition as a result of lower temperature, higher relative humidity and better water draining of the Moisturizer.
Optimization of some mineral contents of dried osmo-pretreated green bell pep...AZOJETE UNIMAID
A study to optimize three mineral contents (magnesium, potassium and manganese) of dried osmo-pretreated green bell pepper was done using Response Surface Methodology (RSM). Five levels of osmotic solution concentration (A) (5% (w/w), 10% (w/w), 15% (w/w), 20% (w/w) and 25% (w/w)) of common salt and osmotic process durations (B) (60 min, 90 min, 120 min, 150 min and 180 min) were considered. After osmotic dehydration, all pre-treated and some control (unpre-treated) samples were dried at a constant temperature of 50˚C in a fabricated cabinet dryer. RSM under central composite design in Design Expert 8.0.3 computer software package was used to design the experiment, analyse data, optimize the process and present all results with 2-dimesional and 3-dimensional plots. From results obtained, optimized combinations were selected on the basis of their desirability values which were 0.931, 0.432 and 1.00 for magnesium, potassium and manganese respectively. From the desirability values on the response surface plots, the optimum (maximum) value of magnesium was found to be 29.18 mg/100g at osmotic process duration of 180 min and osmotic solution concentration of 25% (w/w); for potassium, the optimized value was 46.13 mg/100g at osmotic process duration of 60 min and osmotic solution concentration of 5% (w/w); while the optimized value for manganese was 10.96 mg/100g at osmotic process duration of 150 min and osmotic solution concentration of 15% (w/w). Dried pre-treated products had values closer to fresh samples than control (dried unpre-treated) samples for all the three mineral contents considered.
Preliminary Study on the Characterization of oil from Nurse tetra (Brycinus n...AZOJETE UNIMAID
Fish is an important source of protein providing essential amino acids. Imported fish oil are expensive, scarce and sometimes unavailable. However, extraction of oil from indigenous fish species will provide cheap, abundant and readily available product. This study therefore, aimed at the extraction of fish oil from Brycinus nurse. A total of 1368g of B. nurse was procured from Lake Alau, Borno State. The fish were divided into four samples A, B, C and D respectively. Sample A was oven dried for a period of 60 minutes, at maximum temperature of 70oC, sample B for 90 minutes at a maximum temperature of 96oC, sample C for 60 minutes at maximum of 96oC, and sample D for 90 minutes at a maximum temperature of 70oC. After oven drying, the samples were immediately transferred to mechanical workshop for oil extraction using hydraulic press. The characterization and the quality of fish oil were measured using the acid value, saponification value and relative density. Results showed that the fish oil from samples A, B, C, and D had acid value of 3.57mg/KOH, 3.59mgKOH, 2.9mg/KOH, and 2.75mg/KOH respectively, the saponification value of 82.8mg/KOH/g, 94.42mg/KOH/g, 82.8mg/KOH/g, and 70mg/KOH/g respectively while the relative density was found to be 0.04305 for sample A, 0.04301 for sample B, sample C 0.0433 and sample D 0.04307. It can be concluded that the fish oil values falls within the acceptable standard value which are suitable for application in pharmaceutical and food industries. Therefore, Brycinus nurse has the potential of producing fish oil for domestic and industrial use.
Development of an Electrically Operated Cassava Peeling and Slicing MachineAZOJETE UNIMAID
The development and construction of an electrically operated cassava peeling and slicing machine was described in this paper. The objective was to design, construct and test an electrically operated machine that will peel and slice cassava root into chips, to aid the processes of drying, pelletizing and storage. The methodology adopted includes; design, construction, calculation, specification, assembly of component parts and performance test. The machine was able to Peel and slice cassava to fairly similar sizes. Performance test reveals that 7 kg of cassava tuber was peeled and chipped in one minute, which shows that, the machine developed can significantly reduce the cost of labour and time wastage associated with traditional processing of cassava tubers into dried cassava pellets, and finished products, such as; garri, and cassava flour. The machine has a capacity of 6.72 kg/min, with peeling and chipping efficiency of 66.2% and 84.0% respectively. The flesh loss of the peeled tuber was 8.52%, while overall machine efficiency obtained as 82.4%. The machine is recommended for use by small scale industries and by cassava farmers in the rural areas. It has an overall cost of N46100 ($150). The machine can easily be operated by an individual and maintained, by using warm water to wash the component parts, and sharpening of the chipping disc when required.
Investigating the bacterial inactivation potential of purified okra (Hibiscus...AZOJETE UNIMAID
The ability of purified okra protein (POP) as coagulant and as disinfectant material in comparison with aluminium sulphate (AS) in water treatment was assessed. A laboratory jar test experiments and Colilert-18/Quanti-Tray method of bacterial analysis were conducted using POP as coagulant in treating river water. The results show an excellent dual performance function of POP against the conventional coagulant, AS in drinking water treatment. It was observed that a marked inactivation of approximately 100% of faecal and E-coli count in raw water was achieved with POP and zero regrowth of bacteria after 72-hour post treatment. However, there was regrowth in total coliform count as a result of the presence of other microbes other than E-coli and faecal coliform in the system. In all cases AS showed a reduced performance against the two indicator organisms achieving only 93% with remarkable regrowth of E-coli and faecal coliform after prolonged storage time in the clarified water. Turbidity removal was also noted to be approximately similar, 92% across all coagulants tested. Therefore, the use of POP in water treatment could improve access to clean water in developing countries and could help in reducing the import of water treatment chemicals.
Performance Evaluation of a Developed Grain Milling MachineAZOJETE UNIMAID
A locally developed grain milling machine was evaluated using maize (Sammaz - 12 variety) and millet (Lake Chad Dwarf variety) at different moisture range of 8.3% to 24.6% and 6.4% to 27.2% (db) respectively. The performance indices considered for the evaluation of the machine were milling efficiency, machine efficiency and milling rate. The results obtained were subjected to statistical analysis. The results showed that all the parameters evaluated decreased with increase in moisture content for both grains used in testing evaluating the performance of the machine. It was found that, the milling efficiency and milling rate decreased from 86.3% to 40% and 20.4 to 12.5kg/h for maize respectively and 89% to 26.6% and 23.4kg/h to 12.1kg/h for millet respectively as the moisture content was increased. Statistical analysis showed significant (P < 0.05) differences between the crop moisture content and milling efficiency and machine efficiency. The milling rate was not significantly affected by the moisture content for both grains used in the study.
Numerical Predictions of Enhanced Impingement Jet Cooling with Ribs and Pins ...AZOJETE UNIMAID
Numerical calculations relevant to gas turbine internal wall heat transfer cooling were conducted using conjugate heat transfer (CHT) computational Fluid Dynamics (CFD) commercial codes. The CHT CFD predictions were carried out for impingement heat transfer with different types of obstacle walls (fins) on the target surfaces. A 10 × 10 row of impingement air jet holes (or hole density n of 4306 m-2) was used, which gives ten rows of holes in the cross-flow direction and only one heat transfer enhancement obstacle per impingement jet was investigated. Previously, four different shaped obstacles were investigated experimentally and were used to validate the present predictions. The obstacle walls, which were equally spaced on the centreline between each impingement jet are of the co-flow and cross-flow configurations. The impingement jet pitch X to diameter D, X/D and gap Z to diameter, Z/D ratios were kept constant at 4.66 and 3.06 for X, Z and D of 15.24, 10.00 and 3.27 mm, respectively. The obstacles investigated were ribs and rectangular pin-fins shapes, using two obstacles height H to diameter, H/D ratio of 1.38 and 2.45. Computations were carried out for three different mass flux G of 1.08, 1.48 and 1.94 kg/sm2. Relative pressure loss ∆P/P and surface average heat transfer coefficient (HTC) h predictions for the range of G, showed good agreement with the experimental results. The prediction also reveals that obstacles not only increases the turbulent flows, but also takes away most of the cooling heat transfer that produces the regions with highest thermal gradients. It also reduces the impingement gap downstream cross-flow.
We have compiled the most important slides from each speaker's presentation. This year’s compilation, available for free, captures the key insights and contributions shared during the DfMAy 2024 conference.
Hybrid optimization of pumped hydro system and solar- Engr. Abdul-Azeez.pdffxintegritypublishin
Advancements in technology unveil a myriad of electrical and electronic breakthroughs geared towards efficiently harnessing limited resources to meet human energy demands. The optimization of hybrid solar PV panels and pumped hydro energy supply systems plays a pivotal role in utilizing natural resources effectively. This initiative not only benefits humanity but also fosters environmental sustainability. The study investigated the design optimization of these hybrid systems, focusing on understanding solar radiation patterns, identifying geographical influences on solar radiation, formulating a mathematical model for system optimization, and determining the optimal configuration of PV panels and pumped hydro storage. Through a comparative analysis approach and eight weeks of data collection, the study addressed key research questions related to solar radiation patterns and optimal system design. The findings highlighted regions with heightened solar radiation levels, showcasing substantial potential for power generation and emphasizing the system's efficiency. Optimizing system design significantly boosted power generation, promoted renewable energy utilization, and enhanced energy storage capacity. The study underscored the benefits of optimizing hybrid solar PV panels and pumped hydro energy supply systems for sustainable energy usage. Optimizing the design of solar PV panels and pumped hydro energy supply systems as examined across diverse climatic conditions in a developing country, not only enhances power generation but also improves the integration of renewable energy sources and boosts energy storage capacities, particularly beneficial for less economically prosperous regions. Additionally, the study provides valuable insights for advancing energy research in economically viable areas. Recommendations included conducting site-specific assessments, utilizing advanced modeling tools, implementing regular maintenance protocols, and enhancing communication among system components.
Cosmetic shop management system project report.pdfKamal Acharya
Buying new cosmetic products is difficult. It can even be scary for those who have sensitive skin and are prone to skin trouble. The information needed to alleviate this problem is on the back of each product, but it's thought to interpret those ingredient lists unless you have a background in chemistry.
Instead of buying and hoping for the best, we can use data science to help us predict which products may be good fits for us. It includes various function programs to do the above mentioned tasks.
Data file handling has been effectively used in the program.
The automated cosmetic shop management system should deal with the automation of general workflow and administration process of the shop. The main processes of the system focus on customer's request where the system is able to search the most appropriate products and deliver it to the customers. It should help the employees to quickly identify the list of cosmetic product that have reached the minimum quantity and also keep a track of expired date for each cosmetic product. It should help the employees to find the rack number in which the product is placed.It is also Faster and more efficient way.
Saudi Arabia stands as a titan in the global energy landscape, renowned for its abundant oil and gas resources. It's the largest exporter of petroleum and holds some of the world's most significant reserves. Let's delve into the top 10 oil and gas projects shaping Saudi Arabia's energy future in 2024.
CW RADAR, FMCW RADAR, FMCW ALTIMETER, AND THEIR PARAMETERSveerababupersonal22
It consists of cw radar and fmcw radar ,range measurement,if amplifier and fmcw altimeterThe CW radar operates using continuous wave transmission, while the FMCW radar employs frequency-modulated continuous wave technology. Range measurement is a crucial aspect of radar systems, providing information about the distance to a target. The IF amplifier plays a key role in signal processing, amplifying intermediate frequency signals for further analysis. The FMCW altimeter utilizes frequency-modulated continuous wave technology to accurately measure altitude above a reference point.
Using recycled concrete aggregates (RCA) for pavements is crucial to achieving sustainability. Implementing RCA for new pavement can minimize carbon footprint, conserve natural resources, reduce harmful emissions, and lower life cycle costs. Compared to natural aggregate (NA), RCA pavement has fewer comprehensive studies and sustainability assessments.
Industrial Training at Shahjalal Fertilizer Company Limited (SFCL)MdTanvirMahtab2
This presentation is about the working procedure of Shahjalal Fertilizer Company Limited (SFCL). A Govt. owned Company of Bangladesh Chemical Industries Corporation under Ministry of Industries.
Final project report on grocery store management system..pdfKamal Acharya
In today’s fast-changing business environment, it’s extremely important to be able to respond to client needs in the most effective and timely manner. If your customers wish to see your business online and have instant access to your products or services.
Online Grocery Store is an e-commerce website, which retails various grocery products. This project allows viewing various products available enables registered users to purchase desired products instantly using Paytm, UPI payment processor (Instant Pay) and also can place order by using Cash on Delivery (Pay Later) option. This project provides an easy access to Administrators and Managers to view orders placed using Pay Later and Instant Pay options.
In order to develop an e-commerce website, a number of Technologies must be studied and understood. These include multi-tiered architecture, server and client-side scripting techniques, implementation technologies, programming language (such as PHP, HTML, CSS, JavaScript) and MySQL relational databases. This is a project with the objective to develop a basic website where a consumer is provided with a shopping cart website and also to know about the technologies used to develop such a website.
This document will discuss each of the underlying technologies to create and implement an e- commerce website.
2. Yusuf and Ogunlela.: Effect of Magnetic Treatment of Water on Evapotranspiration of Tomato
AZOJETE, 13(1):86-96. ISSN 1596-2490; e-ISSN 2545-5818, www.azojete.com.ng
87
Reference evapotranspiration is the evapotranspiration from a hypothetical reference crop
with an assumed height of 0.12 m, a fixed surface resistance of 70s/m and an albedo of 0.23.
The reference surface closely resembles an extensive area of actively growing grass of
uniform height completely shading the ground and with sufficient soil moisture (Adeboye, et
al, 2009; Allen et al., 1998 as cited by Ejieji, 2011; Trajikovic and Gocic, 2010). Albedo is
the fraction of the solar radiation which is reflected by the earth’s surface and the value
depends on the type of surface, angle of the incidence of sun’s rays and slope of the ground
surface (Michael, 2008). Reference evapotranspiration provides information on the
evaporation demand of the atmosphere which is independent of the type of crop, its stage of
development and the management practices. Soil factors do not affect reference
evapotranspiration (Chineke et al., 2011 and Michael, 2008). Reference evapotranspiration
can be computed from weather data in a given location at any period of the year.
Different methods are available for the determination of reference evapotranspiration as
highlighted in Michael (2008). The objectives of this study were to determine the effect of
magnetic treatment of water on the evapotranspiration and growth of tomato plant and.
2. Materials and Methods
The study was carried out at the Research farm land of the Department of Agricultural and
Biosystems Engineering, University of Ilorin, Ilorin, Kwara State, Nigeria. Ilorin lies on the
latitude 8o
30¹N and longitude 4o
35¹E at an elevation of about 340 m above mean sea level
(Ejieji and Adeniran, 2009). Ilorin is in the Southern Guinea Savannah Ecological zone of
Nigeria with annual rainfall of about 1300 mm. The wet season begins towards the end of
March and ends in October while the dry season starts in November and ends in March
(Ogunlela, 2001). The temperatures from the wet and dry bulb thermometer in the transparent
garden shed where the tomato was grown between 23rd
September 2014 and 30th
January
2015 varied from 16.5 to 30.0 o
C (wet bulb) and 23.5 to 38.0 o
C (dry bulb) with relative
humidity of 50 to 90 %.
The magnetic flux densities used for treating the irrigation water were 124, 319 and 719 G
(three treatments) inside the treatment chamber and a control experiment. The chemical
properties of water before and after passing through magnetic field and the chemical
properties of soil were shown in Table 1. Each of the treatment was replicated seven times
and the tomato irrigated with non – magnetically treated water was also replicated seven
times given a total of twenty eight (28) buckets containing tomato plant. The tomato was
planted in the buckets on 23rd
September, 2014 and equal volume of water (1.3 litres) was
applied to each tomato at three (3) days irrigation interval but this irrigation interval reduced
to 2 days at flowering/fruiting stage because water demand was higher and the value of crop
coefficient (kc) changed from 1.05 at 80 % canopy cover to 1.15 at 100 % canopy cover.
Ufoegbune el at. (2012) also pointed out that the growing period of tomato was 150 days and
the values of kc for initial growth stage, development stage, flowering/ fruiting stage and
ripening stage were 0.45, 0.75, 1.15 and 0.80 respectively. Each of the 28 buckets was
weighed immediately after irrigation and also weighed before the next irrigation after 2 or 3
days. The soil used was loam sand and the percentage contents of silt, clay and sand were
8.67, 5.76 and 85.57%, respectively. The irrigation water was allowed to pass through the
electromagnetic treatment chamber four (4) times for duration of 113 s for effective treatment
3. Arid Zone Journal of Engineering, Technology and Environment, February, 2017; Vol. 13(1):86-96.
ISSN 1596-2490; e-ISSN 2545-5818; www.azojete.com.ng
88
using circulation flowing method through magnetic field (Shoaili, 2003 as cited by Chern,
2012 and Mdsa’at, 2006).
Evapotranspiration of tomato, available water, net depth of irrigation requirement,
irrigation interval and volume of required by tomato were determined from Equations (1),
(2), (3), (4) and (5).
(1)
( )
(2)
(3)
(4)
(5)
where ETc is the crop evapotranspiration (mm/day), Kc is the crop coefficient, ETo is the
reference evapotranspiration (mm/day), ρb is soil bulk density (g/cm3
), ρw is the density of
water (g/cm3
), FC is the field capacity of the soil (%), Db is depth of the bucket (mm), Aw is
the available water (mm), WP is the wilting point (%), Iv is the irrigation interval (day), dn is
the net depth of irrigation (mm), Vdp is the volume of water required daily per plant
(litre/day), Cc is the crop canopy (%), Ap is the area of the bucket (mm2
) and Np is the number
of tomato stand in a bucket and Vdays is the volume of required by the tomato plant according
to the number of days of irrigation interval. The values of ETc, AW, dn, Iv, Vdp and Vdays were
determined as follows when the kc was 1.05, ETo was 4.7 mm/day, ρb was 1.433 g/cm3
, ρw
was 1.000 g/cm3
, FC was 26.98 %, WP was 12.26 %, Np was 2, Iv was 3 days and irrigation
was done when 30 % of the irrigation water was depleted.
Table 1: Chemical properties of the soil and water used for irrigating the tomato plant
Chemical properties of soil Chemical properties of water (mg/L)
Element Mean Element MTW NMTW
pH 5.8 pH 7.46 7.36
N (%) 0.64 Ca+2
3.197 3.130
P (mg/kg) 2.74 Mg+2
1.229 1.285
Ca2+
(cmol/kg) 1.37 K+
0.888 0.885
Mg2+
(cmol/kg) 0.84 Na+
80.55 81.91
K+
(cmol/kg) 2.24 Pb+2
0.297 0.300
Na+
(cmol/kg) 1.15 N (NO3
-
) 43.07 42.73
Organic matter (%) 1.31 SO4
-2
50.06 47.80
Organic carbon (%) 0.86 P 0.654 0.670
C.E.C 5.74 Viscosity (x 10-6
Ns/m)
1.773 1.815
MTW = Magnetically-treated water, NMTW = Non-magnetically-treated water (water
before passing through magnetic field)
2.1 Determination of the mass of water lost due to evapotranspiration
Mass of water lost due to evapotranspiration was determined directly from the bucket
containing the tomato plant by weighing method (lysimeteric method). Each bucket with
three treatments and the treatment was replicated seven times. Each bucket was weighed
4. Yusuf and Ogunlela.: Effect of Magnetic Treatment of Water on Evapotranspiration of Tomato
AZOJETE, 13(1):86-96. ISSN 1596-2490; e-ISSN 2545-5818, www.azojete.com.ng
89
immediately after the irrigation and later weighed again before the next irrigation. The
difference in the weight of the bucket was due to evapotranspiration because there was no
space for percolation of irrigation water to the soil surface and become underground water.
The mass of water lost to the atmosphere was due to evapotranspiration in kg which was
equivalent to volume of water in litre as determined in 2.3 with the computed
evpotranspiration in mm/day was shown in Table 2. Two samples of the readings obtained
from the field measurement (raw data) were shown in Appendices A and B.
2.2 Determination of the volume of water lost due to evapotranspiration
The volume of water lost due to evapotranspiration was calculated from the mass of
water lost to the atmosphere from the bucket containing the soil and tomato plant. Volume of
water lost to evapotranspiration was determined from Equation (8) derived from Equations
(6) and (7).
(6)
(7)
(8)
where ρw is the density of water (kg/m3
), Mw is the mass of lost due to evapotranspiration
(kg), Vw is the volume of water lost from the bucket to evapotranspiration (m3
) and VWL is
volume of water lost due to evapotranspiration (litres, L). The volume of water lost from each
bucket for illustration was calculated as shown in the following expressions which were
presented in Table 3. From the following calculations, mass of water lost from the bucket in
kg is the same as volume of water lost from the bucket due to evapotranspiration in (L).
2.3 Computation of evapotranspiration from mass of water lost due to ET
Evapotranspiration (ET) of tomato in mm/day due to mass of water lost to atmosphere from
the bucket was computed using Equation (9). An example of the computation for ETc value
was shown in the following expression when the values of VWL and AP (area of the bucket)
were 0.508 L (mass of water lost to ETc = 0.508 kg/day ≡ 0.508 L/day) and 0.05433m2
,
respectively. The result of the mean values of evapotranspiration of tomato (ETc) and volume
or mass of water lost from the bucket to the atmosphere was shown in Table 2.
(9)
for two stands of tomato plant per bucket.
3. Results and Discussions
The result of mass of water lost due to evapotranspiration which was evapotranspiration from
the tomato in the bucket was shown in Table 2. The mass of water lost in kg was equivalent
to the volume of water lost to evapotranspiration in litre as density of water is equal to 1000
kg/m3
. The value of mass of water lost to atmosphere daily was higher with tomato plant
irrigated with the magnetically treated water (MTW) than the water lost from non–
magnetically treated water (NMTW). This increased in the rate of water absorption for
evapotranspiration in which 1 % of evapotranspiration is needed for metabolic processes of
tomato plant which could contribute to the high growth rate of the tomato plant.
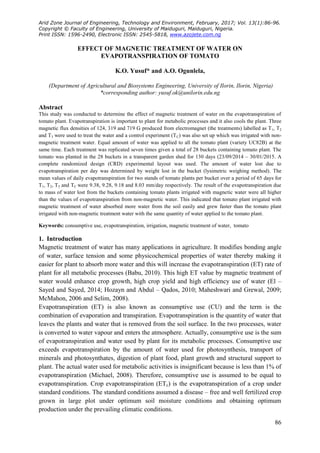
5. Arid Zone Journal of Engineering, Technology and Environment, February, 2017; Vol. 13(1):86-96.
ISSN 1596-2490; e-ISSN 2545-5818; www.azojete.com.ng
90
The graph shown in Figure 1 indicated that evapotranspiration of tomato MTW by 124, 319
and 719 G (T1, T2 and T3) were higher than the evapotranspiration of tomato from NMTW
(Tc). The mean values of the evapotranspiration of the tomato plant over the period of 65
days in the transparent garden shed were 9.38, 9.28, 9.18 and 8.03 mm/day, respectively.
The bar chart in Figure 2 also indicated that tomato plant absorbed more water from the soil
in the buckets containing magnetized water than the tomato in the non – magnetized water
with evapotranspiration increased by 14.32 to 16.81 %. The rate of water absorption by the
tomato plant for evapotranspiration was statistically significant. The calculated values of F
were 8.10 and 7.08 while the Table value of F was 2.78 as shown in Tables 3 and 4. This
means that for one stand of tomato plant in the bucket, the mean values of ETc for T1, T2, T3
and Tc were 4.69, 4.64, 4.59 and 4.02 mm/day while the theoretical ETc of tomato calculated
as the water requirement of tomato at 80 % canopy cover in this study was 4.94 mm/day.
This indicated that the mean values of ETc of tomato obtained by direct method (lysimetric
method) from the bucket over a period of 65 days were close to the theoretical value of ET at
its peak value. Similarly, the mean values of ETc obtained in this study for one stand of
tomato plant by direct method were within the same values of the actual irrigation water
requirement (ETc) of drip irrigated tomato crop grown in tropical greenhouse environment
varied from 4.1 to 5.6 mm/day (Harmanto et al., 2005). Tomato plant in the transparent
garden shed at 45 days irrigated with magnetically treated water (MTW) was shown in Fig. 3.
The results of evapotranspiration showed that tomato plant absorbed more water from
magnetically treated water than the non – magnetically treated water when the same quantity
of water was applied to the tomato plant. This increased the rate of vegetative growth of
tomato plant as shown in Table 5. This was in agreement with research of Helal (2010) in
which he reported that magnetic treatment of water had effect on plant by increasing the
activities of antioxidant enzymes, photosynthetic activity and photosynthetic pigments which
enhanced the plants growth and productivity. The results of growth rate and
evapotranspiration obtained from magnetically treated water were higher than the growth and
evapotranspiration from the non – magnetic treated water which was also in agreement that
magnetic treatment of water increased the nutrient uptake (Aoda and Fattah, 2011 and Babu,
2010).
6. Yusuf and Ogunlela.: Effect of Magnetic Treatment of Water on Evapotranspiration of Tomato
AZOJETE, 13(1):86-96. ISSN 1596-2490; e-ISSN 2545-5818, www.azojete.com.ng
91
Table 2: Mean value of the mass of water lost due to evapotranspiration (ETc) and the daily
ET of tomato plant for 65 days (two stands of tomato plant per bucket)
S/No Date
Mass of water lost due to
evapotranspiration (kg/day)
Computed evapotranspiration of
tomato due to water lost (mm/day)
T1 T2 T3 TC T1 T2 T3 TC
1 27-30/10/2014 0.508 0.535 0.466 0.381 9.35 9.85 8.58 7.01
2 01-03/11/2014 0.290 0.370 0.355 0.375* 5.34 6.81 6.53 6.90*
3 05-09/11/2014 0.333 0.330 0.355 0.293 6.13 6.07 6.53 5.39
4 09-11/11/2014 0.380 0.400 0.372 0.332 6.99 7.36 6.85 6.12
5 12-14/11/2014 0.455 0.490 0.470 0.440 8.37 9.02 8.66 8.10
6 14-16/11/2014 0.375 0.390 0.385 0.335 6.90 7.18 7.09 6.17
7 16-18/11/2014 0.585 0.560 0.565 0.565 10.77 10.31 10.40 10.40
8 18-19/11/2014 0.400 0.400 0.420 0.220 7.36 7.36 7.73 4.05
9 19-22/11/2014 0.503 0.497 0.533 0.460 9.26 9.15 9.81 8.47
10 22-24/11/2014 0.360 0.355 0.375 0.285 6.63 6.53 6.90 5.25
11 25-28/11/2014 0.457 0.450 0.473 0.433 8.41 8.28 8.71 7.97
12 28-30/11/2014 0.565 0.520 0.515 0.490 10.40 9.57 9.48 9.02
13 30-02/12/2014 0.520 0.520 0.535 0.455 9.57 9.52 9.85 8.37
14 02-12/12/2014 0.590 0.570 0.605 0.500 10.86 10.49 11.14 9.20
15 04-07/12/2014 0.533 0.480 0.483 0.467 9.81 8.83 8.89 8.60
16 07-10/12/2014 0.470 0.477 0.467 0.350 8.65 8.78 8.60 6.44
17 10-12/12/2014 0.535 0.470 0.485 0.405 9.85 8.65 8.93 7.45
18 12-15/12/2014 0.473 0.447 0.443 0.397 8.71 8.23 8.15 7.31
19 15-17/12/2014 0.500 0.520 0.485 0.425 9.20 9.57 8.93 7.82
20 17-19/12/2014 0720 0.725 0.690 0.565 13.25 13.34 12.70 10.40
21 19-22/12/2014 0.393 0.440 0.420 0.347 7.23 8.10 7.73 6.39
22 22-24/12/2014 0.660 0.605 0.540 0.470 12.15 11.14 9.94 8.65
23 24-26/12/2014 0.695 0.605 0.655 0.605 12.79 11.14 12.06 11.14
24 27-29/12/2014 0.730 0.775 0.745 0.650 13.44 14.26 13.71 11.96
25 29-31/12/2014 0.710 0.675 0.635 0.660 13.07 12.42 11.69 12.15
Mean 0.510 0.504 0.499 0.436 9.38 9.28 9.18 8.03
ET for 1 tomato stand 0.255 0.252 0.250 0.218 4.69 4.64 4.59 4.02
T1=magnetic water treated with 124 G, T2 = 319 G, T3 = 719 G and TC = non-magnetic
water.
* = mass of water lost/evapotranspiration in which Tc (control experiment) was greater
than the value obtained from T1, T2 and T3 (each treatment was replicated 7 times).
Table 3: ANOVA for the evapotranspiration of tomato plant (data obtained on 27–30
October, 2014)
Source of
error
Degree of
freedom (D.F)
Sum of square
(SS)
Mean square
(MS)
Calculated F Tabular F at
P ≤ 5 %
Treatment 3 32.30 10.77 8.10 2.78
Error 24 31.90 1.33
Total 27
Table 4: ANOVA for the evapotranspiration of tomato plant (data obtained on 18–19
November, 2014)
Source of
error
Degree of
freedom (D.F)
Sum of square
(SS)
Mean square
(MS)
Calculated F Tabular F at
P ≤ 5 %
Treatment 3 62.704 20.901 7.08 2.78
Error 24 70.819 2.951
Total 27 133.523
7. Arid Zone Journal of Engineering, Technology and Environment, February, 2017; Vol. 13(1):86-96.
ISSN 1596-2490; e-ISSN 2545-5818; www.azojete.com.ng
92
Table 5: Mean heights of the tomato plant during vegetative growth
T1=124 G, T2=319 G, T3=719 G and TC = 0.0 G (TC = Non – magnetically treated water) but
T1, T2 and T3 were magnetic water treated with the respective flux densities.
T1= Magnetized water treated with 124 G, T2 = 319 G, T3 = 719 G and TC = 0 G (Non –
magnetized water).
Figure 1: Evapotranspiration of tomato plant obtained by direct method
Figure 2: Mean evapotaranspiration of two stands of tomato plant per bucket over a
period of 65 days (from 34 days after planting to maturity stage)
0
2
4
6
8
10
12
14
16
27-30/10/2014
01-03/11/2014
05-09/11/2014
09-11/11/2014
12-14/11/2014
14-16/11/2014
16-18/11/2014
18-19/11/2014
19-22/11/2014
22-24/11/2014
25-28/11/2014
28-30/11/2014
30-02/12/2014
02-12/12/2014
04-07/12/2014
07-10/12/2014
10-12/12/2014
12-15/12/2014
15-17/12/2014
17-19/12/2014
19-22/12/2014
22-24/12/2014
24-26/12/2014
27-29/12/2014
29-31/12/2014
Evapotranspiration(mm/day)
T1
T2
T3
TC
7
7.5
8
8.5
9
9.5
T1 T2 T3 TC
T1
T2
T3
TC
Date Days after
planting
Tomato plant height (mm)
T1 T2 T3 TC
19/10/2014 26 154.3 178.6 199.3 137.1
25/10/2014 32 302.1 325.0 330.0 243.6
30/10/2014 37 446.4 453.6 457.9 345.7
03/11/2014 41 515.0 532.0 530.0 407.9
09/11/2014 47 560.0 556.4 588.6 469.3
8. Yusuf and Ogunlela.: Effect of Magnetic Treatment of Water on Evapotranspiration of Tomato
AZOJETE, 13(1):86-96. ISSN 1596-2490; e-ISSN 2545-5818, www.azojete.com.ng
93
Figure 3: Tomato plant in garden shed at 45 days irrigated with magnetically treated water
4. Conclusion
Magnetic treatment of irrigation water increased the rate of water absorption by plant for
evapotranspiration by 1.25 to 1.35 mm/day for two stands of tomato per bucket which
eventually increased the rate of vegetative growth of the tomato plant.
References
Adeboye, OB., Osunbitan, JA., Adekalu, KO. and Okunade, DA. 2009. Evaluation of FAO-
56 Penman-Monteith and temperature based models in estimating reference
evapotranspiration using complete and limited data, application to Nigeria. CIGR
Journal Manuscript No 1291, Vol. XI: 1 – 25.
Anand, A., Nagarajan, S., Verma, APS., Joshi, DK., Pathak, PC. and Bhardwaj, J. 2012. Pre
treatment of seeds with static magnetic field ameliorates soil water stress in seedling of maize
(Zea mays L.), Indian Journal of Biochemistry and Biophysics, 49(1): 63 – 70.
Aoda, MI. and Fattah, MA. 2011. The interactive effects of water magnetic treatment and
deficit irrigation on plant productivity and water use efficiency of corn (Zea mays L.) Iraqi
Journal of Agricultural Sciences, 42:164-179.
Babu, C. 2010. Use of magnetic water and polymer in agriculture. Tropical Research, ID 08
– 806 – 001.
Chern, CC. 2012. Application of magnetic water to stimulate the lady’s finger
(Abelmosculentus L.) moench plant growth. B. Eng. Thesis submitted to Faculty of Civil
Engineering, University of Technology, Malaysia.
Chineke, TC., Idinoba, ME and Ajayi, OC. 2011. Seasonal ET signatures under a changing
land scope and ecosystem management in Nigeria implication for agriculture and food
security”. American journal of scientific and industrial research 2(2):191-204.
9. Arid Zone Journal of Engineering, Technology and Environment, February, 2017; Vol. 13(1):86-96.
ISSN 1596-2490; e-ISSN 2545-5818; www.azojete.com.ng
94
Ejieji CJ. 2011. Performance of three empirical reference evapotranspiration models under
three sky conditions using two solar radiation estimation methods at Ilorin, Nigeria. CIGR
Journal Manuscript No 1673, 13 (3): 1 – 21.
Ejieji, CJ and Adeniran, KA. 2009. Effect of water and fertilizer stress on the yield, fresh and
dry matter production of grain amaranth. Australian Journal of Agricultural Engineering,
1(1):18-24.
El - Sayed, H. and Sayed A. 2014. Impact of magnetic water irrigation for improving the
growth, chemical composition and yield production of broad bean (Vicia faba L.) plant.
American Journal of Experimental Agriculture, 4(4): 476-496.
Harmanto, Salokhe, VM, Babel, MS. and Tantau, HJ. 2005. Water requirement of drip
irrigated tomatoes grown in greenhouse in tropical environment. Elsevier Journal of
Agricultural Water Management, 71: 225 – 245.
Helal, RM. 2010. The impact of magnetic water application for improving common bean
(Pheseolus vulgaris L) production. New York Science Journal, 4 (6):15-20.
Hozayn, M. and Abdul- Qados, AMS. 2010 Irrigation with magnetized water enhances
growth, chemical constituent and yield of chickpea (Circer arietinum L.). Agriculture and
Biology Journal of North America, 1(4): 671 – 676.
Maheshwari, RL. and Grewal, HS. 2009. Magnetic treatment of irrigation water: its effects on
vegetable crop yield and water productivity. Journal of Agricultural Water Management, 96
(8) :1229-1236
McMahon, CA. 2006. Investigation of the quality of water treated by magnetic fields. B. Eng.
Thesis, University of Southern Queensland.
Mdsa’at SK. 2006. Subsurface flow and free water surface flow constructed wetland with
magnetic field for leachate treatment. M.Eng. Thesis submitted to Faculty of Civil
Engineering, University of Technology, Malaysia.
Michael, AM. 2008. Irrigation theory and practice. 2nd
Edition, Vikas Publishing Ltd, New
Delhi.
Ogunlela, AO. 2001. Stochastic Analysis of Rainfall Events in Ilorin, Nigeria. Journal of
Agricultural Research and Development, 39 – 49.
Selim, MM. 2008. Application of Magnetic Technologies in Correcting Under Ground
Brackish Water for Irrigation in the Arid and Semi-Arid Ecosystem, The 3rd International
Conference on Water Resources and Arid Environments, and the 1st Arab Water Forum.
Trajikovic, S. and Gocic, M. 2010. Comparison of some empirical equations for estimating
daily reference evapotranspiration. Journal of Architecture and Civil Engineering, University
of Nis, 8 (20): 163 – 168.
Ufoegbune, GC., Bello, NJ., Dada, OF., Eruola, AC., Makinde, AA. and Amori, AA. 2012.
Estimating water availability for agriculture in Abeokuta south western Nigeria. Global
Journal of Science Frontier Research Agricultural and Veterinary Sciences, 12 (9) version 1:
13 – 24.
10. Yusuf and Ogunlela.: Effect of Magnetic Treatment of Water on Evapotranspiration of Tomato
AZOJETE, 13(1):86-96. ISSN 1596-2490; e-ISSN 2545-5818, www.azojete.com.ng
95
Appendix A Mass of the bucket with tomato plant recorded in the consumptive use experiment for the determination of
evapotranspiration for the first and second readings.
T1,T2, T3 and Tc were as previously defined in Table 2
Row Mass of the bucket with tomato plant for evapotranspiration (kg)
Date T1 T2 T3 Tc Date T1 T2 T3 TC
1 15.08 14.91 14.63 15.03 13.21 12.98 13.15 13.89
2 15.31 14.74 14.80 15.82 13.61 13.38 13.72 14.57
3 27/10/2014 15.82 15.48 15.48 16.10 30/10/2014 14.17 14.06 14.06 14.91
4 15.48 15.65 15.37 15.25 14.00 14.00 13.83 14.17
5 15.88 16.95 14.97 15.93 14.46 15.20 13.32 14.74
6 16.56 15.65 15.54 16.67 15.37 14.06 14.17 15.65
7 15.76 15.88 15.82 15.42 14.40 14.34 14.57 14.29
11. Arid Zone Journal of Engineering, Technology and Environment, February, 2017; Vol. 13(1):86-96.
ISSN 1596-2490; e-ISSN 2545-5818; www.azojete.com.ng
96
Appendix B Mass difference in the bucket due to water lost to evapotranspiration in the consumptive use experiment.
T1, T2, T3 and Tc were as previously defined in Table 2
Row Mass difference in the bucket due to water lost to evapotranspiration (kg)
Date T1 T2 T3 Tc Date T1 T2 T3 TC
1 1.87 1.93 1.48 1.14 0.54 0.74 1.08 0.91
2 1.70 1.36 1.08 1.25 0.57 0.96 0.79 0.62
3 27/10/2014 1.65 1.42 1.42 1.19 01/11/2014 0.51 0.62 0.62 0.74
4 to 1.48 1.65 1.54 1.08 to 0.57 0.74 0.57 0.74
5 30/10/2014 1.42 1.75 1.65 1.19 03/11/2014 0.51 0.74 0.74 0.62
6 1.19 1.59 1.37 1.02 0.51 0.68 0.57 0.74
7 1.36 1.54 1.25 1.13 0.85 0.68 0.57 0.85
Mean 1.524 1.606 1.399 1.143 Mean 0.58 0.74 0.71 0.75
Kg/day 0.508 0.535 0.466 0.381 Kg/day 0.290 0.370 0.355 0.375
mm/day 9.35 9.85 8.58 7.01 mm/day 5.34 6.81 6.53 6.90