SlideShare a Scribd company logo
International Journal of Environment, Agriculture and Biotechnology (IJEAB) Vol-2, Issue-1, Jan-Feb- 2017
http://dx.doi.org/10.22161/ijeab/2.1.41 ISSN: 2456-1878
www.ijeab.com Page | 319
Performance evaluation and characterization of
wetted soil parameters of improvised medi-
emitters installed in a drip irrigation tomato field
Awe G.O.1
, Abegunrin T.P.2*
, Ojediran J.O.2
, Oyetoro O.O.2
1
Department of Crop, Soil and Environmental Sciences, Faculty of Agricultural Sciences, Ekiti State University, Ado Ekiti,
Nigeria.
2
Department of Agricultural Engineering, Faculty of Engineering and Technology, Ladoke Akintola University of Technology,
Ogbomoso, Nigeria.
Abstract— Field study was conducted to evaluate the
emission uniformity (EU), global coefficient of variation
(CGv), emitter flow variation (Qvar) and distribution
uniformity (DU), and determine the wetted radius (rw) on
soil surface of improvised medi-emitters installed in a
tomato field. Soil water content (SWC) at four layers was
determined after different periods of irrigation. Radius of
wetted soil surface was determined and predicted.
Irrigation frequency had no significant effect on the
average discharge rate of the medi-emitters throughout the
growing cycle. Average Qvar and CGv were significantly
(P=0.05) influenced by the frequency of application while
the EU and DU did not significantly (P=0.05) differ among
the treatments. There were significant differences in the
average values of SWC in different soil layers under the
different periods of irrigation. Both the observed and
calculated rw on the soil surface were fitted with fourth
order polynomial. The model performance parameters of
MAE and RMSE between the calculated and observed radii
were low, indicating good prediction. Medical infusion set
can successfully replace the more expensive conventional
emitters for drip irrigation system.
Keywords— Medical infusion set, conventional emitters,
wetted soil radius, soil water status.
I. INTRODUCTION
One of the advocated strategies of averting the impending
water crisis is the emphasis on increased water use
efficiency from the irrigation sub-sector, and one way of
ensuring efficient utilization of irrigation water is for
farmers to switch over from the traditional surface flooding
method and adopt highly efficient irrigation system, the drip
irrigation systems. The drip irrigation system has become
the best method of water application that has been used
globally over other irrigation systems. Drip irrigation
system supplies frequent and small amounts of irrigation
water at single or many points to the field
surface/subsurface within the plant root zone (Decroix and
Malaval 1985; Youngs et al. 1999). According to Khan et
al. (2014), drip irrigation system is one of the best methods
with frequent, slow application of water either directly on
the land or into the crop root zone rather than the entire land
surface, which ensures optimum water content in the root
zone.
In Nigeria, conventional pipes and emission devices used
for most of the outstanding schemes of drip irrigations,
though very efficient and adequate, are imported (Awe and
Ogedengbe 2011). However, the devaluation of the local
currency in the international market currently being
experienced has make these items to be expensive,
becoming unaffordable to rural and peasant farmers who
make the bulk of agricultural sector. Consequently, of an
estimated 71 million hectares of arable land, only about 7
per cent is being irrigated (Muhammad-Lawal et al. 2013)
with the remaining area depending on rainfall. However, the
high variability and uneven temporal distribution of rainfall
in recent times have made rain-fed agriculture to be under
threat. It was in line of this that the FAO (2010)listed
Nigeria amongst the countries that are technically unable to
meet their food demands from rain-fed farming. Therefore,
the search for and use of locally available materials for
irrigation are now promoted with a view to increasing
productivity and ensuring food security.
Recently, the concept of affordable micro-irrigation systems
has been identified as a commensurate drip technology for
low-income farmers and these systems have posed
momentous potential for efficient agricultural water use
(Mofoke et al. 2004). For example, low-cost micro-
irrigation systems in use today include the drum and bucket
drip kits (Cornish and Brabben 2001), and the Nica
International Journal of Environment, Agriculture and Biotechnology (IJEAB) Vol-2, Issue-1, Jan-Feb- 2017
http://dx.doi.org/10.22161/ijeab/2.1.41 ISSN: 2456-1878
www.ijeab.com Page | 320
Irrigation (Anon. 2003) which apply water in pulses often
more than once a day. In other to evaluate the efficiency
and applicability of these systems, considerable studies
have been conducted with success (e.g. Polak et al.1997;
Bissrat et al.2001; Masimba 2003).
Recently too, medical infusion set, otherwise known as
medi-emitter, used mainly in hospitals and clinics for
transfusion purposes has been successfully adopted as
emitters in drip irrigation. Mofoke et al. (2004) first used
medi-emitters and reported satisfactory performance as
drippers for a continuous-flow drip irrigation system
installed in tomato plots in Awe and Ogedengbe (2011)
employed medi-emitters in conjunction with bamboo
laterals, the authors found that the locally sourced materials
performed well with variation in medi-emitter discharge not
more than 10.21 percent, low manufacturer’s CV (3.35) and
high statistical uniformity coefficient (98.33%) and
distribution uniformity (97.69%). One shortcoming about
these two studies is that the medi-emitters were calibrated to
supply to the field in drops of water per minutes, in other
words, they were not calibrated to supply water to the field
at discharge rates that could be comparable to those of
conventional emitters, therefore there is gap in knowledge
on how the improvised systems perform over time.
Drip irrigation can potentially have high application
efficiency and high distribution uniformity, which are very
important in ensuring uniformly and high crop yields as
well as preserving water quality, especially when both water
and fertilizers are applied through the irrigation system.
However, the uniformity and general performance of micro-
irrigation systems are affected by several factors including
manufacturer’s coefficient of variation, grouping of emitters
and emitter clogging, water temperature, water quality,
among others (Frizzone 1997). The hydraulic of the system
and topography of the field also cause variation in pressure
head at individual outlet. According to Solomon (1984), as
the pressure variation in drip irrigation system increases,
both the uniformity and application efficiency tend to
reduce, causing increase in water losses and leading to over-
or under-irrigation. In addition, improper maintenance of
irrigation system can cause the uniformity to decrease,
resulting in increased water application to compensate for
decreased application uniformity or reduced yields (Sammis
and Wu 1985). Therefore, tests to evaluate performance,
related to resistance and durability of irrigation system,
defined through technical specification rules are required.
The aim of evaluating the operation of irrigation systems is
for better understanding of the adequacy and determination
of the necessary procedures required for improving the
system. According to Awe and Ogedengbe (2011), such
evaluation should be carried out soon after the system
installation in the field and periodically repeated until
harvest. This is because drip irrigation systems are sensitive
to operational conditions over time (Keller and Blisner
1990; Soccol et al. 2002). Therefore, the objective of this
study was to evaluate the performance and determine the
wetted radius on soil surface of improvised medi-emitters
installed in a tomato field under different drip irrigation
frequency.
II. MATERIALS AND METHODS
Description of study site
The experiment was conducted at the Teaching and
Research Farm of Ladoke Akintola University of
Technology, Ogbomoso southwest Nigeria. The field is
located on Latitude 8.168343o
N, Longitude 4.269921o
E and
Altitude 357 m. Ogbomoso is characterized by bimodal
rainfall pattern, peaking in July and September with annual
rainfall depth of about 1200 mm (Abegunrin et al. 2013)
while the mean annual maximum and minimum temperature
are 33 and 28o
C, respectively. The climate is cold and dry
from November to March and then warm and moist from
April to October, it could also be described as a hot humid
tropical which falls in southern Guinea Savannah of Nigeria
with mean relative humidity of about 74% all year round
except in the months of December to February when it is
low as a result of dry wind (harmattan) that blows from the
north (Olaniyi et al.2010), while the soil of the site is
classified as Hapludalf (SSS 2006), with the textural
analysis showing sandy loam texture. Some physical and
chemical properties of the 0-30 cm layer are presented in
Table 1.
Table.1: Some soil physical chemical properties of the site before the experiment.
Soil pH SOM BD Sand Silt Clay
depth, cm % g/cm3
-------------%------------ Texture
0-5 7.2 1.8 1.48 80.5 8.1 11.4 SL
5-10 6.8 1.2 1.62 77.6 12.0 10.4 SL
10-20 6.6 1.2 1.70 79.7 10.1 10.2 SL
20-30 6.2 1.0 1.73 76.3 13.2 11.5 SL
pH: level of alkalinity or acidity, SOM: soil organic matter, BD: bulk density, SL: sandy loam.
International Journal of Environment, Agriculture and Biotechnology (IJEAB) Vol-2, Issue-1, Jan-Feb- 2017
http://dx.doi.org/10.22161/ijeab/2.1.41 ISSN: 2456-1878
www.ijeab.com Page | 321
Installation of drip irrigation system
The experiment consists of two 6500 liters capacity tanks
mounted at the upper end of the field. The feeder tank was
positioned 3 m height above ground level and connected to
the supply tank with 1.5 m height through a PVC pipe. The
feeder tank continuously feed the supply tank with water at
a constant head while the supply tank consists of a floating
device to regulate the height of water. The floating device
helps to ensure a constant pressure in the supply tank. The
supply tank was connected to the main (diameter 25 mm)
through a gate valve. Six laterals (made of garden hose),
each 25 m long and diameter 15 mm, were laid at each side
of the plot with 54 medi-emitters on each laterals. Twelve
(12) medi-emitters were laid on each sub-plots, 6 to each
side of the laterals with spacing of 0.33 m (Figure 1 and
Plate 1). The medi-emitters were forced into the lateral of
the drip line already on the field.
Fig.1: Experimental Field Layout
Plate.1: The drip irrigation setup showing the medi-emitters
Calibration of medi-emitters
The medi-emitters were calibrated on the field using a stop
watch and a measuring cylinder of 1𝐿 capacity. The medi-
emitters were fitted to the garden hose (laterals) while the
control knobs were gradually adjusted so that water is
allowed to flow to the measuring cylinder. The time taken
to fill 1𝐿 measuring cylinder for each trial was noted and
the procedure was repeated several times until a time was
reached when 1litre was filled in 15 minutes. The position
of the control knob at this point was marked. Several trials
were made with the fixed position of the control knob to
ensure accuracy and in each case, the discharge was 1𝐿 in
15 minutes which is equivalent to4𝐿/ℎ.
International Journal of Environment, Agriculture and Biotechnology (IJEAB) Vol-2, Issue-1, Jan-Feb- 2017
http://dx.doi.org/10.22161/ijeab/2.1.41 ISSN: 2456-1878
www.ijeab.com Page | 322
Performance evaluation of the medi-emitter
Water discharge from the emitters was used to evaluate the
performance. This involves the direct process of collecting
water in a plastic container, or catch can, measuring the
water using a sensitive scale and converting it to volume on
the assumption that 1 g = 1 cm3
. The collection time was set
to 10 minutes, considered enough to obtain adequate
volume (ASAE EP 458 1996). The performance parameters
evaluated include: emission uniformity, global coefficient
of variation, emitter flow variation and distribution
uniformity as described below:
(i) The Emission uniformity (EU) was determined
according to the procedure of Keller and Karmeli (1974).
𝐸𝑈 = 100 ×
𝑄 𝑚𝑖𝑛
𝑄 𝑎𝑣𝑒
where EU= Field emission uniformity (%); Qmin =
minimum discharge rate (L/h); Qave = average of all field
data emitter discharge rates (L/h).
(ii)The emitter flow variation (𝑄 𝑣𝑎𝑟) and coefficient of
variation (𝐶𝑣) was according to Keller and Karmeli (1974)
as:
𝑄 𝑣𝑎𝑟 =
𝑄 𝑚𝑎𝑥−𝑄 𝑚𝑖𝑛
𝑄 𝑚𝑎𝑥
where Qvar = emitter flow variation (L/h); Qmax =
maximum emitter flow rate (L/h); Qmin = minimum emitter
flow rate (L/h)
(iii) Coefficient of global variation (𝐶𝐺𝑣) was calculated
according to the equation
𝐶𝐺𝑣 =
𝑆
𝑄 𝑎𝑣𝑒
where S = standard deviation of emitter flow rate (L/h);
Qave = average emitter flow rate (L/h).
(iv) Distribution uniformity (𝐷𝑈) was computed according
to Keller and Karmeli (1974):
𝐷𝑈 =
𝑞̅25
𝑞̅
∗ 100
where DU = distribution uniformity (%); 𝑞̅25= average of
25% lowest emitter rates (L/h); 𝑞̅ = average emitter flow
rate (L/h).
The performance indices were determined from spatial
perspective considering all emitters in all the three drip
irrigation frequency treatments after installation (a week
after transplanting). These parameters were again evaluated
for each treatment at mid-season and at harvest to reveal the
system’s change in discharge and distribution uniformity
with time as suggested by Mofoke et al.(2004). The
performance indices were compared with ASAE EP 405
(1985) standards for optimum operating system for drip
irrigation systems.
Radius of water pool formed on the soil surface and soil
water content
Twelve medi-emitters were randomly selected on the field
and are numbered A1, A2, B1, B2, C1, C2, D1, D2, E1, E2
F1 and F2. Each of the emitter was opened to the calibrated
discharge of 4 L/h. The emitters A1 and A2 were allowed to
run for 15 minutes after which the knobs were closed. The
wetted perimeter was measured by planimetry method,
whereby the circumference of the wetted area was traced
with flexible and tiny rope and the length was determined
(Plate 2).
Plate.2. Determination of radius of wetted surface using planimetry method.
International Journal of Environment, Agriculture and Biotechnology (IJEAB) Vol-2, Issue-1, Jan-Feb- 2017
http://dx.doi.org/10.22161/ijeab/2.1.41 ISSN: 2456-1878
www.ijeab.com Page | 323
The diameter of the approximate circle formed was
calculated using the equation
𝐶𝑖𝑟𝑐𝑢𝑚𝑓𝑒𝑟𝑒𝑛𝑐𝑒 = 𝜋𝑑
where 𝑑 is the diameter of the circle, cm. The radius 𝑟 was
calculated as 𝑟 = 𝑑/2.
At the end each experiment, soil samples (in triplicates)
were collected from the 0-10, 10-20, 20-30 and 30-40 cm
layers for the determination of gravimetric water content,
θg. The soil volumetric water content, SWC, was computed
from the product of θg and bulk density, BD.
Modeling of radius of water pool formed on the soil surface
In order to model the radius of circle of water entry at time
‘𝑡’, it is necessary to consider the infiltration rate (Subbaiah
and Mashru 2013). These authors suggested the use of
Kostiakov’s equation (𝐼 = 𝐴𝑡 𝑛
) for the cumulative depth of
infiltration in any soil. To apply this equation, infiltration
tests were performed before transplanting of tomato
seedlings.
The radius of the water pool formed on the soil surface (𝑟𝑤)
was given as:
𝑟𝑤
2
= 0.955𝑄/𝑎[2𝑡 𝑏
+ 3 𝑏
]
where Q is the emitter flow rate (cm3
min-1
), 𝑎 = 𝐴 ∗ 𝑛 and
𝑏 = 𝑛 − 1 are constants obtained from Kostiakov
cumulative infiltration equation. The description of this
equation can be found in Subbaiah and Mashru (2013). The
calculated radii of water pool on soil surface (𝑟𝑤) were
plotted against time and a regression equation was obtained.
The observed and calculated 𝑟𝑤 values were compared
using statistical parameters of mean absolute error (MAE)
and root mean square error (RMSE).
Statistical analysis
Data obtained on performance evaluation and soil water
content in the different layers were subjected to descriptive
analysis and analysis of variance (ANOVA) at 5% level of
probability. Statistical analyses were done in SPSS (IBM
version 20).
III. RESULTS AND DISCUSSION
Performance evaluation of the medi-emitters
The descriptive statistics of the calibrated discharge rates of
the medi-emitters installed in the tomato field under drip
irrigation are presented in Table 2. Irrigation water supplied
to the field at different frequency had no significant effect
on the average discharge rates of the medi-emitters
throughout the tomato growing cycle. The discharge rates
from the medi-emitters ranged between 3.73 and 4.10 L/h;
3.57 and 4.07 L/h and 3.57 and 4.03 L/h shortly after
transplanting, mid-season and harvest, respectively for the
different drip irrigation regimes, with the mean discharge
rate at par (3.91 L/h) for all treatments. The overall average
calibrated discharge rate is slightly lesser (about 2.25%
decrease) than the nominal discharge rate of 4 L/h from
conventional drip emitters. The maintenance of the
discharge rate throughout the growth cycle made it possible
for supplying water towards meeting scheduled crop water
requirements of the tomato crop.
Table.2: Descriptive statistics of the discharge rate of the medi-emitters installed in the tomato field.
Max. Min. Mean SD
Irrigation frequency Shortly after transplanting
F1 4.03 3.73 3.91a 0.083
F2 4.03 3.80 3.92a 0.054
F3 4.10 3.80 3.92a 0.062
Mid-season
F1 4.07 3.57 3.89a 0.103
F2 4.07 3.77 3.93a 0.067
F3 4.00 3.77 3.90a 0.067
Harvest
F1 4.10 3.57 3.89a 0.095
F2 4.03 3.60 3.92a 0.090
F3 4.00 3.80 3.91a 0.055
F1: irrigation every 7 days; F2: irrigation every 5 days and F3: irrigation every 3 days
Means followed by the same letter did not differ significantly at 5% level of probability by Fisher’s LSD test.
International Journal of Environment, Agriculture and Biotechnology (IJEAB) Vol-2, Issue-1, Jan-Feb- 2017
http://dx.doi.org/10.22161/ijeab/2.1.41 ISSN: 2456-1878
www.ijeab.com Page | 324
Variation in discharge
Average discharge variation (Qvar) was significantly
(P=0.05) influenced by the frequency of water application
(Table 3). Shortly after transplanting, F1 and F3 treatments
had significantly higher Qvar than F2 treatment. At mid-
season stage, F1 treatment had the significantly highest
Qvar(12.30) compared with other treatments. At harvest,
similar result was obtained as F1 had the significantly
highest Qvar (13.01). Except for F3 treatment, the variation
in discharge increased with time.
Table.3: Performance evaluation of the medi-emitters at planting, mid-season and harvest of tomato.
Qvar EU 𝐶𝐺𝑣 DU
Irrigation frequency Shortly after transplanting
F1 7.44a 97.87a 2.13a 97.20a
F2 5.79b 98.63a 1.37b 98.32a
F3 7.32a 98.43a 1.57ab 98.11a
Mid-season
F1 12.30a 97.35a 2.65a 96.55a
F2 7.38b 98.30a 1.70b 98.04a
F3 5.83c 98.27a 1.73b 97.90a
Harvest
F1 13.01a 97.56a 2.44a 97.09a
F2 10.74b 97.70a 2.30a 97.05a
F3 5.00c 98.59a 1.41b 98.26a
F1: irrigation every 7 days; F2: irrigation every 5 days and F3: irrigation every 3 days
Means followed by the same letter did not differ significantly at 5% level of probability by Fisher’s LSD test.
The significantly higher and increase in Qvar over time
obtained from F1 and F2 treatments are attributed to certain
phenomena taking place during the period (7 and 5 days,
respectively) which the medi-emitters remained closed. For
example, there may have been accumulation of dirts at the
close point, causing partial plugging or the difficulty of the
light hose to fully open as a result of elastic behaviour of
the material. Thus, each time the emitters are reopened,
about 2-3 minutes are needed before the system stabilizes,
thus the higher variability. Mofoke et al. (2004) stated that
the general variability in discharge could be attributed to
major and minor losses occurring at the delivery pipe joints
and fittings right from the supply tank to the emitters (e.g.
inherent leakages at the point of immersion of emitters to
the main line).
Coefficient of global variation
The coefficient of global variation (CGv) in discharge
describes the quality of the processes used to manufacture
emission devices. The coefficient of global variation was
significantly (P=0.05) affected by the frequency of water
application. At the different periods of evaluation, the medi-
emitters installed in F1 treatment had the significantly
highest CGv (Table 3). The average values of CGv were
generally low (not more than 2.65) and according to
American Society of Agricultural Engineering (ASAE EP
1985) recommended classification of coefficient of global
variation in discharge, these values are below the 10%
threshold as ‘good’ for point source emitters. This showed
that the adopted medical infusion set (medi-emitters),
coupled with mechanism to control flow rate, can be
employed as substitute for the conventional drippers for
drip irrigation systems. This result agrees with the findings
of Mofoke et al.(2004) and Awe and Ogedengbe (2011) on
the adoption of medical infusion set as drip emitters.
Emission and distribution uniformity
Emission uniformity (EU) describes how evenly an
irrigation system distributes the same depth of water to
every unit area. On the other hand, distribution uniformity
(DU) is an indicator of the magnitude of the system’s
distribution problems. Although F1 treatment had the
lowest values (about 97%) of the uniformity coefficients,
but they did not significantly differ from other treatments.
According to the classification of irrigation system
performance by ASAE EP 405 (1985), an EU rating of 90 -
95% is considered excellent and the system would only
require regular maintenance, while a DU of 85% or greater
International Journal of Environment, Agriculture and Biotechnology (IJEAB) Vol-2, Issue-1, Jan-Feb- 2017
http://dx.doi.org/10.22161/ijeab/2.1.41 ISSN: 2456-1878
www.ijeab.com Page | 325
is considered excellent. In this study, the average values of
both EU and DU monitored at different stages of the tomato
growth cycle were above the maximum threshold for micro-
drip irrigation system, indicating that the system
performance was excellent. The high EU and DU values
followed the trend of observed low coefficient of global
variation in discharge (CGv). The lower EU and DU
obtained from F1 treatment is attributed to higher CGv
observed. These findings also agree with previous studies
(Mofoke et al. 2004; Awe and Ogedengbe 2011). The EU
values obtained are also comparable to those of Manisha et
al. (2015) who studied the performance evaluation of
conventional drip irrigation system at discharge rate of 4
L/h.
Spatio-temporal distribution of profile soil water content
The temporal variability of soil water content of the tomato
field during the performance evaluation of the medi-
emitters is presented in Fig 2.
Fig.2: Temporal distribution of soil water content of the tomato field during the performance evaluation test of the medi-emitters.
The vertical bars are the standard error
s: significant at 5% level of probability by Fisher’s least significant difference test.
There were significant differences in the average SWC in
the different soil layers under the different time of
irrigation, with the 30-40 cm layer having the lowest SWC
at all times. As expected, the SWC of each soil layer
increases with time, with the 10-20 cm layer having the
lowest amplitude while the 30-40 cm layer had the highest
amplitude. The amplitude of the 0-10 cm surface layer was
high compared to that of 10-20 cm layer. The high
amplitude in the surface layer is attributed to evaporation
since it is the layer that is exposed to the atmosphere. The
SWC of the 0-10 cm surface layer was about 28.9% greater
than that of 30-40 cm layer when irrigated for 15 minutes.
However, at the end of 90 minutes of irrigation, the 0-10 cm
surface layer had SWC higher than that of 30-40 cm layer
by 14.6%, about half reduction. The high amplitude and
high percent difference in the SWC of 30-40 cm layer at the
initial stage compared with the surface layer is attributed to
relative dryness in the subsurface layer when the evaluation
was conducted, during this time, very few centimeters from
the soil surface have been wetted (Fig 3). On the other hand,
the rapid reduction in the gap between the SWC of the
surface and subsurface layer at the end of 90 minutes is
attributed to high water percolation and redistribution, in
other words, high advance of wetting front in the soil matrix
due to the sandy nature of the soil. Sandy-textured soils
have greater macropores which facilitate rapid water
movement and redistribution. The advance of the wetting
front within the soil profile can be seen in the spatial
distribution map shown in Fig 3.
International Journal of Environment, Agriculture and Biotechnology (IJEAB) Vol-2, Issue-1, Jan-Feb- 2017
http://dx.doi.org/10.22161/ijeab/2.1.41 ISSN: 2456-1878
www.ijeab.com Page | 326
Fig.3: Spatial map showing the wetting front in the soil profile with time during the performance evaluation of the medi-emitters.
Cumulative infiltration and radius of water pool formed on the soil surface
The cumulative infiltration function of the tomato field shortly after installation of the drip irrigation system is shown in Fig 4.
Fig.4: Cumulative infiltration of the field before the installation of the drip irrigation system.
The total cumulative infiltration was found to be about 50
cm. There was near perfect (R2
= 0.9977) goodness of fit
between the observed cumulative infiltration values and the
Kostiakov model. For this soil, the model constants for the
radius of the water pool on the soil surface, 𝑟𝑤
2
=
0.955𝑄/𝑎[2𝑡 𝑏
+ 3 𝑏
], 𝑎 was 0.1176 while 𝑏 was -0.1752.
The radius of wetted soil volume is an important parameter
when deciding spacing between emitters for a given set of
soil and crop conditions. It also a vital component in
optimizing emitter spacing based on the geometry of the
wetted soil volume and in the determination of length of
laterals (Subbaiah and Mashru 2013). The temporal
distribution of observed and calculated wetted radii on the
soil surface by the medi-emitters is shown in Figure 5.
I = 0.1426t0.8248
R² = 0.9977
0
1
2
3
4
5
0 10 20 30 40 50 60 70
Cum.infiltration,cm
Time, min
International Journal of Environment, Agriculture and Biotechnology (IJEAB) Vol-2, Issue-1, Jan-Feb- 2017
http://dx.doi.org/10.22161/ijeab/2.1.41 ISSN: 2456-1878
www.ijeab.com Page | 327
Fig.5: Calculated and observed wetted radius of the soil surface by the medi-emitters.
Increased duration of irrigation increased the wetted radius,
in other words, the radial area of ponded water develops in
the vicinity of the medi-emitters and expands with time.
Both the observed and calculated radius of water pool on
the soil surface as a function of time was fitted well with
fourth order polynomial as also obtained by Subbaiah and
Mashru (2013) who modeled the effect of three discharge
rates on soil wetted radius of a point source surface trickle
irrigation. The goodness of fit was 0.9222 and 0.8045 for
the calculated and observed radii, respectively. These values
were lower than those obtained by Subbaiah and Mashru
(2013) who employed conventional drippers compared to
the improvised medi-emitters used for this study.
In addition to goodness of fit, model validation parameters
of mean absolute error (MAE) and root mean square error
(RMSE) were used to compare observed and calculated 𝑟𝑤
values and they were 0.2258 and 0.2573, respectively. The
MAE shows the bias while the RMSE is an indication of the
prediction accuracy (Chai and Draxler 2014). These values
were low, indicating good prediction. In this study, only a
single emitter discharge rate was evaluated, therefore we
recommend further studies to include the effect of different
medi-emitter discharge rates on wetted radius on the soil
surface as well as depth of water pool in the subsurface.
Nevertheless, this model can be used to determine the
geometry of wetted bulb from surface drippers, whether
conventional or improvised, for any operating discharge
rate for a specific duration.
IV. CONCLUSIONS
The discharge rate of the medi-emitters did not vary
throughout the tomato growing cycle and was almost at par
compared to that of conventional emitter. According to
American Society of Agricultural Engineering (ASAE
1985) recommendation, the evaluated parameters showed
that the system performance was excellent. The different
periods of irrigation significantly influenced the average
values of SWC in the different soil layers. The model
performance parameters of goodness of fit, MAE and
RMSE between the calculated and observed radii showed
that the mathematical model can be used to predict the
radius of wetted soil surface under any surface drip
irrigation system. The results of the study showed that the
medical infusion set, with locally produced polyvinyl
chloride pipes (PVC), can successfully replace the more
expensive conventional emitters and delivery pipes for drip
irrigation system. However, we recommend further studies
to include the effect of different discharge rates on wetted
radius on the soil surface as well as depth of water pool in
the subsurface.
REFERENCES
[1] Abegunrin TP, Awe GO, Idowu DO, Onigbogi OO
Onofua OE (2013) ‘‘Effect of kitchen wastewater on
soil properties and growth parameters of cucumber
(Cucumis sativus)’’. Journal of Soil Science and
Environment. 4(7): 139-
145.doi:10.5897/JSSEM2013.0412
International Journal of Environment, Agriculture and Biotechnology (IJEAB) Vol-2, Issue-1, Jan-Feb- 2017
http://dx.doi.org/10.22161/ijeab/2.1.41 ISSN: 2456-1878
www.ijeab.com Page | 328
[2] Anon (2003). Smart Water Solutions: examples of
innovative, low-cost technology for wells, pumps,
storage, irrigation and water treatment. - Netherlands
Water Partnership (NWP). Delft, the Netherlands.
[3] ASAE- American Society of Agricultural Engineers
(1985) Design, installation and performance of trickle
irrigation systems, EP 405, pp.508.
[4] ASAE- American Society of Agricultural Engineers.
(1996). Field evaluation of micro-irrigation systems,
EP 458, 792-797.
[5] Awe GO, Ogedengbe K (2011) Performance
evaluation of bamboo (Bambusa vulgaris Schrad)-pipe
and medi-emitter in a gravity-flow drip irrigation
system. Int. J. Agric. For., 1(1): 9-13.
[6] Bissrat G, Asghedom S, Mehari A (2001) Affordable
micro-irrigation technology (AMIT). In: Eritrea Pre-
feasibility study report, March-September 2001.
Report of a consultative project between the Centre for
Development and Environment (CDE), University of
Bern, International Development Enterprises (IDE)
and the College of Agriculture and Aquatic Science
(CAAS), University of Asmara.
[7] Chai T, Draxler RR (2014). Root mean square error
(RMSE) or mean absolute error (MAE)? Arguments
against avoiding RMSE in literature. Geosic. Model
Dev., 7: 1247-1250.
[8] Cornish G, Brabben T (2001) Field guide on irrigated
agriculture for field assistants. International
programme for technology and research in irrigation
and drainage. FAO, Rome.
[9] Decroix M, Malaval A (1985) Laboratory evaluation
of trickle irrigation equipment for field system design.
Proceedings of the third International Drip/Trickle
Irrigation Congress, Volume I, California, USA. pp.
325-338.
[10]FAO (2010) FAOSTAT Production Yearbook 2010.
[11]Frizzone JA (1997) Uniformidade e eficiencia da
irrigacao. Departmento de Engenharia Rurual,
ESALQ, Serie didatica, Piracicaba. 2-18.
[12]Keller J, Blisner RD (1990) Sprinkler and trickle
irrigation. Van Nostrand Reinhold, New York. Pp 427-
602.
[13]Keller J, Karmeli D (1974) Trickle irrigation design
parameters. Transaction of ASAE, 7, 687-684.
[14]Khan GD, Ali A, Akbar F (2014) Assessment of
coefficient of variation of emitters flow rate with
respect to design, manufacturers and plugging in
installed drip irrigation systems at selected sites of
Peshawar valley. Adv. Life Sci. Tech., 19: 27-32.
[15]Manisha I, Sinha J, Tripathi MP (2015) Studies on
hydraulic performance of drip irrigation under
operating pressure. Int. J. Appl. Eng. Tech., 5(2): 1-6.
[16]Masimba B (2003) Drip irrigation helps smallholders.
- In: “African Farming and Food Processing”
July/August 2003 edition. (J. Phelan ed.). Alain
Charles Publishing Ltd. London.
[17]Mofoke ALE, Adewumi JK, Mudiare OJ, Ramahan
AA (2004) Design, construction and evaluation of an
affordable continuous – flow drip irrigation system.
Journal of Applied Irrigation Science. 39(2): 253-269.
[18]Muhammad-Lawal A, Adenuga AH, Jimoh O (2013).
Determinants of adoption irrigation technology by
small-holder farmers is selected Local Government
Areas in Kwara State, Nigeria. Taraba Journal of
Agricultural Research, 1(1): 21-27.
[19]Olaniyi JO, Akanbi WB, Adejumo TA, Akande OG
(2010). Growth, fruit yield and nutritional quality of
tomato varieties. Afric. J. Food Sci., 4(6): 398-402.
[20]Polak P, Bob N, Deepak A (1997): A low cost drip
irrigation system for small farmers in developing
countries. Journal of Applied Irrigation Science. 32(1),
105-112.
[21]Sammis TW, Wu IP (1985) Effect of drip irrigation
design and management on fruit trees yield.
Transactions of the ASAE American Society of
Agricultural Engineers. 28(3): 832-838.
[22]Soccol OJ, Ullmann MN, Frizzone JA (2002)
Performance analysis of a trickle irrigation subunit
installed in apple orchard. Brazilian Archives of
Biology and Technology. 45(4): 525-530.
[23]Soil Survey Staff (SSS) (2006). Keys to soil
taxonomy. 10th ed. Washington, USDA-SCS, P. 332.
[24]Solomon KH (1984) Yield related interpretations of
irrigation uniformity and efficiency measures. Irrig.
Sci. 5:161-172.
[25]Subbaiah R, Mashru HH (2013) Modeling for
predicting soil wetting radius under point source
surface trickle irrigation. Agric. Eng. Int.: CIGR
Journal, 15(3): 1-10.
[26]Youngs EG, Leeds-Harrison PB, Alghusni A (1999)
Surface pounding of coarse-textured soils under
irrigation with a line of surface emitters. J. Agric. Eng.
Res., 73: 95-100.

More Related Content

What's hot

PRELIMINARY STUDY ON NUTRIENT REMOVAL OF DAIRY WASTEWATER BY PILOT SCALE SUBS...
PRELIMINARY STUDY ON NUTRIENT REMOVAL OF DAIRY WASTEWATER BY PILOT SCALE SUBS...PRELIMINARY STUDY ON NUTRIENT REMOVAL OF DAIRY WASTEWATER BY PILOT SCALE SUBS...
PRELIMINARY STUDY ON NUTRIENT REMOVAL OF DAIRY WASTEWATER BY PILOT SCALE SUBS...
paperpublications3
 
Ijoear dec-2015-2
Ijoear dec-2015-2Ijoear dec-2015-2
Ijoear dec-2015-2
Agriculture Journal IJOEAR
 
Impact of Land Use Systems and Parent Materials on Soil Quality Indicators in...
Impact of Land Use Systems and Parent Materials on Soil Quality Indicators in...Impact of Land Use Systems and Parent Materials on Soil Quality Indicators in...
Impact of Land Use Systems and Parent Materials on Soil Quality Indicators in...
BRNSS Publication Hub
 
Climatic variability and spatial distribution of herbaceous fodders in the Su...
Climatic variability and spatial distribution of herbaceous fodders in the Su...Climatic variability and spatial distribution of herbaceous fodders in the Su...
Climatic variability and spatial distribution of herbaceous fodders in the Su...
IJERA Editor
 
Variability in the Physico-chemical Properties of Soils of Similar Lithology ...
Variability in the Physico-chemical Properties of Soils of Similar Lithology ...Variability in the Physico-chemical Properties of Soils of Similar Lithology ...
Variability in the Physico-chemical Properties of Soils of Similar Lithology ...
Journal of Agriculture and Crops
 
[International agrophysics] ground penetrating radar for underground sensing ...
[International agrophysics] ground penetrating radar for underground sensing ...[International agrophysics] ground penetrating radar for underground sensing ...
[International agrophysics] ground penetrating radar for underground sensing ...
Minal Ghugal
 

What's hot (18)

ASSESSMENT OF DIFFERENT N MANAGEMENT STRATEGIES IN LOWLAND RICE CULTIVATION
ASSESSMENT OF DIFFERENT N MANAGEMENT STRATEGIES IN LOWLAND RICE CULTIVATIONASSESSMENT OF DIFFERENT N MANAGEMENT STRATEGIES IN LOWLAND RICE CULTIVATION
ASSESSMENT OF DIFFERENT N MANAGEMENT STRATEGIES IN LOWLAND RICE CULTIVATION
 
PRELIMINARY STUDY ON NUTRIENT REMOVAL OF DAIRY WASTEWATER BY PILOT SCALE SUBS...
PRELIMINARY STUDY ON NUTRIENT REMOVAL OF DAIRY WASTEWATER BY PILOT SCALE SUBS...PRELIMINARY STUDY ON NUTRIENT REMOVAL OF DAIRY WASTEWATER BY PILOT SCALE SUBS...
PRELIMINARY STUDY ON NUTRIENT REMOVAL OF DAIRY WASTEWATER BY PILOT SCALE SUBS...
 
Evaluation of land suitability for brackishwatershrimp farming using gis in m...
Evaluation of land suitability for brackishwatershrimp farming using gis in m...Evaluation of land suitability for brackishwatershrimp farming using gis in m...
Evaluation of land suitability for brackishwatershrimp farming using gis in m...
 
Ijoear dec-2015-2
Ijoear dec-2015-2Ijoear dec-2015-2
Ijoear dec-2015-2
 
Impact of Land Use Systems and Parent Materials on Soil Quality Indicators in...
Impact of Land Use Systems and Parent Materials on Soil Quality Indicators in...Impact of Land Use Systems and Parent Materials on Soil Quality Indicators in...
Impact of Land Use Systems and Parent Materials on Soil Quality Indicators in...
 
Quantifying Greenhouse Gas Emissions from Managed and Natural Soils
Quantifying Greenhouse Gas Emissions from Managed and Natural SoilsQuantifying Greenhouse Gas Emissions from Managed and Natural Soils
Quantifying Greenhouse Gas Emissions from Managed and Natural Soils
 
IRJET- Evaluation of Furrow Irrigation Systems on Onion Yield and Water U...
IRJET-  	  Evaluation of Furrow Irrigation Systems on Onion Yield and Water U...IRJET-  	  Evaluation of Furrow Irrigation Systems on Onion Yield and Water U...
IRJET- Evaluation of Furrow Irrigation Systems on Onion Yield and Water U...
 
Mapping spatial variability of soil physical properties for site-specific man...
Mapping spatial variability of soil physical properties for site-specific man...Mapping spatial variability of soil physical properties for site-specific man...
Mapping spatial variability of soil physical properties for site-specific man...
 
Tracking change in land use and vegetation condition
Tracking change in land use and vegetation conditionTracking change in land use and vegetation condition
Tracking change in land use and vegetation condition
 
Multi-scale analysis of microbe-climate interactions in greenhouse gas emissi...
Multi-scale analysis of microbe-climate interactions in greenhouse gas emissi...Multi-scale analysis of microbe-climate interactions in greenhouse gas emissi...
Multi-scale analysis of microbe-climate interactions in greenhouse gas emissi...
 
Accumulation of Antibiotic Resistant Salmonella in Lettuce After Irrigation u...
Accumulation of Antibiotic Resistant Salmonella in Lettuce After Irrigation u...Accumulation of Antibiotic Resistant Salmonella in Lettuce After Irrigation u...
Accumulation of Antibiotic Resistant Salmonella in Lettuce After Irrigation u...
 
Climatic variability and spatial distribution of herbaceous fodders in the Su...
Climatic variability and spatial distribution of herbaceous fodders in the Su...Climatic variability and spatial distribution of herbaceous fodders in the Su...
Climatic variability and spatial distribution of herbaceous fodders in the Su...
 
Evapotranspiration partitioning components in an irrigated winter wheat field...
Evapotranspiration partitioning components in an irrigated winter wheat field...Evapotranspiration partitioning components in an irrigated winter wheat field...
Evapotranspiration partitioning components in an irrigated winter wheat field...
 
Impact of the use of inorganic fertilizers to the soils of the ebonyi state a...
Impact of the use of inorganic fertilizers to the soils of the ebonyi state a...Impact of the use of inorganic fertilizers to the soils of the ebonyi state a...
Impact of the use of inorganic fertilizers to the soils of the ebonyi state a...
 
Effect application of sea sand, coconut and banana coir on the growth and yie...
Effect application of sea sand, coconut and banana coir on the growth and yie...Effect application of sea sand, coconut and banana coir on the growth and yie...
Effect application of sea sand, coconut and banana coir on the growth and yie...
 
Drip Irrigation of Apples at a Moderate Continental Climate
Drip Irrigation of Apples at a Moderate Continental ClimateDrip Irrigation of Apples at a Moderate Continental Climate
Drip Irrigation of Apples at a Moderate Continental Climate
 
Variability in the Physico-chemical Properties of Soils of Similar Lithology ...
Variability in the Physico-chemical Properties of Soils of Similar Lithology ...Variability in the Physico-chemical Properties of Soils of Similar Lithology ...
Variability in the Physico-chemical Properties of Soils of Similar Lithology ...
 
[International agrophysics] ground penetrating radar for underground sensing ...
[International agrophysics] ground penetrating radar for underground sensing ...[International agrophysics] ground penetrating radar for underground sensing ...
[International agrophysics] ground penetrating radar for underground sensing ...
 

Similar to performance evaluation and characterization of wetted soil parameters of improvised

Research paper Pressur tube emmiter Anlaysis ofmicrotube emitter of trickle...
Research paper Pressur tube emmiter Anlaysis ofmicrotube   emitter of trickle...Research paper Pressur tube emmiter Anlaysis ofmicrotube   emitter of trickle...
Research paper Pressur tube emmiter Anlaysis ofmicrotube emitter of trickle...
Col Islam Ul Haq
 
Effect of Deficit Irrigation on Yield and Water Productivity of Onion (Allium...
Effect of Deficit Irrigation on Yield and Water Productivity of Onion (Allium...Effect of Deficit Irrigation on Yield and Water Productivity of Onion (Allium...
Effect of Deficit Irrigation on Yield and Water Productivity of Onion (Allium...
Premier Publishers
 
Chapter10waterefficiency 130630060838-phpapp02
Chapter10waterefficiency 130630060838-phpapp02Chapter10waterefficiency 130630060838-phpapp02
Chapter10waterefficiency 130630060838-phpapp02
Cleophas Rwemera
 
Chapter 10 water efficiency
Chapter 10 water efficiencyChapter 10 water efficiency
Chapter 10 water efficiency
Mohammed Salahat
 

Similar to performance evaluation and characterization of wetted soil parameters of improvised (20)

Evaluation of Irrigation Application Efficiency: Case Study of Chanchaga Irri...
Evaluation of Irrigation Application Efficiency: Case Study of Chanchaga Irri...Evaluation of Irrigation Application Efficiency: Case Study of Chanchaga Irri...
Evaluation of Irrigation Application Efficiency: Case Study of Chanchaga Irri...
 
Performance evaluation of sprinkler irrigation system in Matimba irrigation s...
Performance evaluation of sprinkler irrigation system in Matimba irrigation s...Performance evaluation of sprinkler irrigation system in Matimba irrigation s...
Performance evaluation of sprinkler irrigation system in Matimba irrigation s...
 
Effects of drip irrigation frequency and depth on soil hydro-physical propert...
Effects of drip irrigation frequency and depth on soil hydro-physical propert...Effects of drip irrigation frequency and depth on soil hydro-physical propert...
Effects of drip irrigation frequency and depth on soil hydro-physical propert...
 
Effect of Magnetic Treatment of Water on Evapotranspiration of Tomato
Effect of Magnetic Treatment of Water on Evapotranspiration of TomatoEffect of Magnetic Treatment of Water on Evapotranspiration of Tomato
Effect of Magnetic Treatment of Water on Evapotranspiration of Tomato
 
Research paper Pressur tube emmiter Anlaysis ofmicrotube emitter of trickle...
Research paper Pressur tube emmiter Anlaysis ofmicrotube   emitter of trickle...Research paper Pressur tube emmiter Anlaysis ofmicrotube   emitter of trickle...
Research paper Pressur tube emmiter Anlaysis ofmicrotube emitter of trickle...
 
3. article azojete vol 10 25 39 ismail
3. article azojete vol 10 25 39 ismail3. article azojete vol 10 25 39 ismail
3. article azojete vol 10 25 39 ismail
 
Effect of Deficit Irrigation on Yield and Water Productivity of Onion (Allium...
Effect of Deficit Irrigation on Yield and Water Productivity of Onion (Allium...Effect of Deficit Irrigation on Yield and Water Productivity of Onion (Allium...
Effect of Deficit Irrigation on Yield and Water Productivity of Onion (Allium...
 
R04606107109
R04606107109R04606107109
R04606107109
 
Interactive Effects of Stream Sizes and Furrow Geometry on Furrow Irrigation ...
Interactive Effects of Stream Sizes and Furrow Geometry on Furrow Irrigation ...Interactive Effects of Stream Sizes and Furrow Geometry on Furrow Irrigation ...
Interactive Effects of Stream Sizes and Furrow Geometry on Furrow Irrigation ...
 
Influence of Human Urine on Rice Grain Yield (Orzya sativa L.) and Selected S...
Influence of Human Urine on Rice Grain Yield (Orzya sativa L.) and Selected S...Influence of Human Urine on Rice Grain Yield (Orzya sativa L.) and Selected S...
Influence of Human Urine on Rice Grain Yield (Orzya sativa L.) and Selected S...
 
Evaluation of evapotranspiration
Evaluation of evapotranspirationEvaluation of evapotranspiration
Evaluation of evapotranspiration
 
Soil lixiviation and slow release pattern of starch-nano sliver particles-enc...
Soil lixiviation and slow release pattern of starch-nano sliver particles-enc...Soil lixiviation and slow release pattern of starch-nano sliver particles-enc...
Soil lixiviation and slow release pattern of starch-nano sliver particles-enc...
 
J012415965
J012415965J012415965
J012415965
 
Maize Phenology and Crop Stand in Response to Mulching and Furrow Irrigation ...
Maize Phenology and Crop Stand in Response to Mulching and Furrow Irrigation ...Maize Phenology and Crop Stand in Response to Mulching and Furrow Irrigation ...
Maize Phenology and Crop Stand in Response to Mulching and Furrow Irrigation ...
 
M025128139
M025128139M025128139
M025128139
 
Growing Okra with Drip Fertigation- A Review
Growing Okra with Drip Fertigation- A ReviewGrowing Okra with Drip Fertigation- A Review
Growing Okra with Drip Fertigation- A Review
 
Need to replace Furrow Irrigation system by Drip Irrigation system to Improve...
Need to replace Furrow Irrigation system by Drip Irrigation system to Improve...Need to replace Furrow Irrigation system by Drip Irrigation system to Improve...
Need to replace Furrow Irrigation system by Drip Irrigation system to Improve...
 
Chapter10waterefficiency 130630060838-phpapp02
Chapter10waterefficiency 130630060838-phpapp02Chapter10waterefficiency 130630060838-phpapp02
Chapter10waterefficiency 130630060838-phpapp02
 
Chapter 10 water efficiency
Chapter 10 water efficiencyChapter 10 water efficiency
Chapter 10 water efficiency
 
Application of Soil Moisture Sensors in Agriculture: A Review
Application of Soil Moisture Sensors in Agriculture: A ReviewApplication of Soil Moisture Sensors in Agriculture: A Review
Application of Soil Moisture Sensors in Agriculture: A Review
 

Recently uploaded

Standard Reomte Control Interface - Neometrix
Standard Reomte Control Interface - NeometrixStandard Reomte Control Interface - Neometrix
Standard Reomte Control Interface - Neometrix
Neometrix_Engineering_Pvt_Ltd
 
Automobile Management System Project Report.pdf
Automobile Management System Project Report.pdfAutomobile Management System Project Report.pdf
Automobile Management System Project Report.pdf
Kamal Acharya
 
Laundry management system project report.pdf
Laundry management system project report.pdfLaundry management system project report.pdf
Laundry management system project report.pdf
Kamal Acharya
 
Online blood donation management system project.pdf
Online blood donation management system project.pdfOnline blood donation management system project.pdf
Online blood donation management system project.pdf
Kamal Acharya
 

Recently uploaded (20)

Explosives Industry manufacturing process.pdf
Explosives Industry manufacturing process.pdfExplosives Industry manufacturing process.pdf
Explosives Industry manufacturing process.pdf
 
Natalia Rutkowska - BIM School Course in Kraków
Natalia Rutkowska - BIM School Course in KrakówNatalia Rutkowska - BIM School Course in Kraków
Natalia Rutkowska - BIM School Course in Kraków
 
Introduction to Machine Learning Unit-5 Notes for II-II Mechanical Engineering
Introduction to Machine Learning Unit-5 Notes for II-II Mechanical EngineeringIntroduction to Machine Learning Unit-5 Notes for II-II Mechanical Engineering
Introduction to Machine Learning Unit-5 Notes for II-II Mechanical Engineering
 
A CASE STUDY ON ONLINE TICKET BOOKING SYSTEM PROJECT.pdf
A CASE STUDY ON ONLINE TICKET BOOKING SYSTEM PROJECT.pdfA CASE STUDY ON ONLINE TICKET BOOKING SYSTEM PROJECT.pdf
A CASE STUDY ON ONLINE TICKET BOOKING SYSTEM PROJECT.pdf
 
Sachpazis:Terzaghi Bearing Capacity Estimation in simple terms with Calculati...
Sachpazis:Terzaghi Bearing Capacity Estimation in simple terms with Calculati...Sachpazis:Terzaghi Bearing Capacity Estimation in simple terms with Calculati...
Sachpazis:Terzaghi Bearing Capacity Estimation in simple terms with Calculati...
 
fundamentals of drawing and isometric and orthographic projection
fundamentals of drawing and isometric and orthographic projectionfundamentals of drawing and isometric and orthographic projection
fundamentals of drawing and isometric and orthographic projection
 
Quality defects in TMT Bars, Possible causes and Potential Solutions.
Quality defects in TMT Bars, Possible causes and Potential Solutions.Quality defects in TMT Bars, Possible causes and Potential Solutions.
Quality defects in TMT Bars, Possible causes and Potential Solutions.
 
The Benefits and Techniques of Trenchless Pipe Repair.pdf
The Benefits and Techniques of Trenchless Pipe Repair.pdfThe Benefits and Techniques of Trenchless Pipe Repair.pdf
The Benefits and Techniques of Trenchless Pipe Repair.pdf
 
Standard Reomte Control Interface - Neometrix
Standard Reomte Control Interface - NeometrixStandard Reomte Control Interface - Neometrix
Standard Reomte Control Interface - Neometrix
 
Introduction to Casting Processes in Manufacturing
Introduction to Casting Processes in ManufacturingIntroduction to Casting Processes in Manufacturing
Introduction to Casting Processes in Manufacturing
 
Introduction to Machine Learning Unit-4 Notes for II-II Mechanical Engineering
Introduction to Machine Learning Unit-4 Notes for II-II Mechanical EngineeringIntroduction to Machine Learning Unit-4 Notes for II-II Mechanical Engineering
Introduction to Machine Learning Unit-4 Notes for II-II Mechanical Engineering
 
A case study of cinema management system project report..pdf
A case study of cinema management system project report..pdfA case study of cinema management system project report..pdf
A case study of cinema management system project report..pdf
 
Halogenation process of chemical process industries
Halogenation process of chemical process industriesHalogenation process of chemical process industries
Halogenation process of chemical process industries
 
Construction method of steel structure space frame .pptx
Construction method of steel structure space frame .pptxConstruction method of steel structure space frame .pptx
Construction method of steel structure space frame .pptx
 
Automobile Management System Project Report.pdf
Automobile Management System Project Report.pdfAutomobile Management System Project Report.pdf
Automobile Management System Project Report.pdf
 
Laundry management system project report.pdf
Laundry management system project report.pdfLaundry management system project report.pdf
Laundry management system project report.pdf
 
İTÜ CAD and Reverse Engineering Workshop
İTÜ CAD and Reverse Engineering WorkshopİTÜ CAD and Reverse Engineering Workshop
İTÜ CAD and Reverse Engineering Workshop
 
ASME IX(9) 2007 Full Version .pdf
ASME IX(9)  2007 Full Version       .pdfASME IX(9)  2007 Full Version       .pdf
ASME IX(9) 2007 Full Version .pdf
 
Immunizing Image Classifiers Against Localized Adversary Attacks
Immunizing Image Classifiers Against Localized Adversary AttacksImmunizing Image Classifiers Against Localized Adversary Attacks
Immunizing Image Classifiers Against Localized Adversary Attacks
 
Online blood donation management system project.pdf
Online blood donation management system project.pdfOnline blood donation management system project.pdf
Online blood donation management system project.pdf
 

performance evaluation and characterization of wetted soil parameters of improvised

  • 1. International Journal of Environment, Agriculture and Biotechnology (IJEAB) Vol-2, Issue-1, Jan-Feb- 2017 http://dx.doi.org/10.22161/ijeab/2.1.41 ISSN: 2456-1878 www.ijeab.com Page | 319 Performance evaluation and characterization of wetted soil parameters of improvised medi- emitters installed in a drip irrigation tomato field Awe G.O.1 , Abegunrin T.P.2* , Ojediran J.O.2 , Oyetoro O.O.2 1 Department of Crop, Soil and Environmental Sciences, Faculty of Agricultural Sciences, Ekiti State University, Ado Ekiti, Nigeria. 2 Department of Agricultural Engineering, Faculty of Engineering and Technology, Ladoke Akintola University of Technology, Ogbomoso, Nigeria. Abstract— Field study was conducted to evaluate the emission uniformity (EU), global coefficient of variation (CGv), emitter flow variation (Qvar) and distribution uniformity (DU), and determine the wetted radius (rw) on soil surface of improvised medi-emitters installed in a tomato field. Soil water content (SWC) at four layers was determined after different periods of irrigation. Radius of wetted soil surface was determined and predicted. Irrigation frequency had no significant effect on the average discharge rate of the medi-emitters throughout the growing cycle. Average Qvar and CGv were significantly (P=0.05) influenced by the frequency of application while the EU and DU did not significantly (P=0.05) differ among the treatments. There were significant differences in the average values of SWC in different soil layers under the different periods of irrigation. Both the observed and calculated rw on the soil surface were fitted with fourth order polynomial. The model performance parameters of MAE and RMSE between the calculated and observed radii were low, indicating good prediction. Medical infusion set can successfully replace the more expensive conventional emitters for drip irrigation system. Keywords— Medical infusion set, conventional emitters, wetted soil radius, soil water status. I. INTRODUCTION One of the advocated strategies of averting the impending water crisis is the emphasis on increased water use efficiency from the irrigation sub-sector, and one way of ensuring efficient utilization of irrigation water is for farmers to switch over from the traditional surface flooding method and adopt highly efficient irrigation system, the drip irrigation systems. The drip irrigation system has become the best method of water application that has been used globally over other irrigation systems. Drip irrigation system supplies frequent and small amounts of irrigation water at single or many points to the field surface/subsurface within the plant root zone (Decroix and Malaval 1985; Youngs et al. 1999). According to Khan et al. (2014), drip irrigation system is one of the best methods with frequent, slow application of water either directly on the land or into the crop root zone rather than the entire land surface, which ensures optimum water content in the root zone. In Nigeria, conventional pipes and emission devices used for most of the outstanding schemes of drip irrigations, though very efficient and adequate, are imported (Awe and Ogedengbe 2011). However, the devaluation of the local currency in the international market currently being experienced has make these items to be expensive, becoming unaffordable to rural and peasant farmers who make the bulk of agricultural sector. Consequently, of an estimated 71 million hectares of arable land, only about 7 per cent is being irrigated (Muhammad-Lawal et al. 2013) with the remaining area depending on rainfall. However, the high variability and uneven temporal distribution of rainfall in recent times have made rain-fed agriculture to be under threat. It was in line of this that the FAO (2010)listed Nigeria amongst the countries that are technically unable to meet their food demands from rain-fed farming. Therefore, the search for and use of locally available materials for irrigation are now promoted with a view to increasing productivity and ensuring food security. Recently, the concept of affordable micro-irrigation systems has been identified as a commensurate drip technology for low-income farmers and these systems have posed momentous potential for efficient agricultural water use (Mofoke et al. 2004). For example, low-cost micro- irrigation systems in use today include the drum and bucket drip kits (Cornish and Brabben 2001), and the Nica
  • 2. International Journal of Environment, Agriculture and Biotechnology (IJEAB) Vol-2, Issue-1, Jan-Feb- 2017 http://dx.doi.org/10.22161/ijeab/2.1.41 ISSN: 2456-1878 www.ijeab.com Page | 320 Irrigation (Anon. 2003) which apply water in pulses often more than once a day. In other to evaluate the efficiency and applicability of these systems, considerable studies have been conducted with success (e.g. Polak et al.1997; Bissrat et al.2001; Masimba 2003). Recently too, medical infusion set, otherwise known as medi-emitter, used mainly in hospitals and clinics for transfusion purposes has been successfully adopted as emitters in drip irrigation. Mofoke et al. (2004) first used medi-emitters and reported satisfactory performance as drippers for a continuous-flow drip irrigation system installed in tomato plots in Awe and Ogedengbe (2011) employed medi-emitters in conjunction with bamboo laterals, the authors found that the locally sourced materials performed well with variation in medi-emitter discharge not more than 10.21 percent, low manufacturer’s CV (3.35) and high statistical uniformity coefficient (98.33%) and distribution uniformity (97.69%). One shortcoming about these two studies is that the medi-emitters were calibrated to supply to the field in drops of water per minutes, in other words, they were not calibrated to supply water to the field at discharge rates that could be comparable to those of conventional emitters, therefore there is gap in knowledge on how the improvised systems perform over time. Drip irrigation can potentially have high application efficiency and high distribution uniformity, which are very important in ensuring uniformly and high crop yields as well as preserving water quality, especially when both water and fertilizers are applied through the irrigation system. However, the uniformity and general performance of micro- irrigation systems are affected by several factors including manufacturer’s coefficient of variation, grouping of emitters and emitter clogging, water temperature, water quality, among others (Frizzone 1997). The hydraulic of the system and topography of the field also cause variation in pressure head at individual outlet. According to Solomon (1984), as the pressure variation in drip irrigation system increases, both the uniformity and application efficiency tend to reduce, causing increase in water losses and leading to over- or under-irrigation. In addition, improper maintenance of irrigation system can cause the uniformity to decrease, resulting in increased water application to compensate for decreased application uniformity or reduced yields (Sammis and Wu 1985). Therefore, tests to evaluate performance, related to resistance and durability of irrigation system, defined through technical specification rules are required. The aim of evaluating the operation of irrigation systems is for better understanding of the adequacy and determination of the necessary procedures required for improving the system. According to Awe and Ogedengbe (2011), such evaluation should be carried out soon after the system installation in the field and periodically repeated until harvest. This is because drip irrigation systems are sensitive to operational conditions over time (Keller and Blisner 1990; Soccol et al. 2002). Therefore, the objective of this study was to evaluate the performance and determine the wetted radius on soil surface of improvised medi-emitters installed in a tomato field under different drip irrigation frequency. II. MATERIALS AND METHODS Description of study site The experiment was conducted at the Teaching and Research Farm of Ladoke Akintola University of Technology, Ogbomoso southwest Nigeria. The field is located on Latitude 8.168343o N, Longitude 4.269921o E and Altitude 357 m. Ogbomoso is characterized by bimodal rainfall pattern, peaking in July and September with annual rainfall depth of about 1200 mm (Abegunrin et al. 2013) while the mean annual maximum and minimum temperature are 33 and 28o C, respectively. The climate is cold and dry from November to March and then warm and moist from April to October, it could also be described as a hot humid tropical which falls in southern Guinea Savannah of Nigeria with mean relative humidity of about 74% all year round except in the months of December to February when it is low as a result of dry wind (harmattan) that blows from the north (Olaniyi et al.2010), while the soil of the site is classified as Hapludalf (SSS 2006), with the textural analysis showing sandy loam texture. Some physical and chemical properties of the 0-30 cm layer are presented in Table 1. Table.1: Some soil physical chemical properties of the site before the experiment. Soil pH SOM BD Sand Silt Clay depth, cm % g/cm3 -------------%------------ Texture 0-5 7.2 1.8 1.48 80.5 8.1 11.4 SL 5-10 6.8 1.2 1.62 77.6 12.0 10.4 SL 10-20 6.6 1.2 1.70 79.7 10.1 10.2 SL 20-30 6.2 1.0 1.73 76.3 13.2 11.5 SL pH: level of alkalinity or acidity, SOM: soil organic matter, BD: bulk density, SL: sandy loam.
  • 3. International Journal of Environment, Agriculture and Biotechnology (IJEAB) Vol-2, Issue-1, Jan-Feb- 2017 http://dx.doi.org/10.22161/ijeab/2.1.41 ISSN: 2456-1878 www.ijeab.com Page | 321 Installation of drip irrigation system The experiment consists of two 6500 liters capacity tanks mounted at the upper end of the field. The feeder tank was positioned 3 m height above ground level and connected to the supply tank with 1.5 m height through a PVC pipe. The feeder tank continuously feed the supply tank with water at a constant head while the supply tank consists of a floating device to regulate the height of water. The floating device helps to ensure a constant pressure in the supply tank. The supply tank was connected to the main (diameter 25 mm) through a gate valve. Six laterals (made of garden hose), each 25 m long and diameter 15 mm, were laid at each side of the plot with 54 medi-emitters on each laterals. Twelve (12) medi-emitters were laid on each sub-plots, 6 to each side of the laterals with spacing of 0.33 m (Figure 1 and Plate 1). The medi-emitters were forced into the lateral of the drip line already on the field. Fig.1: Experimental Field Layout Plate.1: The drip irrigation setup showing the medi-emitters Calibration of medi-emitters The medi-emitters were calibrated on the field using a stop watch and a measuring cylinder of 1𝐿 capacity. The medi- emitters were fitted to the garden hose (laterals) while the control knobs were gradually adjusted so that water is allowed to flow to the measuring cylinder. The time taken to fill 1𝐿 measuring cylinder for each trial was noted and the procedure was repeated several times until a time was reached when 1litre was filled in 15 minutes. The position of the control knob at this point was marked. Several trials were made with the fixed position of the control knob to ensure accuracy and in each case, the discharge was 1𝐿 in 15 minutes which is equivalent to4𝐿/ℎ.
  • 4. International Journal of Environment, Agriculture and Biotechnology (IJEAB) Vol-2, Issue-1, Jan-Feb- 2017 http://dx.doi.org/10.22161/ijeab/2.1.41 ISSN: 2456-1878 www.ijeab.com Page | 322 Performance evaluation of the medi-emitter Water discharge from the emitters was used to evaluate the performance. This involves the direct process of collecting water in a plastic container, or catch can, measuring the water using a sensitive scale and converting it to volume on the assumption that 1 g = 1 cm3 . The collection time was set to 10 minutes, considered enough to obtain adequate volume (ASAE EP 458 1996). The performance parameters evaluated include: emission uniformity, global coefficient of variation, emitter flow variation and distribution uniformity as described below: (i) The Emission uniformity (EU) was determined according to the procedure of Keller and Karmeli (1974). 𝐸𝑈 = 100 × 𝑄 𝑚𝑖𝑛 𝑄 𝑎𝑣𝑒 where EU= Field emission uniformity (%); Qmin = minimum discharge rate (L/h); Qave = average of all field data emitter discharge rates (L/h). (ii)The emitter flow variation (𝑄 𝑣𝑎𝑟) and coefficient of variation (𝐶𝑣) was according to Keller and Karmeli (1974) as: 𝑄 𝑣𝑎𝑟 = 𝑄 𝑚𝑎𝑥−𝑄 𝑚𝑖𝑛 𝑄 𝑚𝑎𝑥 where Qvar = emitter flow variation (L/h); Qmax = maximum emitter flow rate (L/h); Qmin = minimum emitter flow rate (L/h) (iii) Coefficient of global variation (𝐶𝐺𝑣) was calculated according to the equation 𝐶𝐺𝑣 = 𝑆 𝑄 𝑎𝑣𝑒 where S = standard deviation of emitter flow rate (L/h); Qave = average emitter flow rate (L/h). (iv) Distribution uniformity (𝐷𝑈) was computed according to Keller and Karmeli (1974): 𝐷𝑈 = 𝑞̅25 𝑞̅ ∗ 100 where DU = distribution uniformity (%); 𝑞̅25= average of 25% lowest emitter rates (L/h); 𝑞̅ = average emitter flow rate (L/h). The performance indices were determined from spatial perspective considering all emitters in all the three drip irrigation frequency treatments after installation (a week after transplanting). These parameters were again evaluated for each treatment at mid-season and at harvest to reveal the system’s change in discharge and distribution uniformity with time as suggested by Mofoke et al.(2004). The performance indices were compared with ASAE EP 405 (1985) standards for optimum operating system for drip irrigation systems. Radius of water pool formed on the soil surface and soil water content Twelve medi-emitters were randomly selected on the field and are numbered A1, A2, B1, B2, C1, C2, D1, D2, E1, E2 F1 and F2. Each of the emitter was opened to the calibrated discharge of 4 L/h. The emitters A1 and A2 were allowed to run for 15 minutes after which the knobs were closed. The wetted perimeter was measured by planimetry method, whereby the circumference of the wetted area was traced with flexible and tiny rope and the length was determined (Plate 2). Plate.2. Determination of radius of wetted surface using planimetry method.
  • 5. International Journal of Environment, Agriculture and Biotechnology (IJEAB) Vol-2, Issue-1, Jan-Feb- 2017 http://dx.doi.org/10.22161/ijeab/2.1.41 ISSN: 2456-1878 www.ijeab.com Page | 323 The diameter of the approximate circle formed was calculated using the equation 𝐶𝑖𝑟𝑐𝑢𝑚𝑓𝑒𝑟𝑒𝑛𝑐𝑒 = 𝜋𝑑 where 𝑑 is the diameter of the circle, cm. The radius 𝑟 was calculated as 𝑟 = 𝑑/2. At the end each experiment, soil samples (in triplicates) were collected from the 0-10, 10-20, 20-30 and 30-40 cm layers for the determination of gravimetric water content, θg. The soil volumetric water content, SWC, was computed from the product of θg and bulk density, BD. Modeling of radius of water pool formed on the soil surface In order to model the radius of circle of water entry at time ‘𝑡’, it is necessary to consider the infiltration rate (Subbaiah and Mashru 2013). These authors suggested the use of Kostiakov’s equation (𝐼 = 𝐴𝑡 𝑛 ) for the cumulative depth of infiltration in any soil. To apply this equation, infiltration tests were performed before transplanting of tomato seedlings. The radius of the water pool formed on the soil surface (𝑟𝑤) was given as: 𝑟𝑤 2 = 0.955𝑄/𝑎[2𝑡 𝑏 + 3 𝑏 ] where Q is the emitter flow rate (cm3 min-1 ), 𝑎 = 𝐴 ∗ 𝑛 and 𝑏 = 𝑛 − 1 are constants obtained from Kostiakov cumulative infiltration equation. The description of this equation can be found in Subbaiah and Mashru (2013). The calculated radii of water pool on soil surface (𝑟𝑤) were plotted against time and a regression equation was obtained. The observed and calculated 𝑟𝑤 values were compared using statistical parameters of mean absolute error (MAE) and root mean square error (RMSE). Statistical analysis Data obtained on performance evaluation and soil water content in the different layers were subjected to descriptive analysis and analysis of variance (ANOVA) at 5% level of probability. Statistical analyses were done in SPSS (IBM version 20). III. RESULTS AND DISCUSSION Performance evaluation of the medi-emitters The descriptive statistics of the calibrated discharge rates of the medi-emitters installed in the tomato field under drip irrigation are presented in Table 2. Irrigation water supplied to the field at different frequency had no significant effect on the average discharge rates of the medi-emitters throughout the tomato growing cycle. The discharge rates from the medi-emitters ranged between 3.73 and 4.10 L/h; 3.57 and 4.07 L/h and 3.57 and 4.03 L/h shortly after transplanting, mid-season and harvest, respectively for the different drip irrigation regimes, with the mean discharge rate at par (3.91 L/h) for all treatments. The overall average calibrated discharge rate is slightly lesser (about 2.25% decrease) than the nominal discharge rate of 4 L/h from conventional drip emitters. The maintenance of the discharge rate throughout the growth cycle made it possible for supplying water towards meeting scheduled crop water requirements of the tomato crop. Table.2: Descriptive statistics of the discharge rate of the medi-emitters installed in the tomato field. Max. Min. Mean SD Irrigation frequency Shortly after transplanting F1 4.03 3.73 3.91a 0.083 F2 4.03 3.80 3.92a 0.054 F3 4.10 3.80 3.92a 0.062 Mid-season F1 4.07 3.57 3.89a 0.103 F2 4.07 3.77 3.93a 0.067 F3 4.00 3.77 3.90a 0.067 Harvest F1 4.10 3.57 3.89a 0.095 F2 4.03 3.60 3.92a 0.090 F3 4.00 3.80 3.91a 0.055 F1: irrigation every 7 days; F2: irrigation every 5 days and F3: irrigation every 3 days Means followed by the same letter did not differ significantly at 5% level of probability by Fisher’s LSD test.
  • 6. International Journal of Environment, Agriculture and Biotechnology (IJEAB) Vol-2, Issue-1, Jan-Feb- 2017 http://dx.doi.org/10.22161/ijeab/2.1.41 ISSN: 2456-1878 www.ijeab.com Page | 324 Variation in discharge Average discharge variation (Qvar) was significantly (P=0.05) influenced by the frequency of water application (Table 3). Shortly after transplanting, F1 and F3 treatments had significantly higher Qvar than F2 treatment. At mid- season stage, F1 treatment had the significantly highest Qvar(12.30) compared with other treatments. At harvest, similar result was obtained as F1 had the significantly highest Qvar (13.01). Except for F3 treatment, the variation in discharge increased with time. Table.3: Performance evaluation of the medi-emitters at planting, mid-season and harvest of tomato. Qvar EU 𝐶𝐺𝑣 DU Irrigation frequency Shortly after transplanting F1 7.44a 97.87a 2.13a 97.20a F2 5.79b 98.63a 1.37b 98.32a F3 7.32a 98.43a 1.57ab 98.11a Mid-season F1 12.30a 97.35a 2.65a 96.55a F2 7.38b 98.30a 1.70b 98.04a F3 5.83c 98.27a 1.73b 97.90a Harvest F1 13.01a 97.56a 2.44a 97.09a F2 10.74b 97.70a 2.30a 97.05a F3 5.00c 98.59a 1.41b 98.26a F1: irrigation every 7 days; F2: irrigation every 5 days and F3: irrigation every 3 days Means followed by the same letter did not differ significantly at 5% level of probability by Fisher’s LSD test. The significantly higher and increase in Qvar over time obtained from F1 and F2 treatments are attributed to certain phenomena taking place during the period (7 and 5 days, respectively) which the medi-emitters remained closed. For example, there may have been accumulation of dirts at the close point, causing partial plugging or the difficulty of the light hose to fully open as a result of elastic behaviour of the material. Thus, each time the emitters are reopened, about 2-3 minutes are needed before the system stabilizes, thus the higher variability. Mofoke et al. (2004) stated that the general variability in discharge could be attributed to major and minor losses occurring at the delivery pipe joints and fittings right from the supply tank to the emitters (e.g. inherent leakages at the point of immersion of emitters to the main line). Coefficient of global variation The coefficient of global variation (CGv) in discharge describes the quality of the processes used to manufacture emission devices. The coefficient of global variation was significantly (P=0.05) affected by the frequency of water application. At the different periods of evaluation, the medi- emitters installed in F1 treatment had the significantly highest CGv (Table 3). The average values of CGv were generally low (not more than 2.65) and according to American Society of Agricultural Engineering (ASAE EP 1985) recommended classification of coefficient of global variation in discharge, these values are below the 10% threshold as ‘good’ for point source emitters. This showed that the adopted medical infusion set (medi-emitters), coupled with mechanism to control flow rate, can be employed as substitute for the conventional drippers for drip irrigation systems. This result agrees with the findings of Mofoke et al.(2004) and Awe and Ogedengbe (2011) on the adoption of medical infusion set as drip emitters. Emission and distribution uniformity Emission uniformity (EU) describes how evenly an irrigation system distributes the same depth of water to every unit area. On the other hand, distribution uniformity (DU) is an indicator of the magnitude of the system’s distribution problems. Although F1 treatment had the lowest values (about 97%) of the uniformity coefficients, but they did not significantly differ from other treatments. According to the classification of irrigation system performance by ASAE EP 405 (1985), an EU rating of 90 - 95% is considered excellent and the system would only require regular maintenance, while a DU of 85% or greater
  • 7. International Journal of Environment, Agriculture and Biotechnology (IJEAB) Vol-2, Issue-1, Jan-Feb- 2017 http://dx.doi.org/10.22161/ijeab/2.1.41 ISSN: 2456-1878 www.ijeab.com Page | 325 is considered excellent. In this study, the average values of both EU and DU monitored at different stages of the tomato growth cycle were above the maximum threshold for micro- drip irrigation system, indicating that the system performance was excellent. The high EU and DU values followed the trend of observed low coefficient of global variation in discharge (CGv). The lower EU and DU obtained from F1 treatment is attributed to higher CGv observed. These findings also agree with previous studies (Mofoke et al. 2004; Awe and Ogedengbe 2011). The EU values obtained are also comparable to those of Manisha et al. (2015) who studied the performance evaluation of conventional drip irrigation system at discharge rate of 4 L/h. Spatio-temporal distribution of profile soil water content The temporal variability of soil water content of the tomato field during the performance evaluation of the medi- emitters is presented in Fig 2. Fig.2: Temporal distribution of soil water content of the tomato field during the performance evaluation test of the medi-emitters. The vertical bars are the standard error s: significant at 5% level of probability by Fisher’s least significant difference test. There were significant differences in the average SWC in the different soil layers under the different time of irrigation, with the 30-40 cm layer having the lowest SWC at all times. As expected, the SWC of each soil layer increases with time, with the 10-20 cm layer having the lowest amplitude while the 30-40 cm layer had the highest amplitude. The amplitude of the 0-10 cm surface layer was high compared to that of 10-20 cm layer. The high amplitude in the surface layer is attributed to evaporation since it is the layer that is exposed to the atmosphere. The SWC of the 0-10 cm surface layer was about 28.9% greater than that of 30-40 cm layer when irrigated for 15 minutes. However, at the end of 90 minutes of irrigation, the 0-10 cm surface layer had SWC higher than that of 30-40 cm layer by 14.6%, about half reduction. The high amplitude and high percent difference in the SWC of 30-40 cm layer at the initial stage compared with the surface layer is attributed to relative dryness in the subsurface layer when the evaluation was conducted, during this time, very few centimeters from the soil surface have been wetted (Fig 3). On the other hand, the rapid reduction in the gap between the SWC of the surface and subsurface layer at the end of 90 minutes is attributed to high water percolation and redistribution, in other words, high advance of wetting front in the soil matrix due to the sandy nature of the soil. Sandy-textured soils have greater macropores which facilitate rapid water movement and redistribution. The advance of the wetting front within the soil profile can be seen in the spatial distribution map shown in Fig 3.
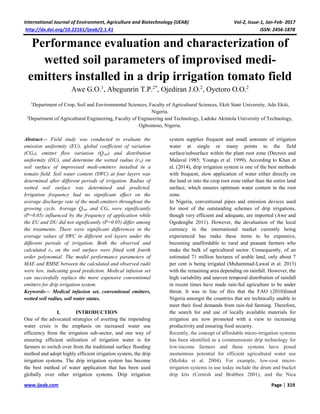
  • 8. International Journal of Environment, Agriculture and Biotechnology (IJEAB) Vol-2, Issue-1, Jan-Feb- 2017 http://dx.doi.org/10.22161/ijeab/2.1.41 ISSN: 2456-1878 www.ijeab.com Page | 326 Fig.3: Spatial map showing the wetting front in the soil profile with time during the performance evaluation of the medi-emitters. Cumulative infiltration and radius of water pool formed on the soil surface The cumulative infiltration function of the tomato field shortly after installation of the drip irrigation system is shown in Fig 4. Fig.4: Cumulative infiltration of the field before the installation of the drip irrigation system. The total cumulative infiltration was found to be about 50 cm. There was near perfect (R2 = 0.9977) goodness of fit between the observed cumulative infiltration values and the Kostiakov model. For this soil, the model constants for the radius of the water pool on the soil surface, 𝑟𝑤 2 = 0.955𝑄/𝑎[2𝑡 𝑏 + 3 𝑏 ], 𝑎 was 0.1176 while 𝑏 was -0.1752. The radius of wetted soil volume is an important parameter when deciding spacing between emitters for a given set of soil and crop conditions. It also a vital component in optimizing emitter spacing based on the geometry of the wetted soil volume and in the determination of length of laterals (Subbaiah and Mashru 2013). The temporal distribution of observed and calculated wetted radii on the soil surface by the medi-emitters is shown in Figure 5. I = 0.1426t0.8248 R² = 0.9977 0 1 2 3 4 5 0 10 20 30 40 50 60 70 Cum.infiltration,cm Time, min
  • 9. International Journal of Environment, Agriculture and Biotechnology (IJEAB) Vol-2, Issue-1, Jan-Feb- 2017 http://dx.doi.org/10.22161/ijeab/2.1.41 ISSN: 2456-1878 www.ijeab.com Page | 327 Fig.5: Calculated and observed wetted radius of the soil surface by the medi-emitters. Increased duration of irrigation increased the wetted radius, in other words, the radial area of ponded water develops in the vicinity of the medi-emitters and expands with time. Both the observed and calculated radius of water pool on the soil surface as a function of time was fitted well with fourth order polynomial as also obtained by Subbaiah and Mashru (2013) who modeled the effect of three discharge rates on soil wetted radius of a point source surface trickle irrigation. The goodness of fit was 0.9222 and 0.8045 for the calculated and observed radii, respectively. These values were lower than those obtained by Subbaiah and Mashru (2013) who employed conventional drippers compared to the improvised medi-emitters used for this study. In addition to goodness of fit, model validation parameters of mean absolute error (MAE) and root mean square error (RMSE) were used to compare observed and calculated 𝑟𝑤 values and they were 0.2258 and 0.2573, respectively. The MAE shows the bias while the RMSE is an indication of the prediction accuracy (Chai and Draxler 2014). These values were low, indicating good prediction. In this study, only a single emitter discharge rate was evaluated, therefore we recommend further studies to include the effect of different medi-emitter discharge rates on wetted radius on the soil surface as well as depth of water pool in the subsurface. Nevertheless, this model can be used to determine the geometry of wetted bulb from surface drippers, whether conventional or improvised, for any operating discharge rate for a specific duration. IV. CONCLUSIONS The discharge rate of the medi-emitters did not vary throughout the tomato growing cycle and was almost at par compared to that of conventional emitter. According to American Society of Agricultural Engineering (ASAE 1985) recommendation, the evaluated parameters showed that the system performance was excellent. The different periods of irrigation significantly influenced the average values of SWC in the different soil layers. The model performance parameters of goodness of fit, MAE and RMSE between the calculated and observed radii showed that the mathematical model can be used to predict the radius of wetted soil surface under any surface drip irrigation system. The results of the study showed that the medical infusion set, with locally produced polyvinyl chloride pipes (PVC), can successfully replace the more expensive conventional emitters and delivery pipes for drip irrigation system. However, we recommend further studies to include the effect of different discharge rates on wetted radius on the soil surface as well as depth of water pool in the subsurface. REFERENCES [1] Abegunrin TP, Awe GO, Idowu DO, Onigbogi OO Onofua OE (2013) ‘‘Effect of kitchen wastewater on soil properties and growth parameters of cucumber (Cucumis sativus)’’. Journal of Soil Science and Environment. 4(7): 139- 145.doi:10.5897/JSSEM2013.0412
  • 10. International Journal of Environment, Agriculture and Biotechnology (IJEAB) Vol-2, Issue-1, Jan-Feb- 2017 http://dx.doi.org/10.22161/ijeab/2.1.41 ISSN: 2456-1878 www.ijeab.com Page | 328 [2] Anon (2003). Smart Water Solutions: examples of innovative, low-cost technology for wells, pumps, storage, irrigation and water treatment. - Netherlands Water Partnership (NWP). Delft, the Netherlands. [3] ASAE- American Society of Agricultural Engineers (1985) Design, installation and performance of trickle irrigation systems, EP 405, pp.508. [4] ASAE- American Society of Agricultural Engineers. (1996). Field evaluation of micro-irrigation systems, EP 458, 792-797. [5] Awe GO, Ogedengbe K (2011) Performance evaluation of bamboo (Bambusa vulgaris Schrad)-pipe and medi-emitter in a gravity-flow drip irrigation system. Int. J. Agric. For., 1(1): 9-13. [6] Bissrat G, Asghedom S, Mehari A (2001) Affordable micro-irrigation technology (AMIT). In: Eritrea Pre- feasibility study report, March-September 2001. Report of a consultative project between the Centre for Development and Environment (CDE), University of Bern, International Development Enterprises (IDE) and the College of Agriculture and Aquatic Science (CAAS), University of Asmara. [7] Chai T, Draxler RR (2014). Root mean square error (RMSE) or mean absolute error (MAE)? Arguments against avoiding RMSE in literature. Geosic. Model Dev., 7: 1247-1250. [8] Cornish G, Brabben T (2001) Field guide on irrigated agriculture for field assistants. International programme for technology and research in irrigation and drainage. FAO, Rome. [9] Decroix M, Malaval A (1985) Laboratory evaluation of trickle irrigation equipment for field system design. Proceedings of the third International Drip/Trickle Irrigation Congress, Volume I, California, USA. pp. 325-338. [10]FAO (2010) FAOSTAT Production Yearbook 2010. [11]Frizzone JA (1997) Uniformidade e eficiencia da irrigacao. Departmento de Engenharia Rurual, ESALQ, Serie didatica, Piracicaba. 2-18. [12]Keller J, Blisner RD (1990) Sprinkler and trickle irrigation. Van Nostrand Reinhold, New York. Pp 427- 602. [13]Keller J, Karmeli D (1974) Trickle irrigation design parameters. Transaction of ASAE, 7, 687-684. [14]Khan GD, Ali A, Akbar F (2014) Assessment of coefficient of variation of emitters flow rate with respect to design, manufacturers and plugging in installed drip irrigation systems at selected sites of Peshawar valley. Adv. Life Sci. Tech., 19: 27-32. [15]Manisha I, Sinha J, Tripathi MP (2015) Studies on hydraulic performance of drip irrigation under operating pressure. Int. J. Appl. Eng. Tech., 5(2): 1-6. [16]Masimba B (2003) Drip irrigation helps smallholders. - In: “African Farming and Food Processing” July/August 2003 edition. (J. Phelan ed.). Alain Charles Publishing Ltd. London. [17]Mofoke ALE, Adewumi JK, Mudiare OJ, Ramahan AA (2004) Design, construction and evaluation of an affordable continuous – flow drip irrigation system. Journal of Applied Irrigation Science. 39(2): 253-269. [18]Muhammad-Lawal A, Adenuga AH, Jimoh O (2013). Determinants of adoption irrigation technology by small-holder farmers is selected Local Government Areas in Kwara State, Nigeria. Taraba Journal of Agricultural Research, 1(1): 21-27. [19]Olaniyi JO, Akanbi WB, Adejumo TA, Akande OG (2010). Growth, fruit yield and nutritional quality of tomato varieties. Afric. J. Food Sci., 4(6): 398-402. [20]Polak P, Bob N, Deepak A (1997): A low cost drip irrigation system for small farmers in developing countries. Journal of Applied Irrigation Science. 32(1), 105-112. [21]Sammis TW, Wu IP (1985) Effect of drip irrigation design and management on fruit trees yield. Transactions of the ASAE American Society of Agricultural Engineers. 28(3): 832-838. [22]Soccol OJ, Ullmann MN, Frizzone JA (2002) Performance analysis of a trickle irrigation subunit installed in apple orchard. Brazilian Archives of Biology and Technology. 45(4): 525-530. [23]Soil Survey Staff (SSS) (2006). Keys to soil taxonomy. 10th ed. Washington, USDA-SCS, P. 332. [24]Solomon KH (1984) Yield related interpretations of irrigation uniformity and efficiency measures. Irrig. Sci. 5:161-172. [25]Subbaiah R, Mashru HH (2013) Modeling for predicting soil wetting radius under point source surface trickle irrigation. Agric. Eng. Int.: CIGR Journal, 15(3): 1-10. [26]Youngs EG, Leeds-Harrison PB, Alghusni A (1999) Surface pounding of coarse-textured soils under irrigation with a line of surface emitters. J. Agric. Eng. Res., 73: 95-100.