
Recommended
Recommended
More Related Content
What's hot
What's hot (20)
Viewers also liked
Viewers also liked (19)
Similar to Sensitivity of wheat to under irrigation
Similar to Sensitivity of wheat to under irrigation (20)
More from Kaveh Ostad-Ali-Askari
More from Kaveh Ostad-Ali-Askari (12)
Sensitivity of wheat to under irrigation
- 1. International Journal of Agriculture and Crop Sciences. Available online at www.ijagcs.com IJACS/2015/8-4/602-605 ISSN 2227-670X ©2015 IJACS Journal Study of sensitivity of Autumnal wheat to under irrigation in Shahrekord, Shahrekord City,Iran Kaveh Ostad-Ali-Askari1* , Mohammad Shayannejad2 1. MSc, Civil Engineering, Water Engineering Department, Lecturer of Islamic Azad University of Najafabad, Isfahan , Iran. 2. Associate Professor, Water Engineering Department, Isfahan University of Technology, Isfahan, Iran. *Corresponding author email: Ostadaliaskarik@pci.iaun.ac.ir ABSTACT: In order to study the sensitivity rate of autumnal wheat (Omid variety) to under irrigation, a fully random project was conducted in the research farm of the Shahrekord University, Iran including 9 irrigation treatments and four replications. Irrigation treatments were applied form May 22, 2007 since before this data in Shahrekord, Iran there is no need to irrigation. Irrigation time was when 50% of the soil (humidity in the treatment receiving full irrigation was discharged. This was done through placing gypsum blocks in the root zone. Therefore the irrigation water depth was half of the water retention capacity in the root zone. Based on the consumed water values and yield, relation between percentage of yield decrease and percentage of water consumption was achieved. Contrary to the Stewart’s relation, this relation was a nonlinear one. Based on these relations, for a specific decrease of consumed water (ex 30%), yield decrease is about 3%. This finding indicates that the Omid variety of wheat in Shahrekord, Iran shows little sensitivity to under irrigation. Keywords: under irrigation; Production functions; Wheat. INTRODUCTION Regarding the issue of drought in Iran, optimal use of water and soil resources is quite essential. Paying attention to the irrigation issue in irrigated farming is one of the important methods for achieving this goal. Therefore application of correct irrigation management especially in surface irrigation methods is essential. Under irrigation is one of the irrigation managerial methods which in the conditions of water deficiency can be very beneficial. Sensitivity of various plants to under irrigation varies. In 1980 Mucik and Dusk (Musick et al., 1980) studied the effects of under irrigation on wheat. They pointed out that in case water potential in leaf is decreased from a critical level, negatively influences yield. Tomas et al. (Thomas et al., 1970) found out that those plants that during their vegetative growth period can tolerate water stress have higher tolerance for drought in their later periods of growth compared with other plants. Stewart (Stewart et al., 1982) concluded from their investigations that those plants are suitable for under irrigation that their growth season is short and can tolerate drought. In 1983 Hang and Miller (Hang et al., 1983) cultivated wheat at condition of under irrigation in two types of sandy and loamy soils. In 1990, Stag man et al. (Stegman et al., 1990) reported that although water stress close to flowering period might cause decreased flowering rate in lower part of the plant crown, through beginning of full irrigation amount of pods at higher parts of the plant crown increase and compensate the previous part. In 2000, smith and Quiombi (Smith et al., 2000) applied the CROPWAT model (developed by FAO in 1992) for under irrigation studies. Their goal was improvement of water consumption efficiency using under irrigation. This project was conducted through cooperation of FAO and the International Atomic Energy Agency (section of unclear techniques in food and agriculture). In 2000, Corida (Kirda, 2000) applied the following production function which was developed in 1977 by Stewart et al. (Stewart et al., 1977) for various crops and under varied conditions. maxmax 11 ET ET K Y Y a y (1) Where: Y= obtained yield, Ymax= Maximum yield, Ky= Crop sensitivity factor, ETa= real evaporation and transpiration, ETmax= maximum evaporation and transpiration. (unit used for yield is kg/ha and evaporation and transpiration unit is millimeters. Equation (1) indicates that the relation between decreased yield and water
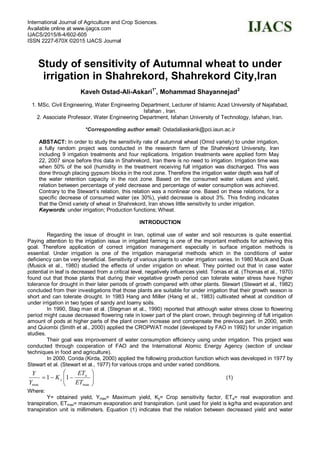
- 2. Intl J Agri Crop Sci. Vol., 8 (4), 602-605, 2015 603 decrease percentage is a linear one. The higher the Ky, the more plant is sensitive to water stress which depends on the plant type, variety, irrigation method and stage or stages of growth when under irrigation has been applied. He obtained Ky values for different crops in Turkey and for various irrigation conditions. Results indicate that in case under irrigation is applied only in the vegetative growth phase; Ky would be less than in the case this has been done in the flowering stage. For example he reported the Ky values for wheat at various conditions as in table 1. The objective of this research is to study sensitivity of autumnal wheat to under irrigation. This sensitivity will be expressed by the relationship between percentage of crop decrease and percentage of water decrease. MATERIALS AND METHODS This project was conducted on autumnal wheat (Omid variety) in the university farm (with a sandy- loamy fabric) as follows in the water year 2005-2006: A fully random project with 36 1 m2 plots including 9 irrigation treatments and 4 replications and in each plot in late November 2005 about 30g wheat was sown by hand. Nitrogen fertilizer at a rate of 30gr/plot was applied in March and June 2005. Irrigation treatment started for the beginning of June 2005 since before this date in Shahrekord, Iran there is no need for irrigation. Irrigation time was when 50% of soil humidity in fully irrigated treatments was discharged. This was done by installing gypsum blocks at the root zone. Therefore the irrigation water depth was equal to half of the water retention capacity at the root zone. Then this depth is multiplied as surface of a plot and irrigation volume at each turn was computed and measured by a counter. For example if in a known irrigation turn, irrigation water depth for providing will full requirements of the plant is equal to d and irrigation water volume is equal to V, irrigation treatments applied in the above said turn were performed in accordance with table 2. Therefore, from the 9 treatments, the two treatments T1 and T2 were over irrigated, treatment T3 was irrigated as needed and the 6 other treatments were subjected to under irrigation. Table3 indicates the fully random plan used in this research. During the stress period, six irrigations were done that regarding the above details, the volume of irrigation water for each treatment in each irrigation turn was computed the results of which are summarized in table 4 (since surface of each block is 1m 2 ). It is worth mentioning that in the project of optimizing the agricultural water consumption model prepared by the National Department of Jihad Keshavarzi and Aerology, the rate of autumnal wheat requirement to water has been computed to be 381mm. In late July 2006 wheat crop of each block was harvested, then the total weight, weight of grains, and weight of one thousand grains were measured. CONCLUSION AND DISCUSSION In tables 5 to 7 results of total yield, gran and straw presented. Regarding the above tables it can be found out that the maximum values of the yield components concern treatment T2 and it minimum values are those of treatment T9. Because treatment T2 has the maximum yield, it can be concluded that in this treatment full irrigation has been done while in the previous season treatment T3 had been considered as the full irrigation. This is due to error in measuring the soil humidity followed by water requirement of the plant. Also, based on the rate of consumed water (table 4) and yield (tables 5 to 7), the relation between percentage of decreased yield and percentage of water decrease can be obtained. This had been done and depicted by figures 1 to 3 for total grain yield and straw yield. Regarding these figures, the relation between decreased yield and decreased water consumption for wheat in Shahrekord, Iran contrary to Stewart relation (Chapter one), is a nonlinear relation. These figures indicate that for a definite decrease of water consumption (i.e. 30%), yield decrease is about 3%. This finding shows that the Omid variety of wheat in Shahrekord, Iran shows little sensitivity to under irrigation. Table 1. Different levels of sensitivity factor product Ky Irrigation method Irrigation procedures 0.76 Springer irrigation Whole growth season 0.93 Plot irrigation Whole growth season 0.39 Plot irrigation Flowering and filing period
- 3. Intl J Agri Crop Sci. Vol., 8 (4), 602-605, 2015 604 Table 2. Irrigation treatments. Treatment T9 T8 T7 T6 T5 T4 T3 T2 T1 Irrigation volume 0.4V 0.5V 0.6V 0.7V 0.8V 0.9V V 1.1V 1.2V Table 3. Representation of the used research project T9T2T3T8T7T1T2T9T1 T2T8T3T5T6T1T7T5T9 T8T6T7T4T5T7T9T5T3 T2T4T8T6T3T4T1T6T4 Table 4. Total irrigation volume (l) in all treatments. Treatment T9 T8 T7 T6 T5 T4 T3 T2 T1 Total irrigation volume 120 150 180 210 240 270 300 330 360 Table 5. The total yield (grams per square meter in half) Treatment T1 T2 T3 T4 T5 T6 T7 T8 T9 1 632 618 610 602 598 571 579 530.2 521 2 601 625 607 611 597 670 585.2 547 517 3 630 600 630 618 630 589 590 542 520 4 630 653 625 620 600 565 580 544 529 Mean 623.25 624 618 612.75 606.25 598.75 583.55 540.8 521.75 Table 6. The grain yield (grams per square meter in half) Treatment T1 T2 T3 T4 T5 T6 T7 T8 T9 1 287 280 275 273 271 273 263 241 241 2 268 285 277 279 266 253 266 269 235 3 287 269 291 280 290 285 269 245 233 4 290 302 282 281 276 280 280 248 245 Mean 283 284 281.25 278.25 275.75 272.75 269.5 260.75 238.5 Table 7. The straw yield (grams per square meter half) Treatment T1 T2 T3 T4 T5 T6 T7 T8 T9 1 345 338 335 329 327 298 316 290.2 281 2 333 340 330 332 331 417 318.9 280 283 3 343 331 339 337.7 340 304 320.5 297 287 4 340 351 342.8 338.3 325 285.6 300 296 284 Mean 340.25 340 336.7 334.35 75/330 326.15 313.85 290.8 283.75 Figure 1. The relationship between the product and the percent reduction in water
- 4. Intl J Agri Crop Sci. Vol., 8 (4), 602-605, 2015 605 Figure 2. The relationship between grain yield and percent reduction in water. Figure 3. the relationship between wheat yield reduction of water loss REFERENCES Hang AN, Miller DE.1983. “Wheat development as affected by deficit high frequency sprinkler irrigation”. Agronomy Journal, Vol. 75, pp.234-239. DOI: 10.2134/agronj1983.00021962007500020018x Kirda C.2000. “Deficit irrigation scheduling based on plant growth stages showing water stress tolerance. FAO. Deficit Irrigation Practices”. Water Reports 22. Musick JI, Dusck DA.1980. “Planting data and water deficit effects on development and yield of irrigated winter wheat”. Agronomy Journal, Vol. 72, pp.45-52, DOI: 10.2134/agronj1980.00021962007200010010x Smith M, Kivumbi D. 2000. “Use of the FAO CROPWAT model in deficit irrigation studieds. FAO. Deficit Irrigation Practices”. Water Reports 22. Stegman EC, Schatz BG, Gardner JC.1990. “Yield sensitivites of short season soybeans to irrigation management”. Irrigation Science. Vol. 11, pp. 111-119. DOI: 10.1007/bf00188447 Stewart BA, Musick JT.1982. “Conjunctive use of irrigation and rainfall in semi-arid regions”. Advances in Agronomy, Vol. 1, pp.1-23, DOI: 10.1016/b978-0-12-024301-3.50007-1. Stewart JI, Cuenca RH, Pruitt WO, Hagan RM, Tosso J. 1977. “Determination and utilization of water production function for principal california crops. W-67 California Contributing Project Report. Davis”. United States of America, University of California. Thomas JC, Brown KW, Jordan JR..1970. “Stomatal response to leaf water potential as affected by preconditioning water stress in the field”. Agronomy Journal, Vol. 68, pp.706-708, DOI: 10.2134/agronj1976.00021962006800050003x.