Download as PDF, PPTX


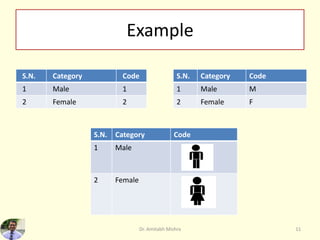
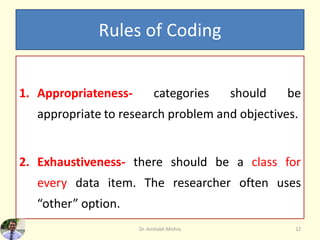
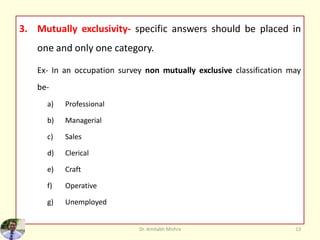
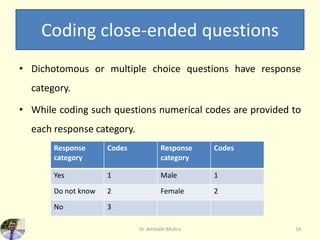
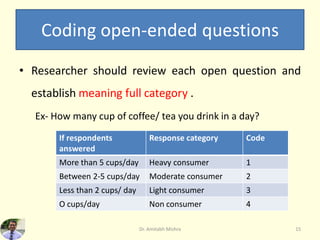
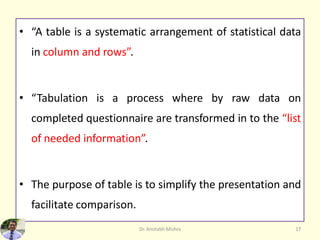
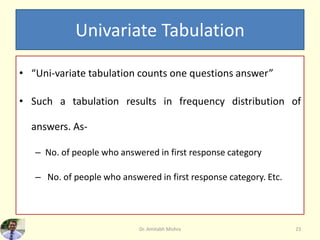
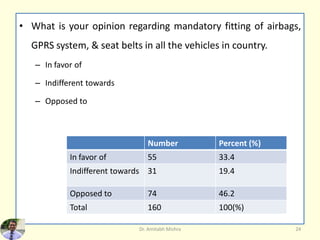
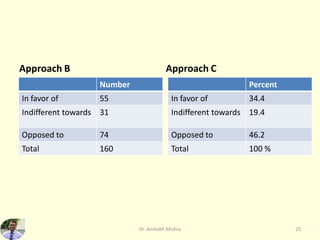
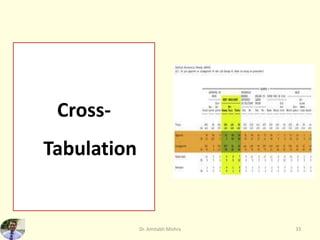

1. The document discusses various steps involved in data processing such as editing, coding, tabulation and cross-tabulation. 2. Editing involves detecting and correcting errors in raw data to ensure accuracy, completeness, consistency and uniformity. Coding assigns numerical codes to questionnaire responses to simplify analysis. 3. Tabulation organizes data into tables or lists to facilitate analysis and comparison. It can be univariate, tabulating one variable, or bivariate/multivariate, tabulating relationships between two or more variables. 4. Cross-tabulation summarizes the relationship between two or more categorical variables by classifying data into a contingency table. It provides a basic understanding of how variables are interrelated.