The document discusses various steps and techniques for preparing and analyzing data, including:
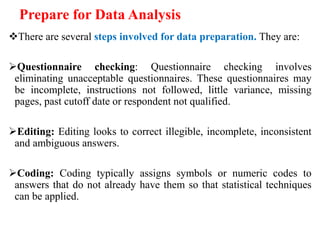
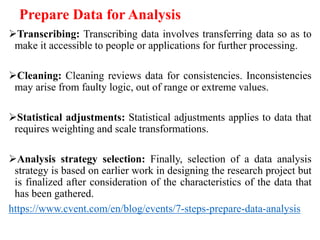
1) Steps for data preparation such as questionnaire checking, editing, coding, transcribing, cleaning, statistical adjustments, and selecting an analysis strategy.
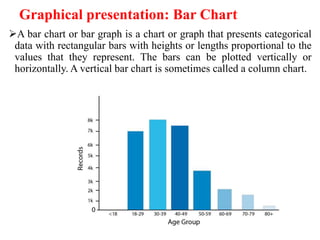
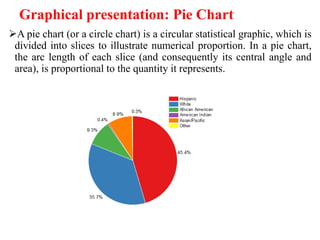
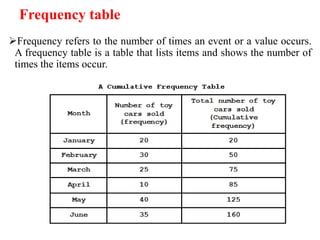
2) Common graphical presentations like bar charts, pie charts, and frequency tables to visualize categorical data.
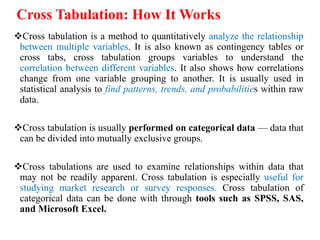
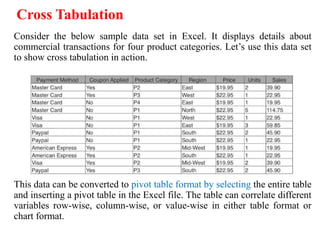
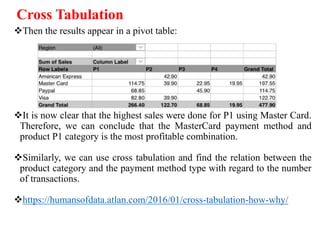
3) Cross tabulation as a method to analyze relationships between multiple variables by grouping them in contingency tables to identify patterns and correlations.
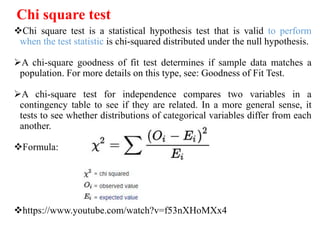
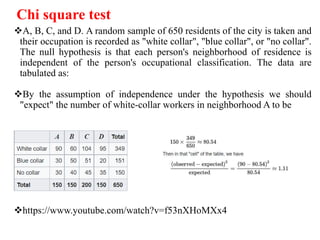
4) The chi-square test as a statistical hypothesis test to determine if sample data matches a population distribution or to compare two variables in a contingency table to assess independence.