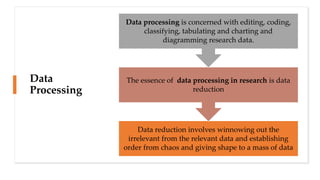
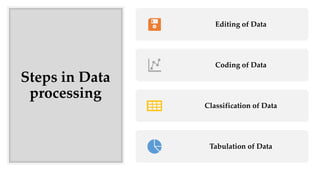
This document outlines the key steps in data processing:
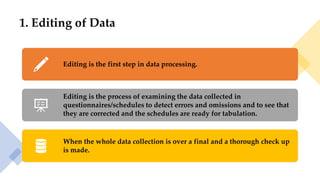
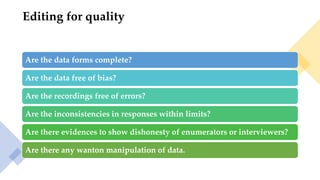
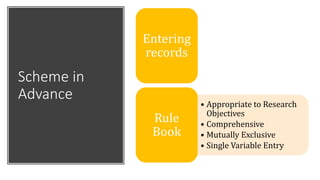
1. Editing of data to check for errors, omissions, and ensure consistency. This includes field editing by enumerators and central editing.
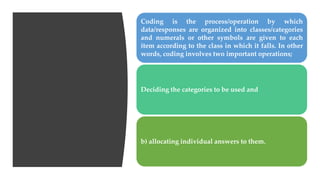
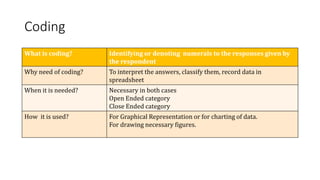
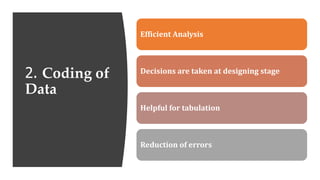
2. Coding of data which assigns numerical or symbolic codes to categorize responses for analysis and representation.
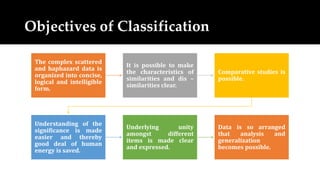
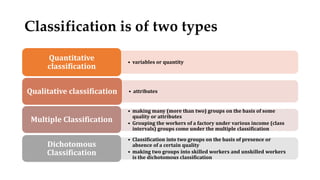
3. Classification which organizes complex data into logical groups based on attributes. This includes quantitative and qualitative classification.
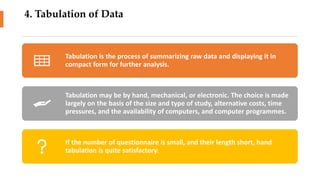
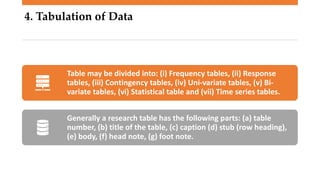
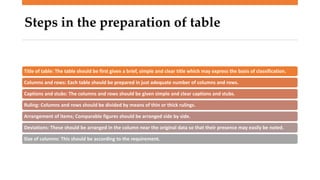
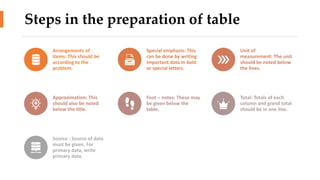
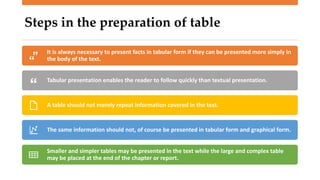
4. Tabulation of data which summarizes raw data and displays it in a table format for further analysis, including frequency tables and contingency tables. Proper table construction includes clear titles, units of measurement, and footnotes.