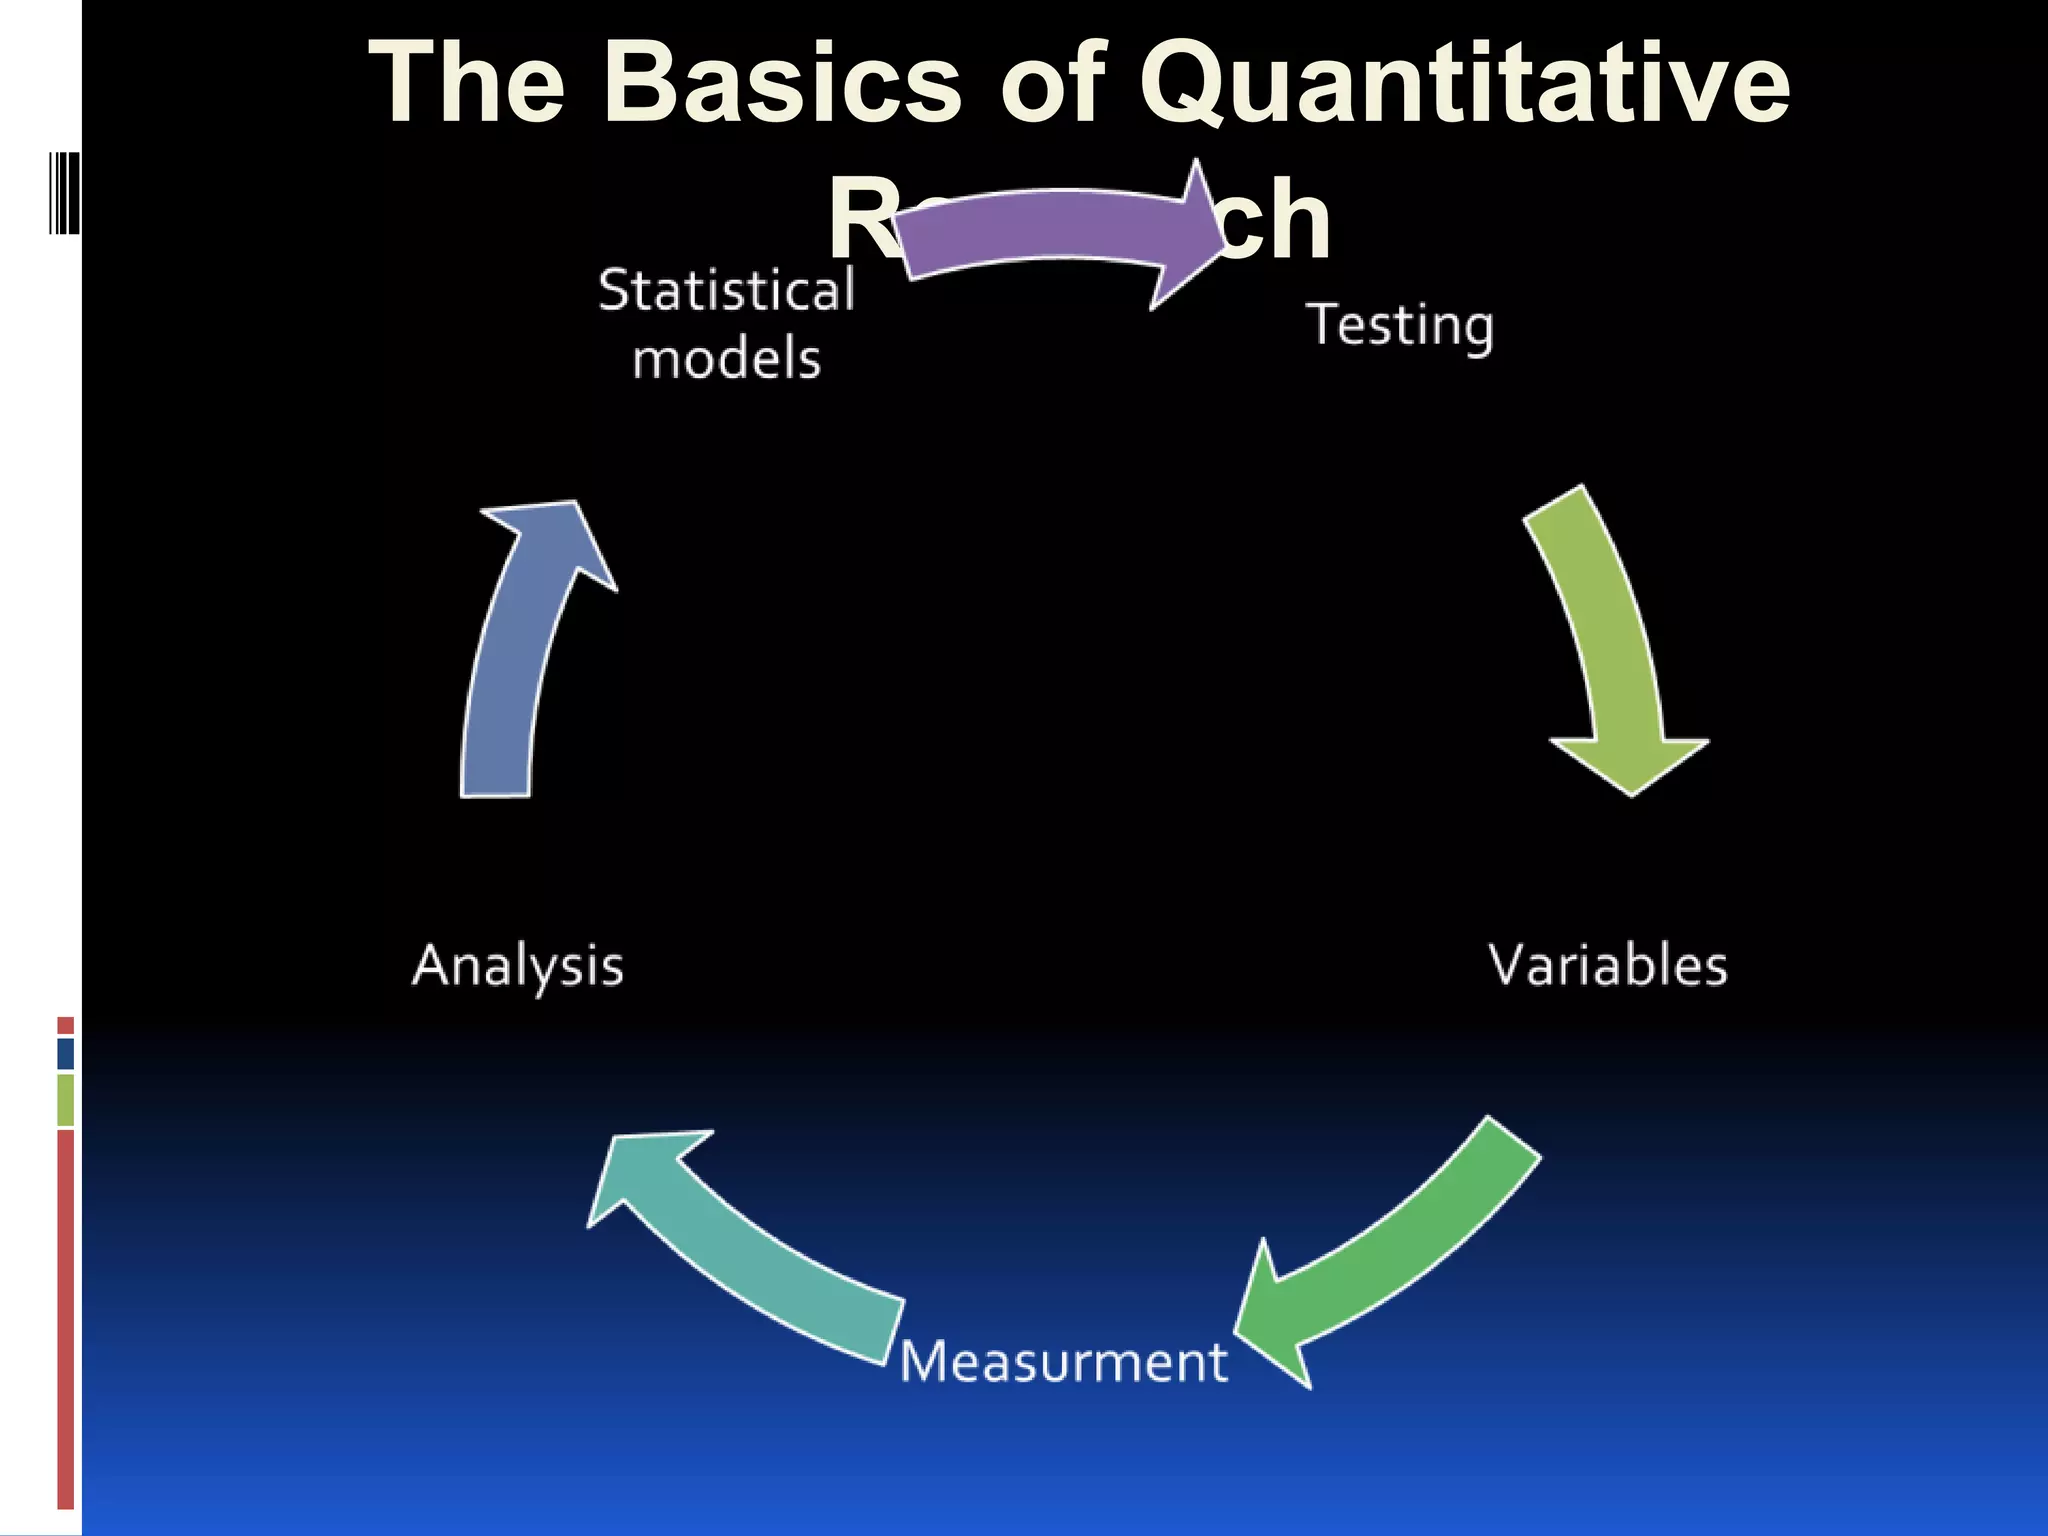
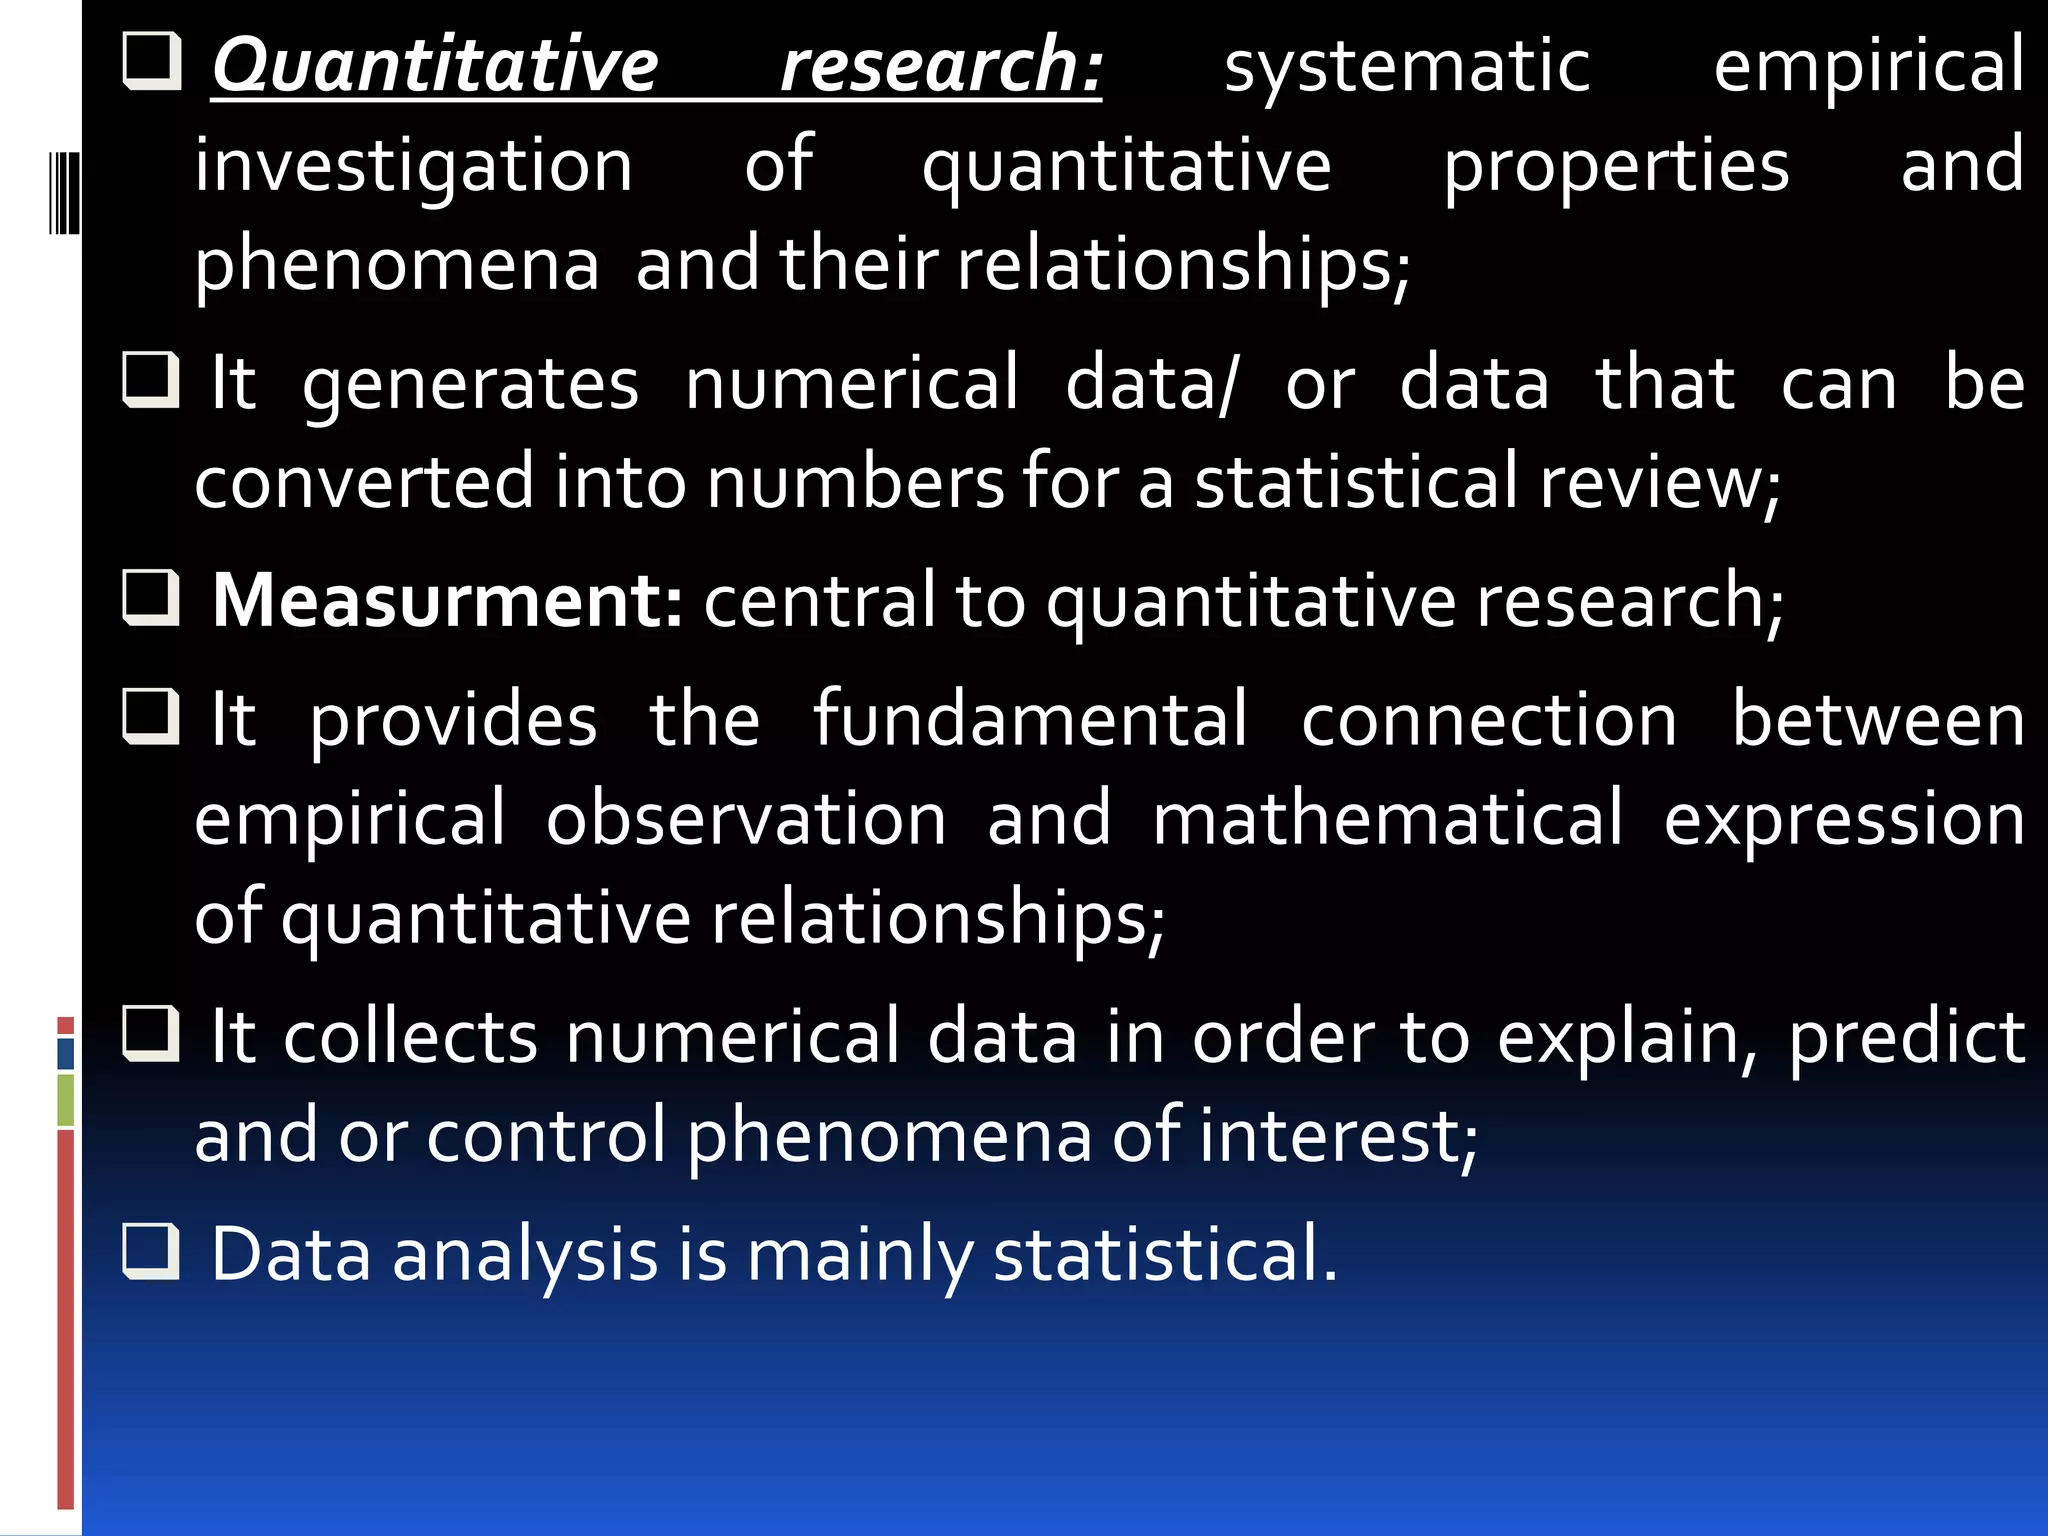
This document provides an overview of quantitative research methodology. It defines quantitative research as involving systematic empirical investigation that generates numerical data to study properties and phenomena. Key aspects discussed include:
- Quantitative research relies on measurement, statistical analysis, and large sample sizes to generalize results to populations.
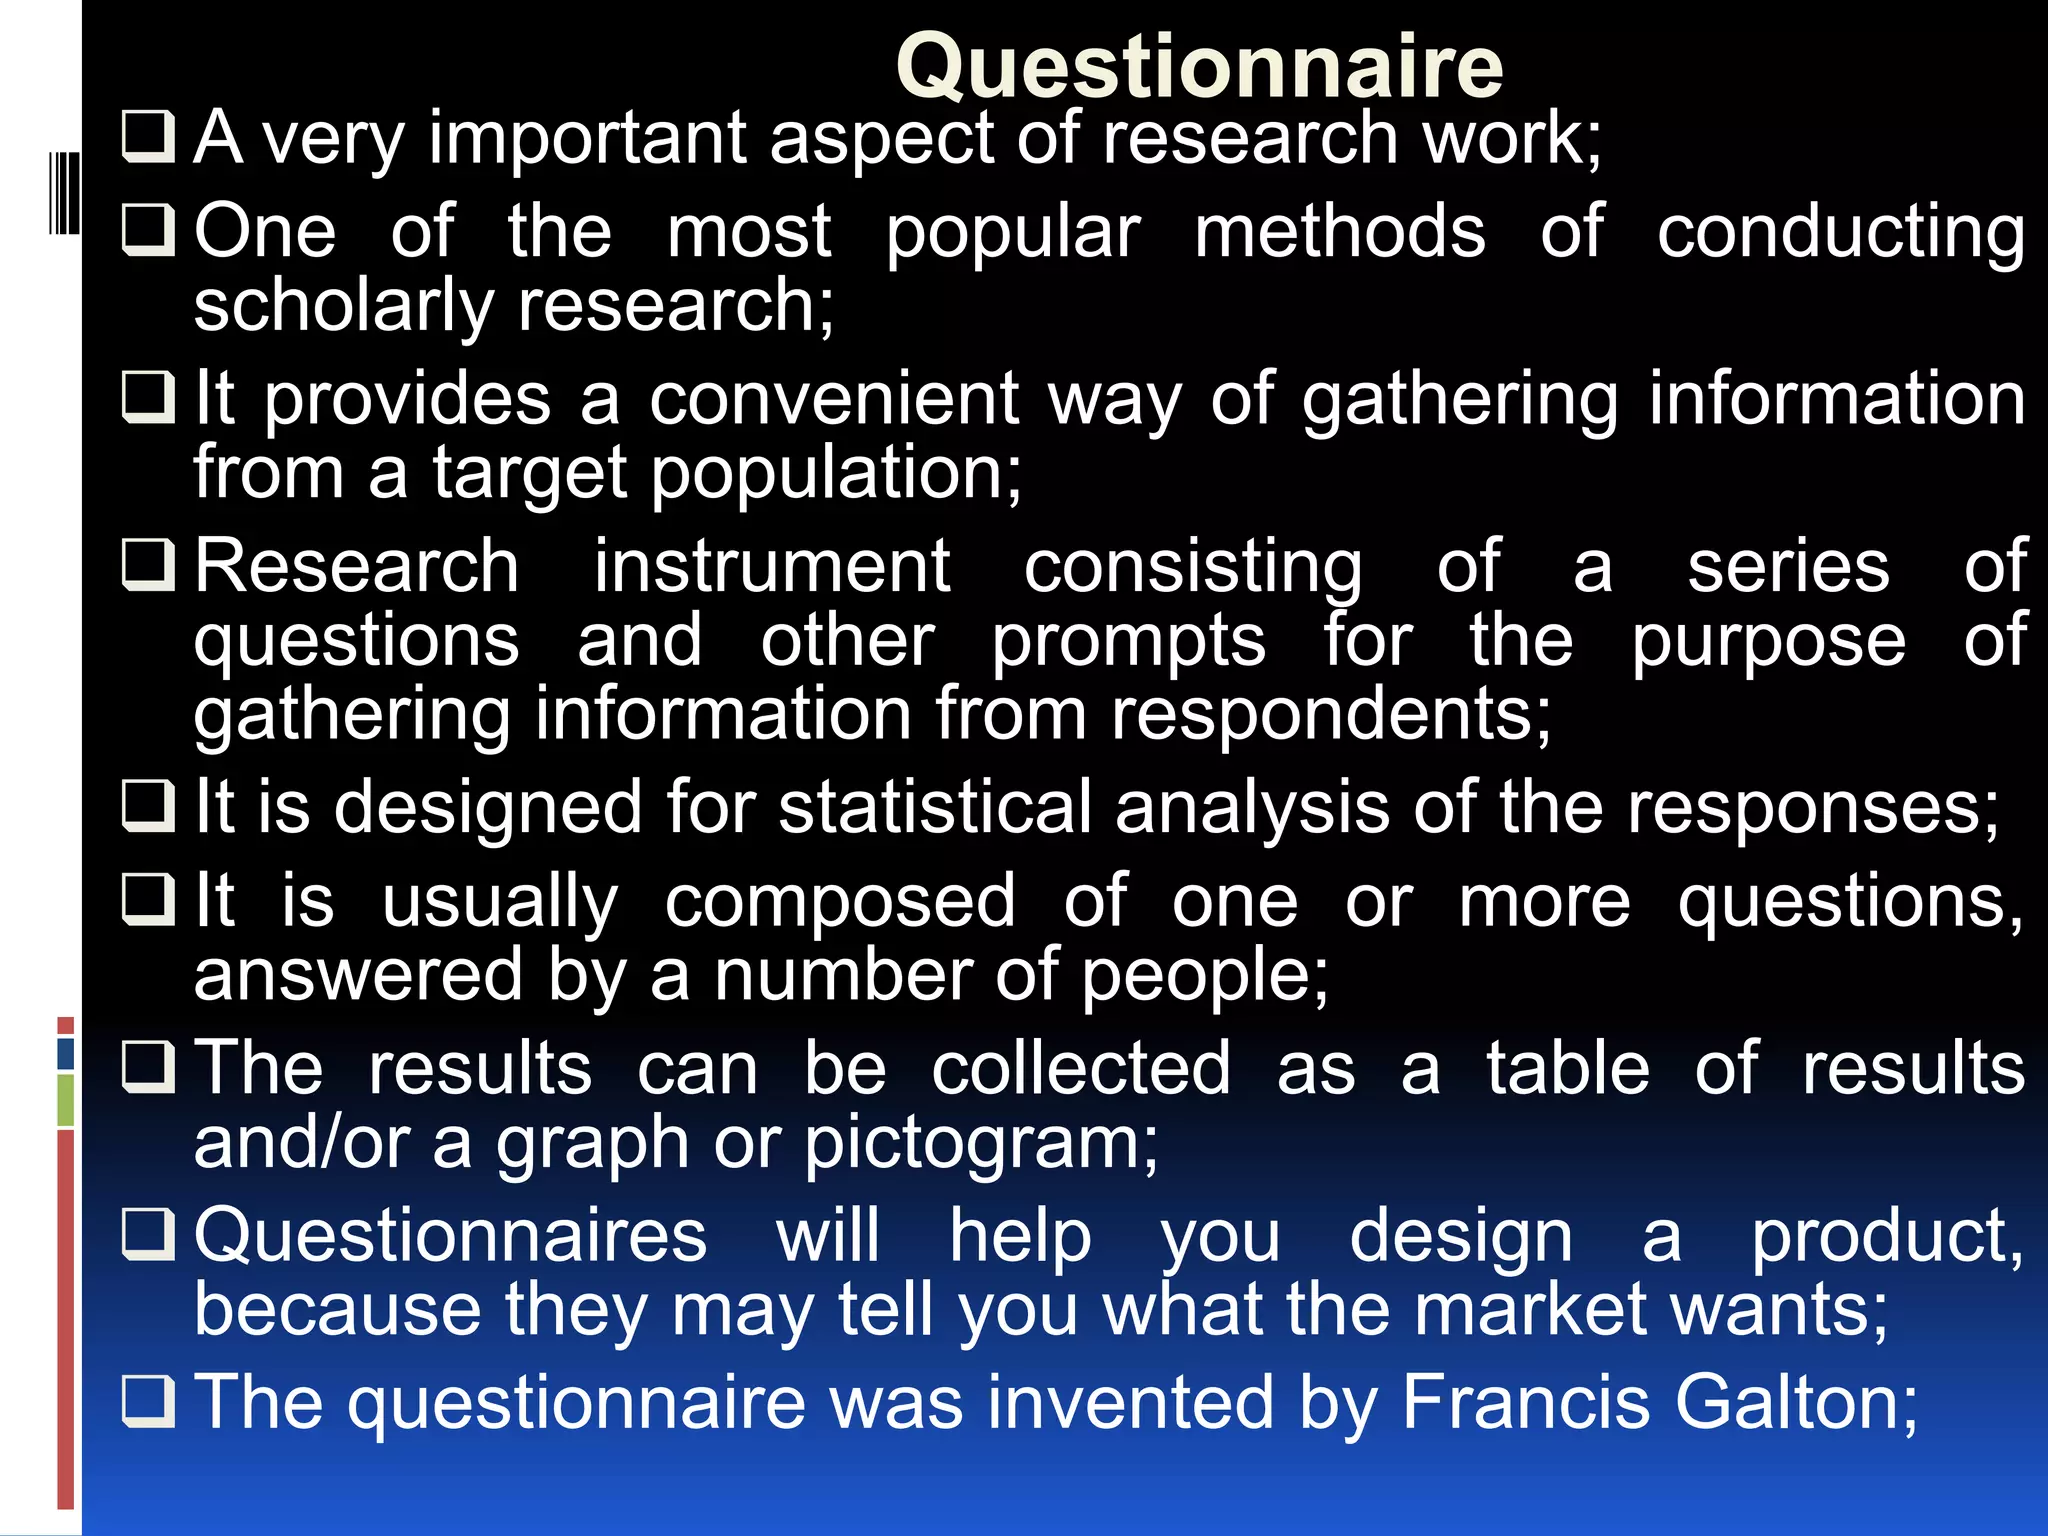
- Common data collection methods are questionnaires and surveys that collect numerical data.
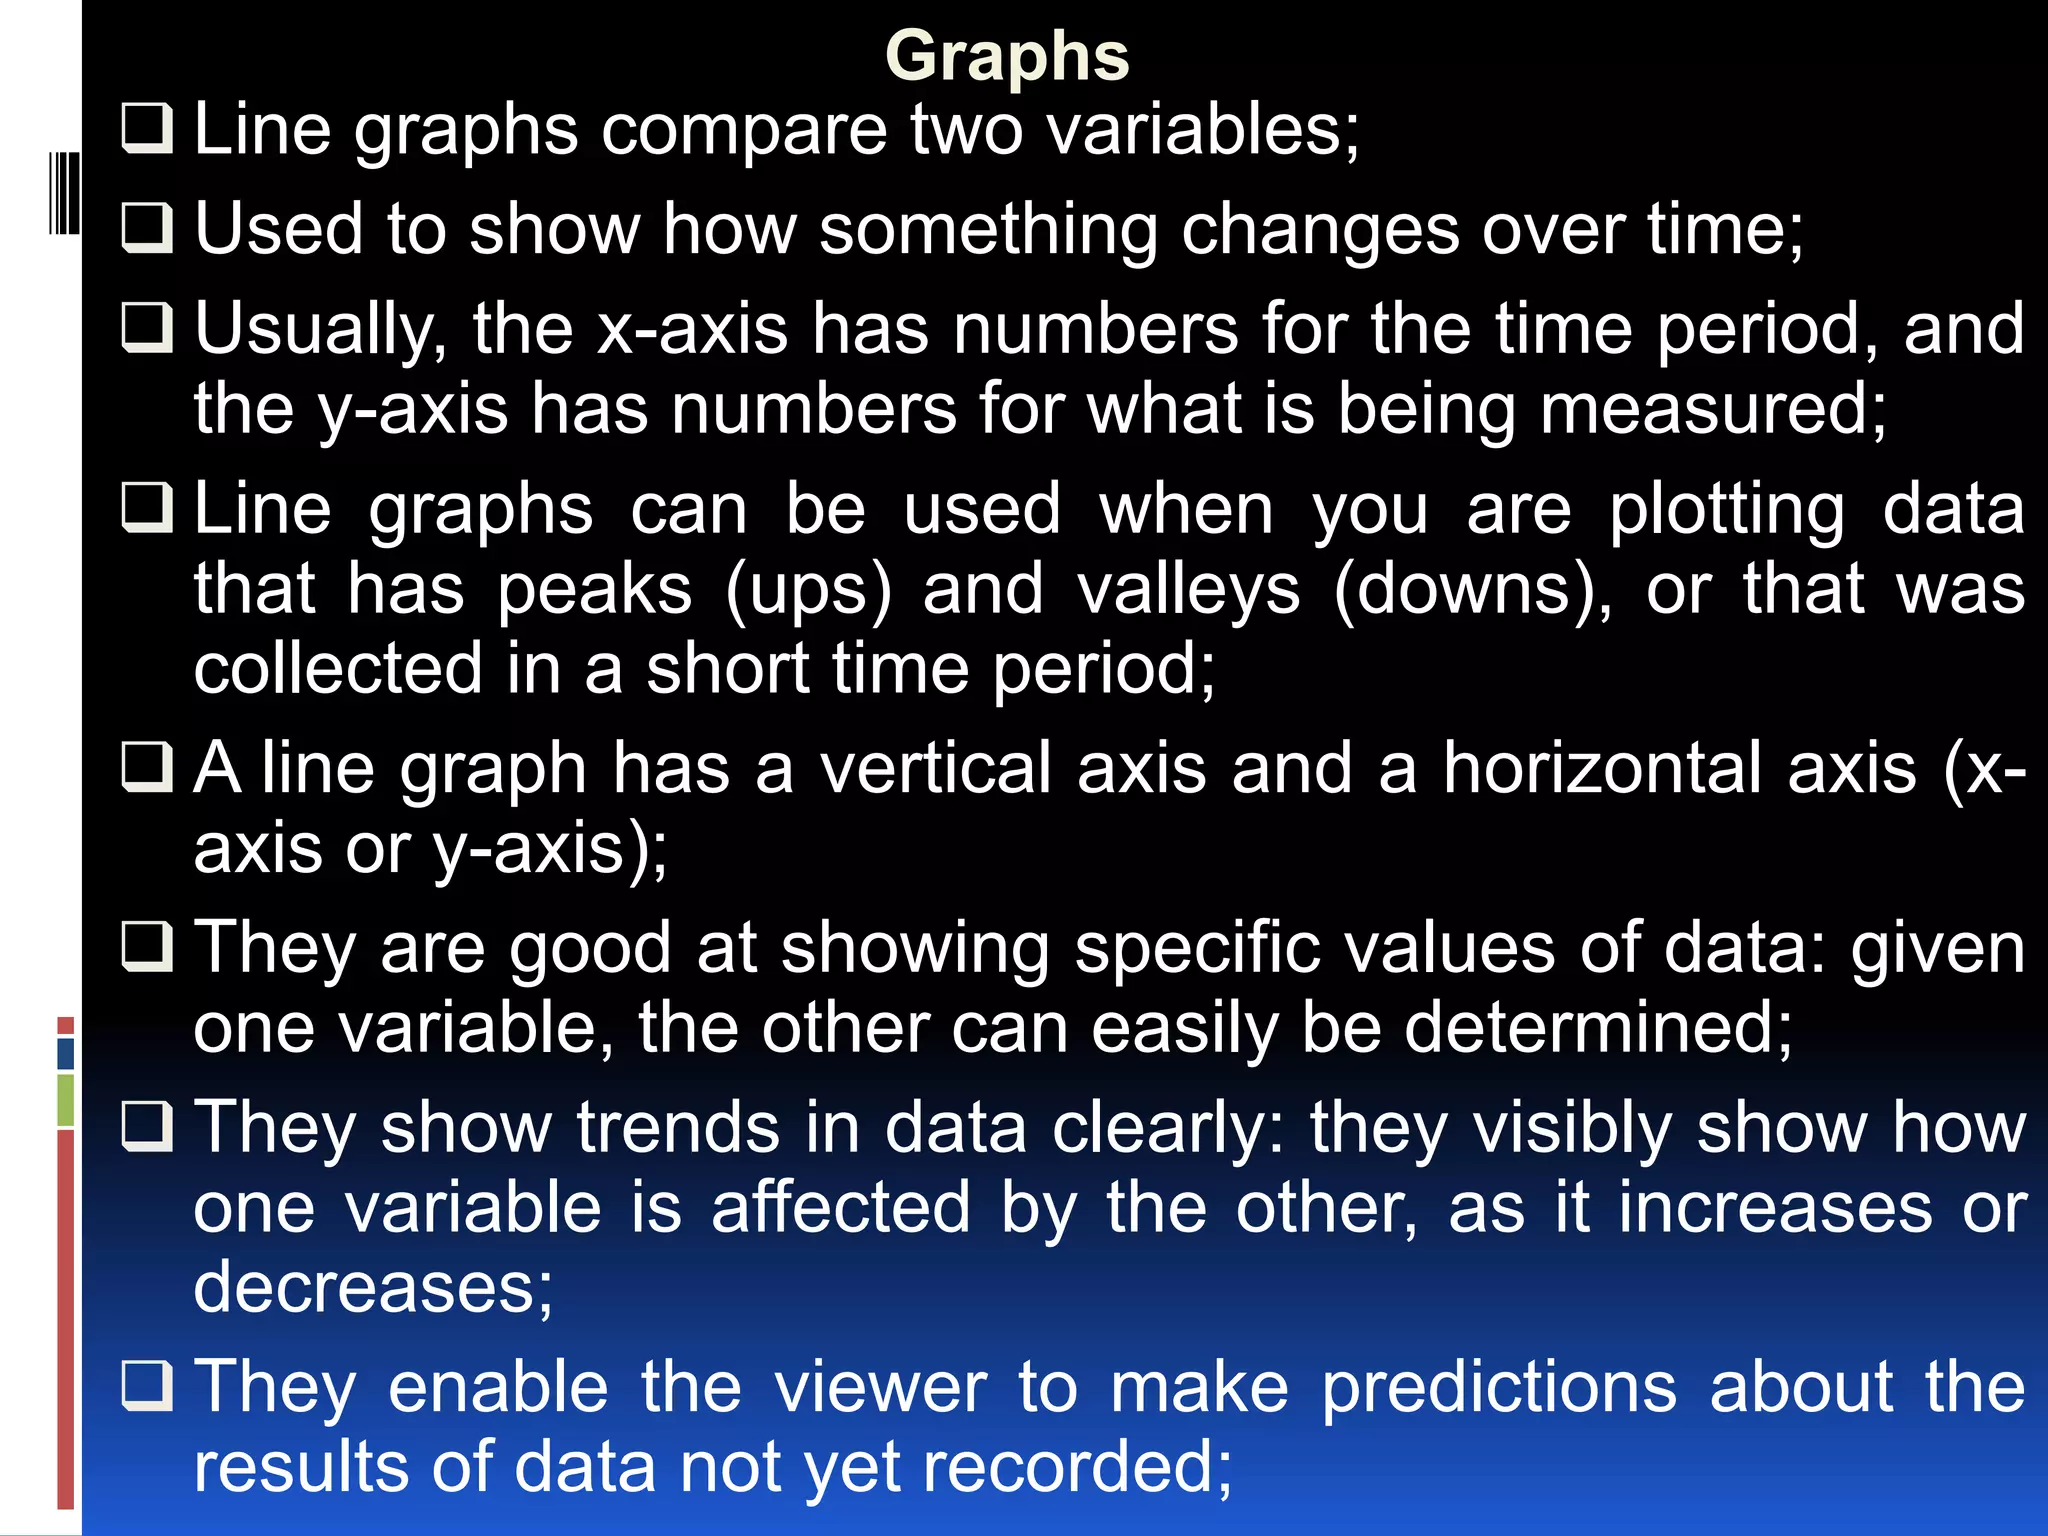
- Results should be presented using tables, graphs, charts and diagrams to visually illustrate trends in the numerical data.
- Proper presentation of quantitative results is important for clearly communicating findings to readers.