Downloaded 203 times


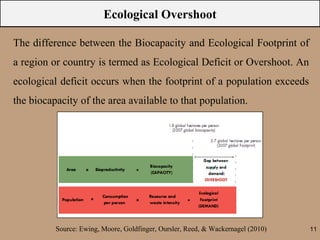
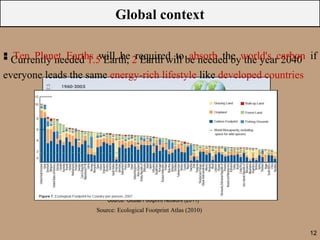


The document discusses the ecological footprint as a critical sustainability indicator, detailing its definition, components, and applications for measuring humanity's demand on natural resources versus the Earth's biocapacity. It also highlights the ecological overshoot phenomenon, where human consumption exceeds the available biocapacity, and emphasizes the importance of tracking these metrics for effective sustainability planning. Additionally, it addresses the limitations of ecological footprint accounting and its significance for urban planning in contexts like Bangladesh.


