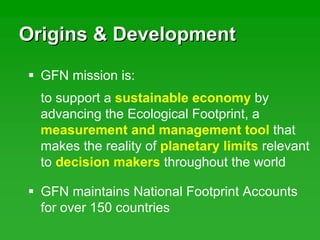
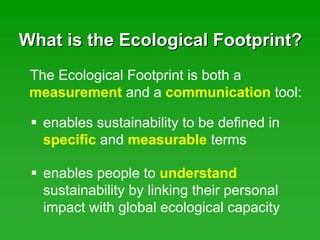
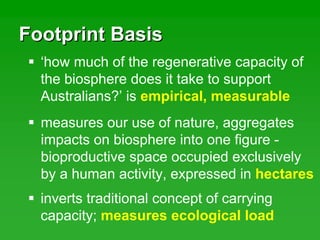
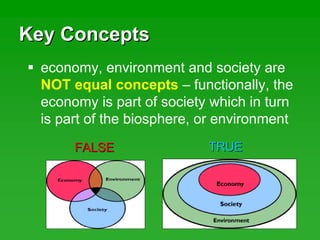
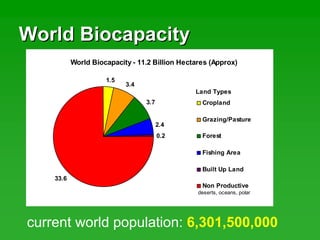
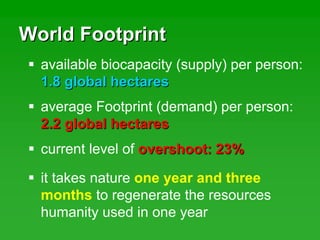
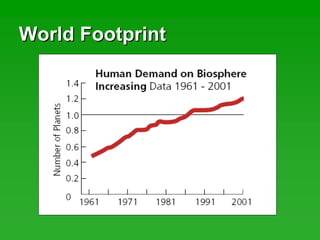
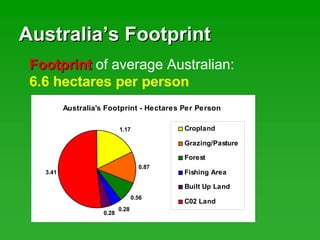
This document provides an overview of the ecological footprint, a tool created by William Rees and Mathis Wackernagel to measure human demand on the biosphere. The ecological footprint measures the amount of biologically productive land and sea area required to support human consumption and waste absorption. It indicates that humanity is currently in global ecological overshoot, using more than what the Earth can regenerate. The document discusses the methodology, components, and implications of ecological footprint accounting.
A carbon footprint is the amount of greenhouse gases—primarily carbon dioxide—released into the atmosphere by a particular human activity. A carbon footprint can be a broad meaasure or be applied to the actions of an individual, a family, an event, an organization, or even an entire nation.
Ecological Footprint assessment helps to identify what activities are having the biggest impact on nature and opens up possibilities to reduce our impact and live within the means of One Planet. It provides measurement of collective consumption of the population whether they are exceeding the Earth’s ecological limits or not. It is compared with Biocapacity which measures the amount of available bioproductive resources in ecosystem. The introduction of Ecological Footprint has been very necessary for the context of Bangladesh especially in Dhaka as the endless demand and the unplanned consumption pattern of the population here have been producing a very unsustainable situation.
This is the 7th lesson of the course - Foundation of Environmental Management taught at the Faculty of Social Sciences and Humanities, Rajarata University of Sri Lanka
this presentation is about the sustainability of the environment and techniques we can use to preserve our Environment for future generation along with statistics.
Ecological economics and biodiversity conservationSaroj Upadhyay
definition of economics, types of economic systems, environmental impacts of traditional economic systems, Environmental Kuznets Curve (EKC), Ecological economics and its capitals, Conventional unsustainable vs Environmentally sustainable economic growth, Economics of Ecosystem and Biodiversity,Ecological Economics And Biodiversity Conservation
Mind the Gap font was born out of the frustration of the love/hate relationship I have of the daily commute.
I'm not sure if it's just a London thing or if it's the same in New York City, Paris, Madrid, Seoul, Shanghai, Beijing, Mexico City, Moscow, Tokyo and Berlin.
It was created by hand cutting letter stencils and spraying them with black paint. This gives it an industrial almost military look and feel. Learn more at http://bit.ly/29pU78X
Important conceptual concerns, economic foundations of environmental valuation, scarcity, useful approaches for different environmental problems, and cautions.
John Dixon
Sustainable Development through Water Footprint AssessmentIRC
An introduction to the Water Footprint Network and how water footprint assessment contributes to sustainable development illustrated through the example of the Bangladesh textile industry. Presentation by Ruth Mathews, Executive Director, Water Footprint Network, delivered on March 4th, 2015 at the IRC Event: 'The SDGs for water and sanitation. What is new? What is different?'
Introduction to Permaculture - FELC February 8th 2014Vince Kirchner
Basic of permaculture provided to a group of Master Gardeners, and environmentally aware citizens. Key concepts were presented with a discussion around each topic. This is a precursor to a full PDC class starting in April. www.greatlakespermaculture.com
The EF compares human demand on nature with nature’s regenerative capacity.
It is a measure of the demands and the consumption of natural resources by people.
The sizes of ecological footprint vary from country to country and from person to person.
Design principles for intelligent research investmentriel-presents
A content-rich celebration of an important knowledge legacy
An opportunity to reflect, and to distil key lessons and insights:
- about important knowledge gaps that remain
- about how best to fill such knowledge gaps
A ‘message in a bottle’ for future research investment
TOO4TO Module 5 / Sustainable Resource Management: Part 1TOO4TO
This presentation is part of the Sustainable Management: Tools for Tomorrow (TOO4TO) learning materials. It covers the following topic: Sustainable Resource Management (Module 5). The material consists of 3 parts. This presentation covers Part 1.
You can find all TOO4TO Modules and their presentations here: https://too4to.eu/e-learning-course/
TOO4TO was a 35-month EU-funded Erasmus+ project, running until August 2023 in co-operation with European strategic partner institutions of the Gdańsk University of Technology (Poland), the Kaunas University of Technology (Lithuania), Turku University of Applied Sciences (Finland) and Global Impact Grid (Germany).
TOO4TO aims to increase the skills, competencies and awareness of future managers and employees with available tools and methods that can provide sustainable management and, as a result, support sustainable development in the EU and beyond.
Read more about the project here: https://too4to.eu/
This project has been funded with support from the European Commission. Its whole content reflects the views only of the author, and the Commission cannot be held responsible for any use which may be made of the information contained therein. PROJECT NUMBER 2020-1-PL01-KA203-082076
sustainable development & the water, energy food security nexus is discussed. The content throws light on sustainable development : Effects on the livelihood of common man.
Determinants of Households Willingness to Pay for Conservation of Natural Koo...AI Publications
Most natural resources or environmental goods and services are exposed to degradation, society over utilize them for only their current benefits without thinking the future life span of these resources. The study analyzed determinants of households’ willingness to pay for conservation of natural Kool water (Burie Kool Wuha, W/Gojjam, Ethiopia). The contingent valuation method and Heckman two step model was employed. The results indicates that sex of the household head, education of the household, value attached to the resource by households as source of income, value attached to the resource by households reserving for future generation and wealth of the households has a significant and positive correlation with households WTP, and family size of households, education of the household and wealth of the households has a significant and positive correlation with the households payment levels. On the other hand, initial bid value has a negative correlation with the level of payments. Therefore, by taking the importance of the resource for the society and the households WTP, the policy makers need to focus on identified factors in designing strategies for the conservation of the resource.
Willie Nelson Net Worth: A Journey Through Music, Movies, and Business Venturesgreendigital
Willie Nelson is a name that resonates within the world of music and entertainment. Known for his unique voice, and masterful guitar skills. and an extraordinary career spanning several decades. Nelson has become a legend in the country music scene. But, his influence extends far beyond the realm of music. with ventures in acting, writing, activism, and business. This comprehensive article delves into Willie Nelson net worth. exploring the various facets of his career that have contributed to his large fortune.
Follow us on: Pinterest
Introduction
Willie Nelson net worth is a testament to his enduring influence and success in many fields. Born on April 29, 1933, in Abbott, Texas. Nelson's journey from a humble beginning to becoming one of the most iconic figures in American music is nothing short of inspirational. His net worth, which estimated to be around $25 million as of 2024. reflects a career that is as diverse as it is prolific.
Early Life and Musical Beginnings
Humble Origins
Willie Hugh Nelson was born during the Great Depression. a time of significant economic hardship in the United States. Raised by his grandparents. Nelson found solace and inspiration in music from an early age. His grandmother taught him to play the guitar. setting the stage for what would become an illustrious career.
First Steps in Music
Nelson's initial foray into the music industry was fraught with challenges. He moved to Nashville, Tennessee, to pursue his dreams, but success did not come . Working as a songwriter, Nelson penned hits for other artists. which helped him gain a foothold in the competitive music scene. His songwriting skills contributed to his early earnings. laying the foundation for his net worth.
Rise to Stardom
Breakthrough Albums
The 1970s marked a turning point in Willie Nelson's career. His albums "Shotgun Willie" (1973), "Red Headed Stranger" (1975). and "Stardust" (1978) received critical acclaim and commercial success. These albums not only solidified his position in the country music genre. but also introduced his music to a broader audience. The success of these albums played a crucial role in boosting Willie Nelson net worth.
Iconic Songs
Willie Nelson net worth is also attributed to his extensive catalog of hit songs. Tracks like "Blue Eyes Crying in the Rain," "On the Road Again," and "Always on My Mind" have become timeless classics. These songs have not only earned Nelson large royalties but have also ensured his continued relevance in the music industry.
Acting and Film Career
Hollywood Ventures
In addition to his music career, Willie Nelson has also made a mark in Hollywood. His distinctive personality and on-screen presence have landed him roles in several films and television shows. Notable appearances include roles in "The Electric Horseman" (1979), "Honeysuckle Rose" (1980), and "Barbarosa" (1982). These acting gigs have added a significant amount to Willie Nelson net worth.
Television Appearances
Nelson's char
UNDERSTANDING WHAT GREEN WASHING IS!.pdfJulietMogola
Many companies today use green washing to lure the public into thinking they are conserving the environment but in real sense they are doing more harm. There have been such several cases from very big companies here in Kenya and also globally. This ranges from various sectors from manufacturing and goes to consumer products. Educating people on greenwashing will enable people to make better choices based on their analysis and not on what they see on marketing sites.
"Understanding the Carbon Cycle: Processes, Human Impacts, and Strategies for...MMariSelvam4
The carbon cycle is a critical component of Earth's environmental system, governing the movement and transformation of carbon through various reservoirs, including the atmosphere, oceans, soil, and living organisms. This complex cycle involves several key processes such as photosynthesis, respiration, decomposition, and carbon sequestration, each contributing to the regulation of carbon levels on the planet.
Human activities, particularly fossil fuel combustion and deforestation, have significantly altered the natural carbon cycle, leading to increased atmospheric carbon dioxide concentrations and driving climate change. Understanding the intricacies of the carbon cycle is essential for assessing the impacts of these changes and developing effective mitigation strategies.
By studying the carbon cycle, scientists can identify carbon sources and sinks, measure carbon fluxes, and predict future trends. This knowledge is crucial for crafting policies aimed at reducing carbon emissions, enhancing carbon storage, and promoting sustainable practices. The carbon cycle's interplay with climate systems, ecosystems, and human activities underscores its importance in maintaining a stable and healthy planet.
In-depth exploration of the carbon cycle reveals the delicate balance required to sustain life and the urgent need to address anthropogenic influences. Through research, education, and policy, we can work towards restoring equilibrium in the carbon cycle and ensuring a sustainable future for generations to come.
WRI’s brand new “Food Service Playbook for Promoting Sustainable Food Choices” gives food service operators the very latest strategies for creating dining environments that empower consumers to choose sustainable, plant-rich dishes. This research builds off our first guide for food service, now with industry experience and insights from nearly 350 academic trials.
Characterization and the Kinetics of drying at the drying oven and with micro...Open Access Research Paper
The objective of this work is to contribute to valorization de Nephelium lappaceum by the characterization of kinetics of drying of seeds of Nephelium lappaceum. The seeds were dehydrated until a constant mass respectively in a drying oven and a microwawe oven. The temperatures and the powers of drying are respectively: 50, 60 and 70°C and 140, 280 and 420 W. The results show that the curves of drying of seeds of Nephelium lappaceum do not present a phase of constant kinetics. The coefficients of diffusion vary between 2.09.10-8 to 2.98. 10-8m-2/s in the interval of 50°C at 70°C and between 4.83×10-07 at 9.04×10-07 m-8/s for the powers going of 140 W with 420 W the relation between Arrhenius and a value of energy of activation of 16.49 kJ. mol-1 expressed the effect of the temperature on effective diffusivity.
2. Origins & DevelopmentOrigins & Development
Mathis Wackernagel now heads Global
Footprint Network, established 2004 in
Oakland, California
created and developed by Professor
William Rees and Dr Mathis Wackernagel,
University of British Colombia, in early 1990s
www.footprintnetwork.org
3. Origins & DevelopmentOrigins & Development
to support a sustainable economy by
advancing the Ecological Footprint, a
measurement and management tool that
makes the reality of planetary limits relevant
to decision makers throughout the world
GFN mission is:
GFN maintains National Footprint Accounts
for over 150 countries
4. What is the Ecological Footprint?What is the Ecological Footprint?
The Ecological Footprint is both a
measurement and a communication tool:
enables sustainability to be defined in
specific and measurable terms
enables people to understand
sustainability by linking their personal
impact with global ecological capacity
5. What is the Ecological Footprint?What is the Ecological Footprint?
Measures how much biologically
productive land & water area
humanity uses to produce the
resources it consumes and
absorb waste it generates, using
prevailing technology and
resource management, wherever
on earth those bioproductive
areas are located
6. What is the Ecological Footprint?What is the Ecological Footprint?
Footprint of a nation or of humanity (I) =
Impact = Population x Affluence x Technology
number of people consuming (P) x
average amount of goods and services
an average person consumes (A) x
resource intensity of these goods and
services (T)
7. WhatWhat ‘‘FootprintFootprint’’ MeansMeans
Footprint is NOTNOT a general term for
‘environmental impact’...
eg. tonnes of carbon emitted is NOTNOT the
‘carbon footprint’...
...surface area of planet needed to
sequester C02 emissions and maintain a
stable climate IS the carbon footprint
8. Footprint BasisFootprint Basis
based on science (ecological
& thermodynamic principles) -
is not an arbitrary index
based on an empirical, not a speculative,
research question – ‘how many people
can Australia support?’ is a speculative
question (depends on how they want to
live, how much they consume)
9. Footprint BasisFootprint Basis
‘how much of the regenerative capacity of
the biosphere does it take to support
Australians?’ is empirical, measurable
measures our use of nature, aggregates
impacts on biosphere into one figure -
bioproductive space occupied exclusively
by a human activity, expressed in hectares
inverts traditional concept of carrying
capacity; measures ecological load
10. Key ConceptsKey Concepts
economy, environment and society are
NOT equal concepts – functionally, the
economy is part of society which in turn
is part of the biosphere, or environment
TRUETRUEFALSEFALSE
11. Key Concepts: OvershootKey Concepts: Overshoot
when humanity's demand on nature
exceeds the biosphere's supply, or
regenerative capacity, this global
ecological deficit is called overshoot
the regenerative capacity of biosphere
is non-negotiable limiting factor for
sustaining life; resource use concern
previously depletion of finite non-
renewable resources (flows, not stocks)
12. Key Concepts: OvershootKey Concepts: Overshoot
overshoot erodes earth’s natural capital
stock; humanity liquidating ‘assets’
instead of living off of the ‘interest’
sustainability has a specific meaning -
avoiding ecological overshoot
avoiding overshoot is only a minimum
condition for sustainability; but
sustainability is impossible withoutsustainability is impossible without
avoiding overshootavoiding overshoot
13. Key Concepts: OvershootKey Concepts: Overshoot
‘‘Sustainability is like buying a chair...Sustainability is like buying a chair...
There's no question whether the chairThere's no question whether the chair
should be strong enough to sit on or not.should be strong enough to sit on or not.
That's theThat's the nonnon--negotiable condition.negotiable condition. TheThe
questions are: do you want a red one, aquestions are: do you want a red one, a
green one, a wooden one, a metal one?green one, a wooden one, a metal one?
...but not whether the chair is...but not whether the chair is
strong enough.strong enough.’’
Mathis Wackernagel, Footprint co-creator
14. Key Concepts: OvershootKey Concepts: Overshoot
invisibility - consumer culture promotes
abundance, people do not generally
encounter ecological limits;
psychologically as well as spatially
divorced from dependence on nature
economic ‘blind spot’ - ecological limits
invisible through monetary lens; prices
signal availability of a resource in market,
not its availability in the biosphere
15. Key Concepts: OvershootKey Concepts: Overshoot
‘elasticity’ -
ecological limits
can be easily
transgressed; but
overshoot eats up
nature’s reserves,
weakening its
ability to
regenerate
16. Key Concepts: OvershootKey Concepts: Overshoot
nature’s biological limits are not ‘rigid’ -
natural capital can be harvested faster
than it regenerates
nature reacts with inertia - gives the
illusion that limits can be transgressed
without apparent consequences
...how can we know whether...how can we know whether
we are in overshoot?we are in overshoot?
17. Key Concepts: OvershootKey Concepts: Overshoot
...by measuring demanddemand (ecological
footprint) and comparing it to supplysupply
(earth’s biological capacity)
individuals or businesses that do not
track activities and keep accurate records
run risk of bankruptcy - yet this is
precisely the approach we take with the
only planet within our reach capable of
supporting life
18. Footprint MethodologyFootprint Methodology
the majority of the resources people
consume and the wastes they generate
can be tracked
most resource and waste flows can be
converted into biologically productive
area required to maintain these flows
19. Footprint MethodologyFootprint Methodology
by scaling each area in proportion to its
bioproductivity, different types of areas
can be converted into the common unit
of global hectares (hectares with world
average bioproductivity)
when both are expressed in global
hectares, human demanddemand (Ecological
Footprint) can be directly compared to
nature’s supplysupply (biocapacity) to
determine whether we are in overshoot
20. Structure: ComponentsStructure: Components
crop land - arable land used for growing
food, animal feed, fibre, oil and rubber
Comprised of six land-use types for human
activities, which all compete for biologically
productive space:
pasture land - grazing animals
for meat, hides, wool, and milk
forest land - harvesting timber
for wood fibre and fuelwood
21. Structure: ComponentsStructure: Components
fishing grounds – marine and inland fish
harvest (continental shelves most
bioproductive areas of ocean)
built up land - infrastructure for housing,
transportation, and industrial production
CO2 land – land required to sequester the
carbon dioxide generated from burning
fossil fuels (theoretical)
22. Structure: DataStructure: Data
each country’s National Footprint
Account spreadsheet has over 2,000
data points
track domestic production, imports,
exports and apparent consumption of
over 600 resource categories such as
crop products, fibres, livestock, wild and
farmed fish, timber, and fuelwood, and
one major waste product – carbon dioxide
23. Structure: DataStructure: Data
data from reputable sources including
FAO (United Nations Food & Agriculture
Organisation) & IPCC (Intergovernmental
Panel on Climate Change)
data in biophysical units (eg. tonnes)
not monetary units; when data is only
available in monetary units, estimates of
actual physical quantities traded are
made from monetary value
24. Structure: DataStructure: Data
comprehensive ecological
accounting system that
calculates Ecological Footprint
and biocapacity of world and
150 nations from 1961-2006
accounts updated annually based on
most recent complete data sets = time
lag of about three years
25. Structure: Equivalence FactorsStructure: Equivalence Factors
figures corrected for bioproductivity
allow more meaningful comparisons
countries have access to different land
types of varying quality; direct
comparison of actual land area
exaggerates Footprints of countries
compelled to use lower quality land
26. Structure: Equivalence FactorsStructure: Equivalence Factors
adjust productivity of a particular
category of land (eg. arable, pasture)
land in relation to world ‘average’ land
globally ie. arable land is scaled up
compared to ‘average’ space, as it is
more biologically productive
same for all countries; calculated for
each year to reflect changes in
bioproductivity (land use change,
declining/improving quality of land)
27. Structure: Equivalence FactorsStructure: Equivalence Factors
World Average LandWorld Average Land 1.001.00
Primary CroplandPrimary Cropland 2.212.21
Marginal CroplandMarginal Cropland 1.791.79
ForestForest 1.341.34
PasturePasture 0.490.49
MarineMarine 0.360.36
Inland WaterInland Water 0.360.36
Built Land *Built Land * 2.212.21
* assumes built on land displaced arable land, same
equivalence factor as primary cropland
28. Structure: Yield FactorsStructure: Yield Factors
adjust the productivity of a country’s
land (eg. arable) compared to world
average productivity of (eg. arable) land
reflect how much more or less
productive a country’s land is compared to
same category of land across rest of world
differ between countries; calculated
each year, reflect changes in
bioproductivity (quality, change of land use)
30. Structure: Conversion FactorsStructure: Conversion Factors
conversion factors are used to account
for the efficiency of conversion of raw
materials (eg. milk) to manufactured
products (eg. cheese)
adjusted conversion factors refine true
conversion efficiencies to account for
secondary animal products, such as
hides and wool
31. Methodology: ApproachMethodology: Approach
counting each area only once, even if
the area provides two or more ecological
services simultaneously (double
counting would exaggerate the Footprint)
Footprint uses conservative approach
which underestimates human impactunderestimates human impact
and overestimates available biologicaloverestimates available biological
capacitycapacity by:
32. Methodology: ApproachMethodology: Approach
leaving out some human activities for
which there is insufficient data
choosing the more conservative
estimates when in doubt
accounting for agricultural practices as if
current industrial yields would not cause
any significant long-term damage to
soil productivity
33. Methodology: ApproachMethodology: Approach
– processes that irreversibly damage the
biosphere (eg. species extinction, aquifer
destruction, deforestation, desertification)
excluding activities which systematically
erode nature’s capacity to regenerate:
– use of materials for which the biosphere has
no significant assimilation capacity eg.
plutonium, polychlorinated biphenyls (PCBs)
34. BiodiversityBiodiversity
efforts to increase biocapacity
(monocropping, use of pesticides)
may increase pressure on biodiversity
need to factor in bioproductive space
for other species typically excluded
from areas occupied for human uses
Brundtland report figure of 12%;
conservation biologists estimate
necessary figure between 25-75%
35. Competition for BiocapacityCompetition for Biocapacity
aggregated indicator highlights
connections of ecological functions,
documents human pressures on nature
as Footprint exceeds biocapacity, human
uses of nature become competitive with
each other; biocapacity used by one
economy unavailable to another
36. Competition for BiocapacityCompetition for Biocapacity
alleviating pressure may simply
shift the load elsewhere; one
impact may even exacerbate
another - ‘bedcover effect’
UK’s arable land 5.7 million hectares;
UK needs 25.9 million hectares to run its
vehicles on biodiesel = 4.5 times its
arable area
www.monbiot.com/archives/2004/11/23/
feeding-cars-not-people
37. World BiocapacityWorld Biocapacity
the biosphere has 11.2 billion hectares
of biologically productive area, roughly
one quarter of the planet’s surface
this bioproductive area consists of:
2.4 billion hectares of water (ocean
shelves and inland water), and
8.8 billion hectares of land
38. World BiocapacityWorld Biocapacity
World Biocapacity - 11.2 Billion Hectares (Approx)
1.5
3.4
3.7
2.4
0.2
33.6
Cropland
Grazing/Pasture
Forest
Fishing Area
Built Up Land
Non Productive
deserts, oceans, polar
Land Types
current world population: 6,301,500,000
39. World FootprintWorld Footprint
available biocapacity (supply) per person:
1.8 global hectares1.8 global hectares
average Footprint (demand) per person:
2.2 global hectares2.2 global hectares
current level of overshoot:overshoot: 23%23%
it takes nature one year and three
months to regenerate the resources
humanity used in one year
42. AustraliaAustralia’’s Footprints Footprint
FootprintFootprint of average Australian:
6.6 hectares per person
Australia's Footprint - Hectares Per Person
1.17
0.87
0.56
0.28
3.41
0.28
Cropland
Grazing/Pasture
Forest
Fishing Area
Built Up Land
C02 Land
43. AustraliaAustralia’’s Footprints Footprint
national biocapacity per Australian:
12.4 hectares per person12.4 hectares per person
ecological reserve of 5.9 gha per person...
...this remainder is ‘occupied’ by
countries running ecological deficitsecological deficits
more useful to compare Footprint to
global (absolute) rather than national
(relative) biocapacity
44. Future ScenariosFuture Scenarios
population of only 9 billion by 2050, if
everyone starts with two child families
today (optimistic UN estimate)
halving of resource consumption in
OECD countries
adequate standard of living for all (eg.
3.3 hectare Footprint, an ‘average’
Mexican, Ukranian today; ‘average’
Australian Footprint is 6.6 hectares)
45. Future ScenariosFuture Scenarios
Biologically productive space needed to
support 9 billion people living on a 3.3
hectare Footprint: 29.7 billion hectares29.7 billion hectares
Biologically productive space on the
planet: 11.2 billion hectares11.2 billion hectares
Number of planets needed to sustain 9
billion people living on a 3.3 hectare
Footprint: 2.65 planets
46. HumanityHumanity’’s Challenges Challenge
Defining challenge of our age
(encompasses addressing climate change,
extreme poverty) not whether more than
six billion people can be sustained on
western industrial model of development...
...it is how to sustain the projected
global population at an
adequate standard of living for all within
the regenerative biocapacity of one planet
47. Future ScenariosFuture Scenarios
Overshoot can be eliminated on demanddemand
side by reducing humanity's footprint:reducing humanity's footprint:
lowering world population
reducing per capita consumption
implementing more resource efficient
technologies for providing goods and
services
48. Future ScenariosFuture Scenarios
Overshoot can be eliminated on supplysupply side
by increasing global biocapacity:increasing global biocapacity:
expanding global bioproductive area
improving resource management
strengthening ecosystems health
49. CriticismsCriticisms
treats nature as collection of resources
for use by humans
doesn’t capture all sustainability aspects
is too simple – overaggregates data
is too complex – methodology unclear
Need to maintain balance of robust,
scientifically credible Footprint, and its
accessibility as a communication tool
50. Research Agenda: GreenhouseResearch Agenda: Greenhouse
inclusion of C02 from non-fuel
combustion sources (fugitive emissions
from flaring of oil and gas, cement
production, tropical forest fires, biofuel
combustion)
inclusion of greenhouse gases other
than C02 (eg. methane)
51. Research Agenda: NuclearResearch Agenda: Nuclear
removal of nuclear, currently accounted
for as parity with fossil fuels (one MWh of
nuclear electricity = carbon Footprint of
one MWh average fossil-fuel electricity)
value of nuclear land Footprint does not
reflect salient scientific/political concerns
associated with nuclear (radioactive
waste, accidents, weapons), which are
generally unrelated to occupation of
biological capacity
52. Research Agenda: WaterResearch Agenda: Water
water not itself a material produced by
the biosphere but cycles through the
biosphere; use or withdrawal reflected
indirectly by showing changing levels of
biocapacity, generally dependent on
availability of water
biocapacity compromised by water use
could be measured and this loss of
biocapacity allocated to the water user
53. Research Agenda: PollutantsResearch Agenda: Pollutants
demand on ecosystems from releases of
persistent pollutants is reflected indirectly
via decrease in biocapacity where capacity
of ecosystems is compromised
biocapacity loss could be allocated to the
activity releasing them
54. Research Agenda: Built LandResearch Agenda: Built Land
accounts assume built-up land for
infrastructure replaced cropland;
proposal to calculate built land based
on more accurate data about what land
type the built infrastructure replaced
...OR removal of built land as a category
altogether; count out urban area as not
‘productive’, in same way as deserts,
polar caps etc are excluded
55. Application: GlobalApplication: Global
trade relations - identify resource
dependence on overstressed regions;
understanding effect of trade on
footprint distribution
international negotiations - framework
for setting negotiation priorities and
assessing international resource flows
security - emerging risks associated
with resource scarcity
57. Tracking Carbon FlowsTracking Carbon Flows
UK a net importer of carbon intensive
products and services from abroad; has
exported part of its carbon responsibilityexported part of its carbon responsibility
UK consumers use products and services
with a carbon footprint of 176.4 MtC
(millions of tonnes of carbon per annum)
= 11.7 MtC greater than emissions of
all UK production
www.carbontrust.co.uk
58. Application: NationalApplication: National
correlate economic activities and
investment with environmental risk
policy formulation and evaluation – best
allocation of resources, compound
effects, identify opportunities
systematically account for ecological
assets and measure progress towards
sustainability in tangible ways
60. Complement to GDPComplement to GDP
make Footprint as prominent a metric
as the Gross Domestic Product (GDP)
in 10 key nations by 2015
GFN’s ‘Ten In Ten Campaign’
institutionalising Footprint at national level
requires acceptance of both methodology
and data by statistical offices of national
governments
61. Communication: GlobalCommunication: Global
World Overshoot Day
...on 9 October 2006,
humanity had already
consumed total amount
of resources nature
produced that year
World Overshoot Day in:
1995 - 21 November
1987 - 19 December
63. Communication IssuesCommunication Issues
Footprint easy to interpret =
double edged sword; can
quickly dismiss if it doesn’t fit
with other deeply held beliefs
people living in a culture
where ‘more’ and ‘faster’ =
better, hear ‘reduce’ as
meaning ‘less’ and ‘smaller’
= worse
64. Communication IssuesCommunication Issues
separate data from analysis - sell the
concern instead of telling people what
they should do
fear and guilt are paralysing; expressing
concern invites people’s creativity
65. Footprint & South AustraliaFootprint & South Australia
Footprint accounts for SA developed by
State government in association with
University of SA in 2005, released in 2006
GFN partner organisations include
Sustainability and Climate Change
Division of Dept Premier and Cabinet, and
Office of Zero Waste SA
www.sustainableliving.sa.gov.au
66. Footprint & South AustraliaFootprint & South Australia
Average South Australian’s Footprint =
7 global hectares (gha) per person, slightly
less than the Australian average of 7.7 gha/cap
67. Footprint & South AustraliaFootprint & South Australia
State Strategic Plan target of 30% reduction
in SA’s Footprint by 2050
South Australians use 3.9 times what is
available per person on the planet
www.stateplan.sa.gov.au/plan_targets_obj3.php
68. Scales, Not Crystal BallScales, Not Crystal Ball
role of policy to determine how to
ensure quality of life for all within the
means of nature
Footprint cannot tell us what to
do, is an indicator of how
much we ‘weigh’ on the planet
at a certain point in time; can
use to test scenarios