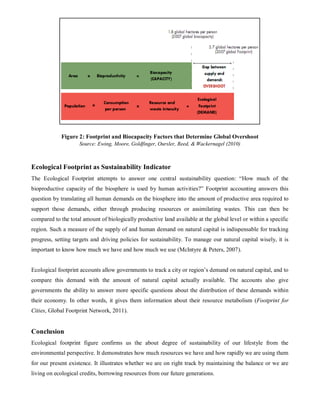
National Research Conference – 2012
                                   Organized by: Bangladesh Peace and Development Mission
                               In Association With: National Academy for Educational Management

                      Ecological Footprint as a Sustainability Indicator
                                   Shahadat Hossain Shakil*, Dr. Ishrat Islam**

                                                        Abstract
Ecological Footprint assessment helps to identify what activities are having the biggest impact on nature and
opens up possibilities to reduce our impact and live within the means of One Planet. It provides
measurement of collective consumption of the population whether they are exceeding the Earth’s ecological
limits or not. It is compared with Biocapacity which measures the amount of available bioproductive
resources in ecosystem. The introduction of Ecological Footprint has been very necessary for the context of
Bangladesh especially in Dhaka as the endless demand and the unplanned consumption pattern of the
population here have been producing a very unsustainable situation.

Keywords: Ecological Footprint, Biocapacity, Environmental Sustainability

Introduction
The 21 st century is going to introducing us to a more complicated scenario than ever to access the ecosystem
service. The current trend of consumption, urbanization, industrialization is sending us closer to food
shortage, biodiversity loss, depleted fisheries, soil erosion and freshwater stress. The effect of these will be
reflected by the global supply-demand crisis of essential resources. To manage both ecological reserve and
demand in a better way, immediate strategies should be put forth and one of the major indicators for making
these strategies is Ecological Footprint (Ewing, Moore, Goldfinger, Oursler, Reed, & Wackernagel, 2010).

The Ecological Footprint is a well-respected, internationally applied indicator of sustainability. It was
developed in 1990 by Mathis Wackernagel and William Rees as a means of making our ecological
constraints clear and our sustainability strategies more effective and livable. Ecological footprint is one of
the approaches working as a successful sustainability indicator. It is an evolving topic and modification of
this tool is still going on.

*Research Assistant, Department of Urban and Regional Planning, Bangladesh University of Engineering
and Technology, Dhaka-1000.
E- mail: shshakil.buet@gmail.com, Cell: 01717189153

**Associate Professor, Department of Urban and Regional Planning, Bangladesh University of Engineering
and Technology, Dhaka-1000. E- mail: ishratislam@urp.buet.ac.bd


The emergence of Ecological Footprint has taken place to measure humanity’s demand on nature. It
measures how much land and water area a human population requires to produce the resource it consumes
and to absorb its carbon dioxide emissions, using prevailing technology. To provide the resources we use
and absorb our waste, humanity uses the equivalent of 1.5 planets today. This means the Earth now needs
one year and six months to regenerate what we use in a year. Moderate UN scenarios suggest that if current
population and consumption trends continue, by the 2030s, we will need the equivalent of two Earths to
support us and of course, we only have one (Footprint Basics–Overview,Global Footprint Network, 2011).

Concepts and Definition
Footprint accounts are divided into two parts: ecological supply (Bioproductive Area or Biocapacity) and
human demand on nature (Ecological Footprint).

Ecological Footprint – Demand
It is a measure of how much biologically productive land and water an individual, population or activity
requires to produce all the resources it consumes and to absorb the carbon dioxide emissions it generates
using prevailing technology and resource management practices (Glossary,Global Footprint Network,
2011). Components of Ecological Footprint Account have been illustrated in Figure 1.


                             Figure 1: Components of Ecological Footprint
                                           Source: WWF (2010)
Formula of Ecological Footprint derived from National Footprint Account Methodology 2010 (Ewing, Reed,
Galli, Kitzes, & Wackernagel, 2010):
                                          EF = (P/YN). YF. EQF
Where,                     P = Amount of Product Harvested or Waste Emitted
                    YN = National Average Yield for P or its Carbon Uptake Capacity
                              YF = Yield Factor, EQF = Equivalency Factor
Footprint is expressed in global hectares. Global hectares are estimated with the help of two factors: the
yield factors (that compare national average yield per hectare to world average yield in the same land
category) and the equivalence factors (which capture the relative productivity among the various land and
sea area types).
Biocapacity – Supply
Biocapacity is the capacity of ecosystems to produce biological materials useful for people, and to absorb
waste they generate (including carbon dioxide from fossil fuel burning), using current management schemes
and extraction technologies (Glossary, Global Footprint Network, 2011).

Biocapacity is usually expressed in units of global hectares. The biocapacity of an area is calculated by
adjusting the area for its productivity. This is achieved by multiplying the actual physical area by the area
specific yield factor and the appropriate equivalence factor.

According to National Footprint Account Methodology 2010 (Ewing, Reed, Galli, Kitzes, & Wackernagel,
2010), a country’s biocapacity BC for any land use type is calculated as follows:

                                               BC = A. YF. EQF

Where,

                                A= Area Available for a Given Land Use Type

  YF and EQF = Yield Factor and Equivalence Factor, respectively, for the Country, Year, and Land Use
                                               Type in Question

Ecological Deficit or Overshoot
The difference between the Biocapacity and Ecological Footprint of a region or country is termed as
Ecological Deficit or Overshoot. An ecological deficit occurs when the footprint of a population exceeds the
biocapacity of the area available to that population. Conversely, an ecological reserve exists when the
biocapacity of a region exceeds its population's footprint. If there is a regional or national ecological deficit,
it means that the region is importing biocapacity through trade or liquidating regional ecological assets. In
contrast, the global ecological deficit cannot be compensated through trade, and is therefore equal to
overshoot (Glossary, Global Footprint Network, 2011). Notion of Ecological Overshoot has been
exemplified in Figure 2.
Figure 2: Footprint and Biocapacity Factors that Determine Global Overshoot
                    Source: Ewing, Moore, Goldfinger, Oursler, Reed, & Wackernagel (2010)


Ecological Footprint as Sustainability Indicator
The Ecological Footprint attempts to answer one central sustainability question: “How much of the
bioproductive capacity of the biosphere is used by human activities?” Footprint accounting answers this
question by translating all human demands on the biosphere into the amount of productive area required to
support those demands, either through producing resources or assimilating wastes. This can then be
compared to the total amount of biologically productive land available at the global level or within a specific
region. Such a measure of the supply of and human demand on natural capital is indispensable for tracking
progress, setting targets and driving policies for sustainability. To manage our natural capital wisely, it is
important to know how much we have and how much we use (McIntyre & Peters, 2007).


Ecological footprint accounts allow governments to track a city or region’s demand on natural capital, and to
compare this demand with the amount of natural capital actually available. The accounts also give
governments the ability to answer more specific questions about the distribution of these demands within
their economy. In other words, it gives them information about their resource metabolism (Footprint for
Cities, Global Footprint Network, 2011).


Conclusion
Ecological footprint figure confirms us the about degree of sustainability of our lifestyle from the
environmental perspective. It demonstrates how much resources we have and how rapidly we are using them
for our present existence. It illustrates whether we are on right track by maintaining the balance or we are
living on ecological credits, borrowing resources from our future generations.
References
Ewing, B., Moore, D., Goldfinger, S., Oursler, A., Reed, A., & Wackernagel, M. (2010). Ecological
       Footprint Atlas 2010. Oakland: Global Footprint Network.
Ewing, B., Reed, A., Galli, A., Kitzes, J., & Wackernagel, M. (2010). Calculation Methodology for the
       National Footprint Accoounts, 2010 Edition. Oakland: Global Footprint Network.
Global Footprint Network. (2011). Foorprint Basics-Overview. Retrieved May 10, 2011, from Global
       Footprint Network : Advancing the Science of Sustainability:
       http://www.footprintnetwork.org/en/index.php/GFN/page/footprint_basics_overview/
Global Footprint Network. (2011). Footprint For Cities . Retrieved May 10, 2011, from Global Footprint
       Network : Advancing the Science of Sustainability :
       http://www.footprintnetwork.org/en/index.php/GFN/page/footprint_for_cities/
Global Footprint Network. (2011). Glossary. Retrieved May 10, 2011, from Global Footprint Network :
       Advancing the Science of Sustainability: http://www.footprintnetwork.org/en/index.php/GFN/

McIntyre, S. A., & Peters, H. M. (2007, June 26). The Ecological Footprint of Utah. Retrieved April 4,
       2011, from Utah Vital Sign: http://www.utahpop.org/vitalsigns/research/report_2007.htm
WWF. (2010). Living Planet Report 2010. Switzerland: World Wide Fund For Nature International.
Xu, S., & Martin, I. S. (2010). Ecological Footprint for The Twin Cities: Impacts of the Consumption in the
       7-County Metro Area. Minneapolis: Metropolitan Design Centre, College of Design, University of
       Minnesota.

Ecological Footprint as a Sustainability Indicator

  • 1.
    National Research Conference– 2012 Organized by: Bangladesh Peace and Development Mission In Association With: National Academy for Educational Management Ecological Footprint as a Sustainability Indicator Shahadat Hossain Shakil*, Dr. Ishrat Islam** Abstract Ecological Footprint assessment helps to identify what activities are having the biggest impact on nature and opens up possibilities to reduce our impact and live within the means of One Planet. It provides measurement of collective consumption of the population whether they are exceeding the Earth’s ecological limits or not. It is compared with Biocapacity which measures the amount of available bioproductive resources in ecosystem. The introduction of Ecological Footprint has been very necessary for the context of Bangladesh especially in Dhaka as the endless demand and the unplanned consumption pattern of the population here have been producing a very unsustainable situation. Keywords: Ecological Footprint, Biocapacity, Environmental Sustainability Introduction The 21 st century is going to introducing us to a more complicated scenario than ever to access the ecosystem service. The current trend of consumption, urbanization, industrialization is sending us closer to food shortage, biodiversity loss, depleted fisheries, soil erosion and freshwater stress. The effect of these will be reflected by the global supply-demand crisis of essential resources. To manage both ecological reserve and demand in a better way, immediate strategies should be put forth and one of the major indicators for making these strategies is Ecological Footprint (Ewing, Moore, Goldfinger, Oursler, Reed, & Wackernagel, 2010). The Ecological Footprint is a well-respected, internationally applied indicator of sustainability. It was developed in 1990 by Mathis Wackernagel and William Rees as a means of making our ecological constraints clear and our sustainability strategies more effective and livable. Ecological footprint is one of the approaches working as a successful sustainability indicator. It is an evolving topic and modification of this tool is still going on. *Research Assistant, Department of Urban and Regional Planning, Bangladesh University of Engineering and Technology, Dhaka-1000. E- mail: shshakil.buet@gmail.com, Cell: 01717189153 **Associate Professor, Department of Urban and Regional Planning, Bangladesh University of Engineering and Technology, Dhaka-1000. E- mail: ishratislam@urp.buet.ac.bd The emergence of Ecological Footprint has taken place to measure humanity’s demand on nature. It measures how much land and water area a human population requires to produce the resource it consumes and to absorb its carbon dioxide emissions, using prevailing technology. To provide the resources we use
  • 2.
    and absorb ourwaste, humanity uses the equivalent of 1.5 planets today. This means the Earth now needs one year and six months to regenerate what we use in a year. Moderate UN scenarios suggest that if current population and consumption trends continue, by the 2030s, we will need the equivalent of two Earths to support us and of course, we only have one (Footprint Basics–Overview,Global Footprint Network, 2011). Concepts and Definition Footprint accounts are divided into two parts: ecological supply (Bioproductive Area or Biocapacity) and human demand on nature (Ecological Footprint). Ecological Footprint – Demand It is a measure of how much biologically productive land and water an individual, population or activity requires to produce all the resources it consumes and to absorb the carbon dioxide emissions it generates using prevailing technology and resource management practices (Glossary,Global Footprint Network, 2011). Components of Ecological Footprint Account have been illustrated in Figure 1. Figure 1: Components of Ecological Footprint Source: WWF (2010) Formula of Ecological Footprint derived from National Footprint Account Methodology 2010 (Ewing, Reed, Galli, Kitzes, & Wackernagel, 2010): EF = (P/YN). YF. EQF Where, P = Amount of Product Harvested or Waste Emitted YN = National Average Yield for P or its Carbon Uptake Capacity YF = Yield Factor, EQF = Equivalency Factor Footprint is expressed in global hectares. Global hectares are estimated with the help of two factors: the yield factors (that compare national average yield per hectare to world average yield in the same land category) and the equivalence factors (which capture the relative productivity among the various land and sea area types).
  • 3.
    Biocapacity – Supply Biocapacityis the capacity of ecosystems to produce biological materials useful for people, and to absorb waste they generate (including carbon dioxide from fossil fuel burning), using current management schemes and extraction technologies (Glossary, Global Footprint Network, 2011). Biocapacity is usually expressed in units of global hectares. The biocapacity of an area is calculated by adjusting the area for its productivity. This is achieved by multiplying the actual physical area by the area specific yield factor and the appropriate equivalence factor. According to National Footprint Account Methodology 2010 (Ewing, Reed, Galli, Kitzes, & Wackernagel, 2010), a country’s biocapacity BC for any land use type is calculated as follows: BC = A. YF. EQF Where, A= Area Available for a Given Land Use Type YF and EQF = Yield Factor and Equivalence Factor, respectively, for the Country, Year, and Land Use Type in Question Ecological Deficit or Overshoot The difference between the Biocapacity and Ecological Footprint of a region or country is termed as Ecological Deficit or Overshoot. An ecological deficit occurs when the footprint of a population exceeds the biocapacity of the area available to that population. Conversely, an ecological reserve exists when the biocapacity of a region exceeds its population's footprint. If there is a regional or national ecological deficit, it means that the region is importing biocapacity through trade or liquidating regional ecological assets. In contrast, the global ecological deficit cannot be compensated through trade, and is therefore equal to overshoot (Glossary, Global Footprint Network, 2011). Notion of Ecological Overshoot has been exemplified in Figure 2.
  • 4.
    Figure 2: Footprintand Biocapacity Factors that Determine Global Overshoot Source: Ewing, Moore, Goldfinger, Oursler, Reed, & Wackernagel (2010) Ecological Footprint as Sustainability Indicator The Ecological Footprint attempts to answer one central sustainability question: “How much of the bioproductive capacity of the biosphere is used by human activities?” Footprint accounting answers this question by translating all human demands on the biosphere into the amount of productive area required to support those demands, either through producing resources or assimilating wastes. This can then be compared to the total amount of biologically productive land available at the global level or within a specific region. Such a measure of the supply of and human demand on natural capital is indispensable for tracking progress, setting targets and driving policies for sustainability. To manage our natural capital wisely, it is important to know how much we have and how much we use (McIntyre & Peters, 2007). Ecological footprint accounts allow governments to track a city or region’s demand on natural capital, and to compare this demand with the amount of natural capital actually available. The accounts also give governments the ability to answer more specific questions about the distribution of these demands within their economy. In other words, it gives them information about their resource metabolism (Footprint for Cities, Global Footprint Network, 2011). Conclusion Ecological footprint figure confirms us the about degree of sustainability of our lifestyle from the environmental perspective. It demonstrates how much resources we have and how rapidly we are using them for our present existence. It illustrates whether we are on right track by maintaining the balance or we are living on ecological credits, borrowing resources from our future generations.
  • 5.
    References Ewing, B., Moore,D., Goldfinger, S., Oursler, A., Reed, A., & Wackernagel, M. (2010). Ecological Footprint Atlas 2010. Oakland: Global Footprint Network. Ewing, B., Reed, A., Galli, A., Kitzes, J., & Wackernagel, M. (2010). Calculation Methodology for the National Footprint Accoounts, 2010 Edition. Oakland: Global Footprint Network. Global Footprint Network. (2011). Foorprint Basics-Overview. Retrieved May 10, 2011, from Global Footprint Network : Advancing the Science of Sustainability: http://www.footprintnetwork.org/en/index.php/GFN/page/footprint_basics_overview/ Global Footprint Network. (2011). Footprint For Cities . Retrieved May 10, 2011, from Global Footprint Network : Advancing the Science of Sustainability : http://www.footprintnetwork.org/en/index.php/GFN/page/footprint_for_cities/ Global Footprint Network. (2011). Glossary. Retrieved May 10, 2011, from Global Footprint Network : Advancing the Science of Sustainability: http://www.footprintnetwork.org/en/index.php/GFN/ McIntyre, S. A., & Peters, H. M. (2007, June 26). The Ecological Footprint of Utah. Retrieved April 4, 2011, from Utah Vital Sign: http://www.utahpop.org/vitalsigns/research/report_2007.htm WWF. (2010). Living Planet Report 2010. Switzerland: World Wide Fund For Nature International. Xu, S., & Martin, I. S. (2010). Ecological Footprint for The Twin Cities: Impacts of the Consumption in the 7-County Metro Area. Minneapolis: Metropolitan Design Centre, College of Design, University of Minnesota.