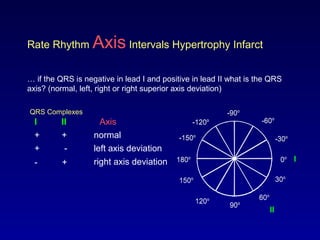
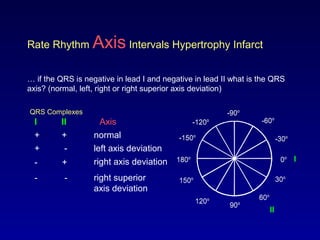
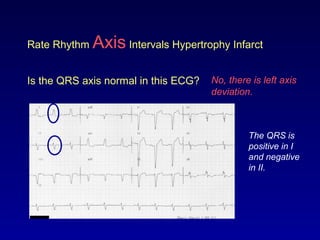
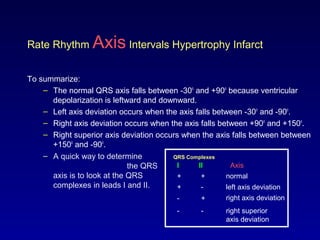
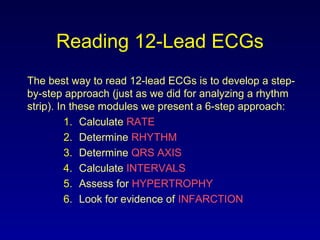
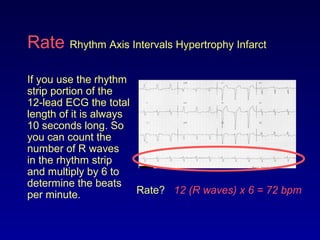
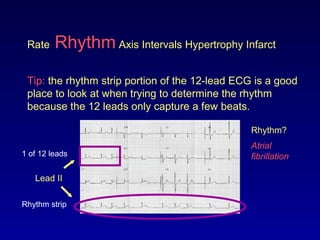
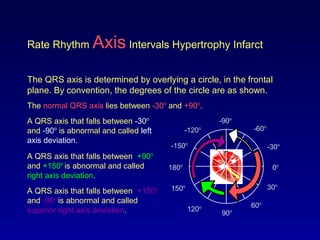
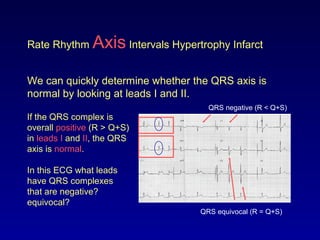
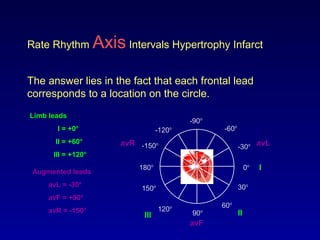
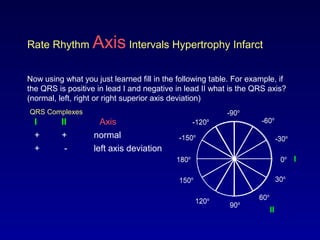
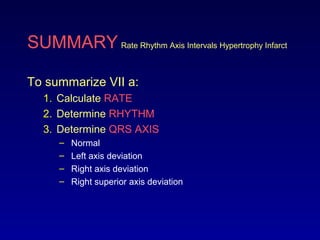
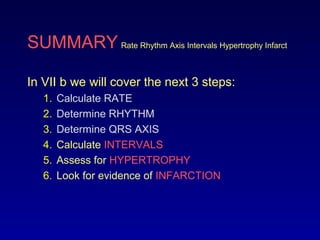
This document outlines the steps for systematically reading a 12-lead ECG:
1. Calculate the heart rate
2. Determine the rhythm
3. Determine if the QRS axis is normal or shows left/right axis deviation
4. Calculate intervals between waves
5. Assess for signs of cardiac hypertrophy
6. Look for evidence of a myocardial infarction
It provides guidance on analyzing each component, such as how to identify normal vs. abnormal QRS axis using leads I and II.
crème de la crème basics to understand electrocardiographic analysis in an easy & simple way with some specifications to its use in Emergency medicine/clinical toxicology practice.
Our concepts of heart disease are based on the enormous reservoir of physiologic and anatomic knowledge derived from the past 70 years' of experience in the cardiac catheterization laboratory.
As Andre Cournand remarked in his Nobel lecture of December 11, 1956, the cardiac catheter was the key in the lock.
By turning this key, Cournand and his colleagues led us into a new era in the understanding of normal and disordered cardiac function in huma
Breakout 1.3 Improving COPD Care in the West Midlands - Colin GelderNHS Improvement
Breakout 1.3 Improving COPD Care in the West Midlands - Colin Gelder
Clinical Lead Respiratory Midlands Region, NHS Midlands & EastMidlands East
Part of a set of presentations from NHS Improvement event: Better value, better outcomes held on Thursday 21 February 2013,
Guoman Tower Hotel, London
How to deliver quality and value in chronic care:sharing the learning from the respiratory programme
Dr Denis Wat of Liverpool Heart & Chest Hospital and Kevin Auton of Aseptika present their feasibility study on self care with COPD patients at ECO9 event on 13th September 2016
2011-10-21 ASIP Santé Conférence Télémédecine "Présentation de COPD Briefcase"ASIP Santé
Présentation d'un outil de télésurveillance médicale à domicile de patients atteints de broncho-pneumopathie chronique obstructive (COPD Briefcase)
Anne DICHMANN-SORKNAES, Universitaire d’Odense au Danemark - COPD Briefcase
ecg basics made easy, with description of most common ecg types especially in emergency situation.
easy to memorize points and mnemonics included.
approach to ecg diagnosis.
sample ecgs.
Also known as an electrocardiogram or an EKG, an ECG is a test that detects and records the strength and timing of the electrical activity in your heart. This information is recorded on a graph that shows each phase of the electrical signal as it travels through your heart.
Deep Leg Vein Thrombosis (DVT): Meaning, Causes, Symptoms, Treatment, and Mor...The Lifesciences Magazine
Deep Leg Vein Thrombosis occurs when a blood clot forms in one or more of the deep veins in the legs. These clots can impede blood flow, leading to severe complications.
CHAPTER 1 SEMESTER V PREVENTIVE-PEDIATRICS.pdfSachin Sharma
This content provides an overview of preventive pediatrics. It defines preventive pediatrics as preventing disease and promoting children's physical, mental, and social well-being to achieve positive health. It discusses antenatal, postnatal, and social preventive pediatrics. It also covers various child health programs like immunization, breastfeeding, ICDS, and the roles of organizations like WHO, UNICEF, and nurses in preventive pediatrics.
The dimensions of healthcare quality refer to various attributes or aspects that define the standard of healthcare services. These dimensions are used to evaluate, measure, and improve the quality of care provided to patients. A comprehensive understanding of these dimensions ensures that healthcare systems can address various aspects of patient care effectively and holistically. Dimensions of Healthcare Quality and Performance of care include the following; Appropriateness, Availability, Competence, Continuity, Effectiveness, Efficiency, Efficacy, Prevention, Respect and Care, Safety as well as Timeliness.
One of the most developed cities of India, the city of Chennai is the capital of Tamilnadu and many people from different parts of India come here to earn their bread and butter. Being a metropolitan, the city is filled with towering building and beaches but the sad part as with almost every Indian city
Leading the Way in Nephrology: Dr. David Greene's Work with Stem Cells for Ki...Dr. David Greene Arizona
As we watch Dr. Greene's continued efforts and research in Arizona, it's clear that stem cell therapy holds a promising key to unlocking new doors in the treatment of kidney disease. With each study and trial, we step closer to a world where kidney disease is no longer a life sentence but a treatable condition, thanks to pioneers like Dr. David Greene.
Navigating Challenges: Mental Health, Legislation, and the Prison System in B...Guillermo Rivera
This conference will delve into the intricate intersections between mental health, legal frameworks, and the prison system in Bolivia. It aims to provide a comprehensive overview of the current challenges faced by mental health professionals working within the legislative and correctional landscapes. Topics of discussion will include the prevalence and impact of mental health issues among the incarcerated population, the effectiveness of existing mental health policies and legislation, and potential reforms to enhance the mental health support system within prisons.
Health Education on prevention of hypertensionRadhika kulvi
Hypertension is a chronic condition of concern due to its role in the causation of coronary heart diseases. Hypertension is a worldwide epidemic and important risk factor for coronary artery disease, stroke and renal diseases. Blood pressure is the force exerted by the blood against the walls of the blood vessels and is sufficient to maintain tissue perfusion during activity and rest. Hypertension is sustained elevation of BP. In adults, HTN exists when systolic blood pressure is equal to or greater than 140mmHg or diastolic BP is equal to or greater than 90mmHg. The
3. Learning Modules
• ECG Basics
• How to Analyze a Rhythm
• Normal Sinus Rhythm
• Heart Arrhythmias
• Diagnosing a Myocardial Infarction
• Advanced 12-Lead Interpretation
• Reading 12-Lead ECG’s
4. Reading 12-Lead ECGs
• The 12-Lead ECG contains information that will assist
you in making diagnostic and treatment decisions in your
clinical practice. In previous modules you learned how to
read and interpret parts of the ECG. Now, we will bring all
that you have learned together so that you can
systematically read and interpret a 12-lead ECG.
• The information will be divided into two modules, VII a
and VII b.
5. Reading 12-Lead ECGs
The best way to read 12-lead ECGs is to develop a step-
by-step approach (just as we did for analyzing a rhythm
strip). In these modules we present a 6-step approach:
1. Calculate RATE
2. Determine RHYTHM
3. Determine QRS AXIS
4. Calculate INTERVALS
5. Assess for HYPERTROPHY
6. Look for evidence of INFARCTION
6. Rate Rhythm Axis Intervals Hypertrophy Infarct
• In Module II you learned how to calculate the
rate. If you need a refresher return to that module.
• There is one new thing to keep in mind when
determining the rate in a 12-lead ECG…
7. Rate Rhythm Axis Intervals Hypertrophy Infarct
If you use the rhythm
strip portion of the
12-lead ECG the total
length of it is always
10 seconds long. So
you can count the
number of R waves
in the rhythm strip
and multiply by 6 to
determine the beats
per minute. Rate? 12 (R waves) x 6 = 72 bpm
8. Rate Rhythm Axis Intervals Hypertrophy Infarct
• In Module II you learned how to systematically
analyze a rhythm by looking at the rate, regularity,
P waves, PR interval and QRS complexes.
• In Modules III, IV and V you learned how to
recognize Normal Sinus Rhythm and the 13 most
common rhythm disturbances.
• If you need a refresher return to these modules.
9. Rate Rhythm Axis Intervals Hypertrophy Infarct
Tip: the rhythm strip portion of the 12-lead ECG is a good
place to look at when trying to determine the rhythm
because the 12 leads only capture a few beats.
Lead II
Rhythm?
Atrial
fibrillation
Rhythm strip
1 of 12 leads
10. Rate Rhythm Axis Intervals Hypertrophy Infarct
Axis refers to the mean QRS axis (or vector) during ventricular
depolarization. As you recall when the ventricles depolarize (in a
normal heart) the direction of current flows leftward and downward
because most of the ventricular mass is in the left ventricle. We like
to know the QRS axis because an abnormal axis can suggest
disease such as pulmonary hypertension from a pulmonary
embolism.
11. Rate Rhythm Axis Intervals Hypertrophy Infarct
The QRS axis is determined by overlying a circle, in the frontal
plane. By convention, the degrees of the circle are as shown.
The normal QRS axis lies between -30o
and +90o
.
0o
30o
-30o
60o
-60o
-90o
-120o
90o120o
150o
180o
-150o
A QRS axis that falls between -30o
and -90o
is abnormal and called left
axis deviation.
A QRS axis that falls between +90o
and +150o
is abnormal and called
right axis deviation.
A QRS axis that falls between +150o
and -90o
is abnormal and called
superior right axis deviation.
12. Rate Rhythm Axis Intervals Hypertrophy Infarct
• Causes of left axis deviation
include:
– Left ventricular hypertrophy
– Inferior wall MI
– Left bundle branch block
– Left anterior fascicular block
– Horizontal heart
0o
-90o
90o
180o
• Causes of right axis deviation
include:
– Right ventricular hypertrophy
– Lateral wall MI
– Right bundle branch block
– Pulmonary hypertension
– Vertical heart
13. Rate Rhythm Axis Intervals Hypertrophy Infarct
We can quickly determine whether the QRS axis is
normal by looking at leads I and II.
If the QRS complex is
overall positive (R > Q+S)
in leads I and II, the QRS
axis is normal.
QRS negative (R < Q+S)
In this ECG what leads
have QRS complexes
that are negative?
equivocal?
QRS equivocal (R = Q+S)
14. Rate Rhythm Axis Intervals Hypertrophy Infarct
How do we know the axis is normal when the QRS
complexes are positive in leads I and II?
15. Rate Rhythm Axis Intervals Hypertrophy Infarct
The answer lies in the fact that each frontal lead
corresponds to a location on the circle.
0o
30o
-30o
60o
-60o
-90o
-120o
90o120o
150o
180o
-150o
I
II
avF
avLavR
Limb leads
I = +0o
II = +60o
III = +120o
Augmented leads
avL = -30o
avF = +90o
avR = -150o
I
IIIII
16. 0o
30o
-30o
60o
-60o
-90o
-120o
90o120o
150o
180o
-150o
Rate Rhythm Axis Intervals Hypertrophy Infarct
Since lead I is orientated at 0o
a wave of depolarization directed towards it
will result in a positive QRS axis. Therefore any mean QRS vector
between -90o
and +90o
will be positive.
I
17. 0o
30o
-30o
60o
-60o
-90o
-120o
90o120o
150o
180o
-150o
Rate Rhythm Axis Intervals Hypertrophy Infarct
Since lead I is orientated at 0o
a wave of depolarization directed towards it
will result in a positive QRS axis. Therefore any mean QRS vector
between -90o
and +90o
will be positive.
Similarly, since lead II is orientated at 60o
a wave of depolarization directed towards
it will result in a positive QRS axis.
Therefore any mean QRS vector between
-30o
and +150o
will be positive.
I
II
18. 0o
30o
-30o
60o
-60o
-90o
-120o
90o120o
150o
180o
-150o
Rate Rhythm Axis Intervals Hypertrophy Infarct
Since lead I is orientated at 0o
a wave of depolarization directed towards it
will result in a positive QRS axis. Therefore any mean QRS vector
between -90o
and +90o
will be positive.
Similarly, since lead II is orientated at 60o
a wave of depolarization directed towards
it will result in a positive QRS axis.
Therefore any mean QRS vector between
-30o
and +150o
will be positive.
Therefore, if the QRS complex is positive
in both leads I and II the QRS axis must
be between -30o
and 90o
(where leads I
and II overlap) and, as a result, the axis
must be normal.
I
II
21. 0o
30o
-30o
60o
-60o
-90o
-120o
90o120o
150o
180o
-150o
Rate Rhythm Axis Intervals Hypertrophy Infarct
… if the QRS is negative in lead I and negative in lead II what is the QRS
axis? (normal, left, right or right superior axis deviation)
QRS Complexes
I
AxisI II
+ +
+ -
- +
- -
normal
left axis deviation
right axis deviation
right superior
axis deviation
0o
30o
-30o
60o
-60o
-90o
-120o
90o120o
150o
180o
-150o
II
22. Rate Rhythm Axis Intervals Hypertrophy Infarct
Is the QRS axis normal in this ECG? No, there is left axis
deviation.
The QRS is
positive in I
and negative
in II.
23. Rate Rhythm Axis Intervals Hypertrophy Infarct
To summarize:
– The normal QRS axis falls between -30o
and +90o
because ventricular
depolarization is leftward and downward.
– Left axis deviation occurs when the axis falls between -30o
and -90o
.
– Right axis deviation occurs when the axis falls between +90o
and +150o
.
– Right superior axis deviation occurs when the axis falls between between
+150o
and -90o
.
QRS Complexes
AxisI II
+ +
+ -
- +
- -
normal
left axis deviation
right axis deviation
right superior
axis deviation
– A quick way to determine
the QRS
axis is to look at the QRS
complexes in leads I and II.
24. SUMMARY Rate Rhythm Axis Intervals Hypertrophy Infarct
To summarize VII a:
1. Calculate RATE
2. Determine RHYTHM
3. Determine QRS AXIS
– Normal
– Left axis deviation
– Right axis deviation
– Right superior axis deviation
25. SUMMARY Rate Rhythm Axis Intervals Hypertrophy Infarct
In VII b we will cover the next 3 steps:
1. Calculate RATE
2. Determine RHYTHM
3. Determine QRS AXIS
4. Calculate INTERVALS
5. Assess for HYPERTROPHY
6. Look for evidence of INFARCTION