Downloaded 146 times

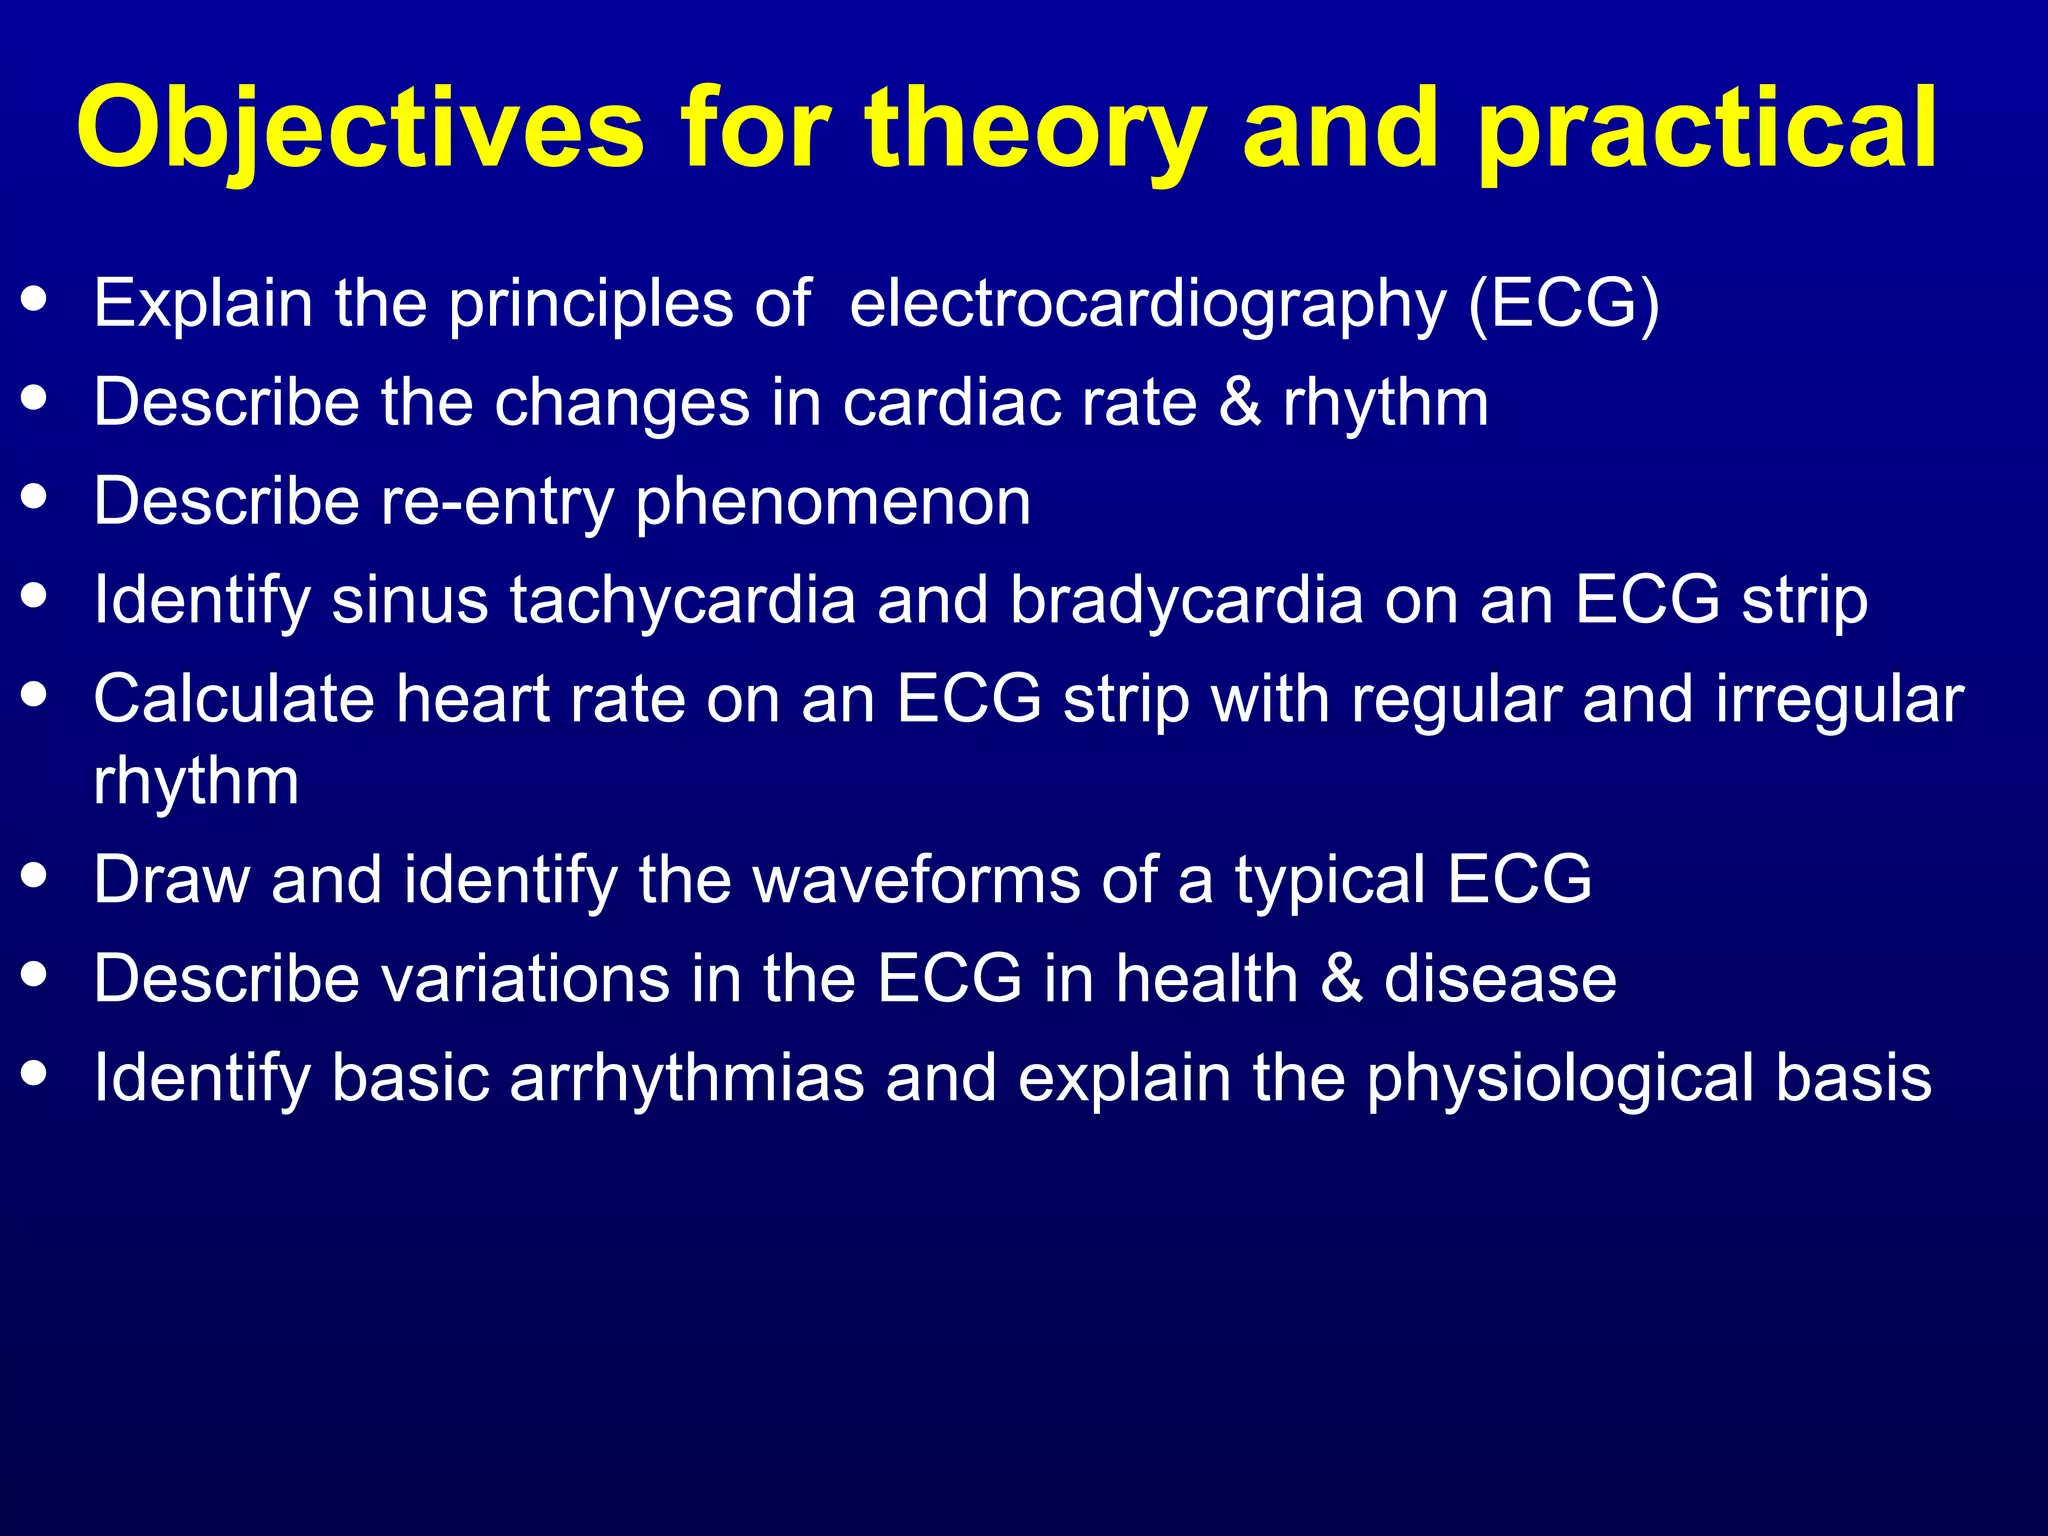


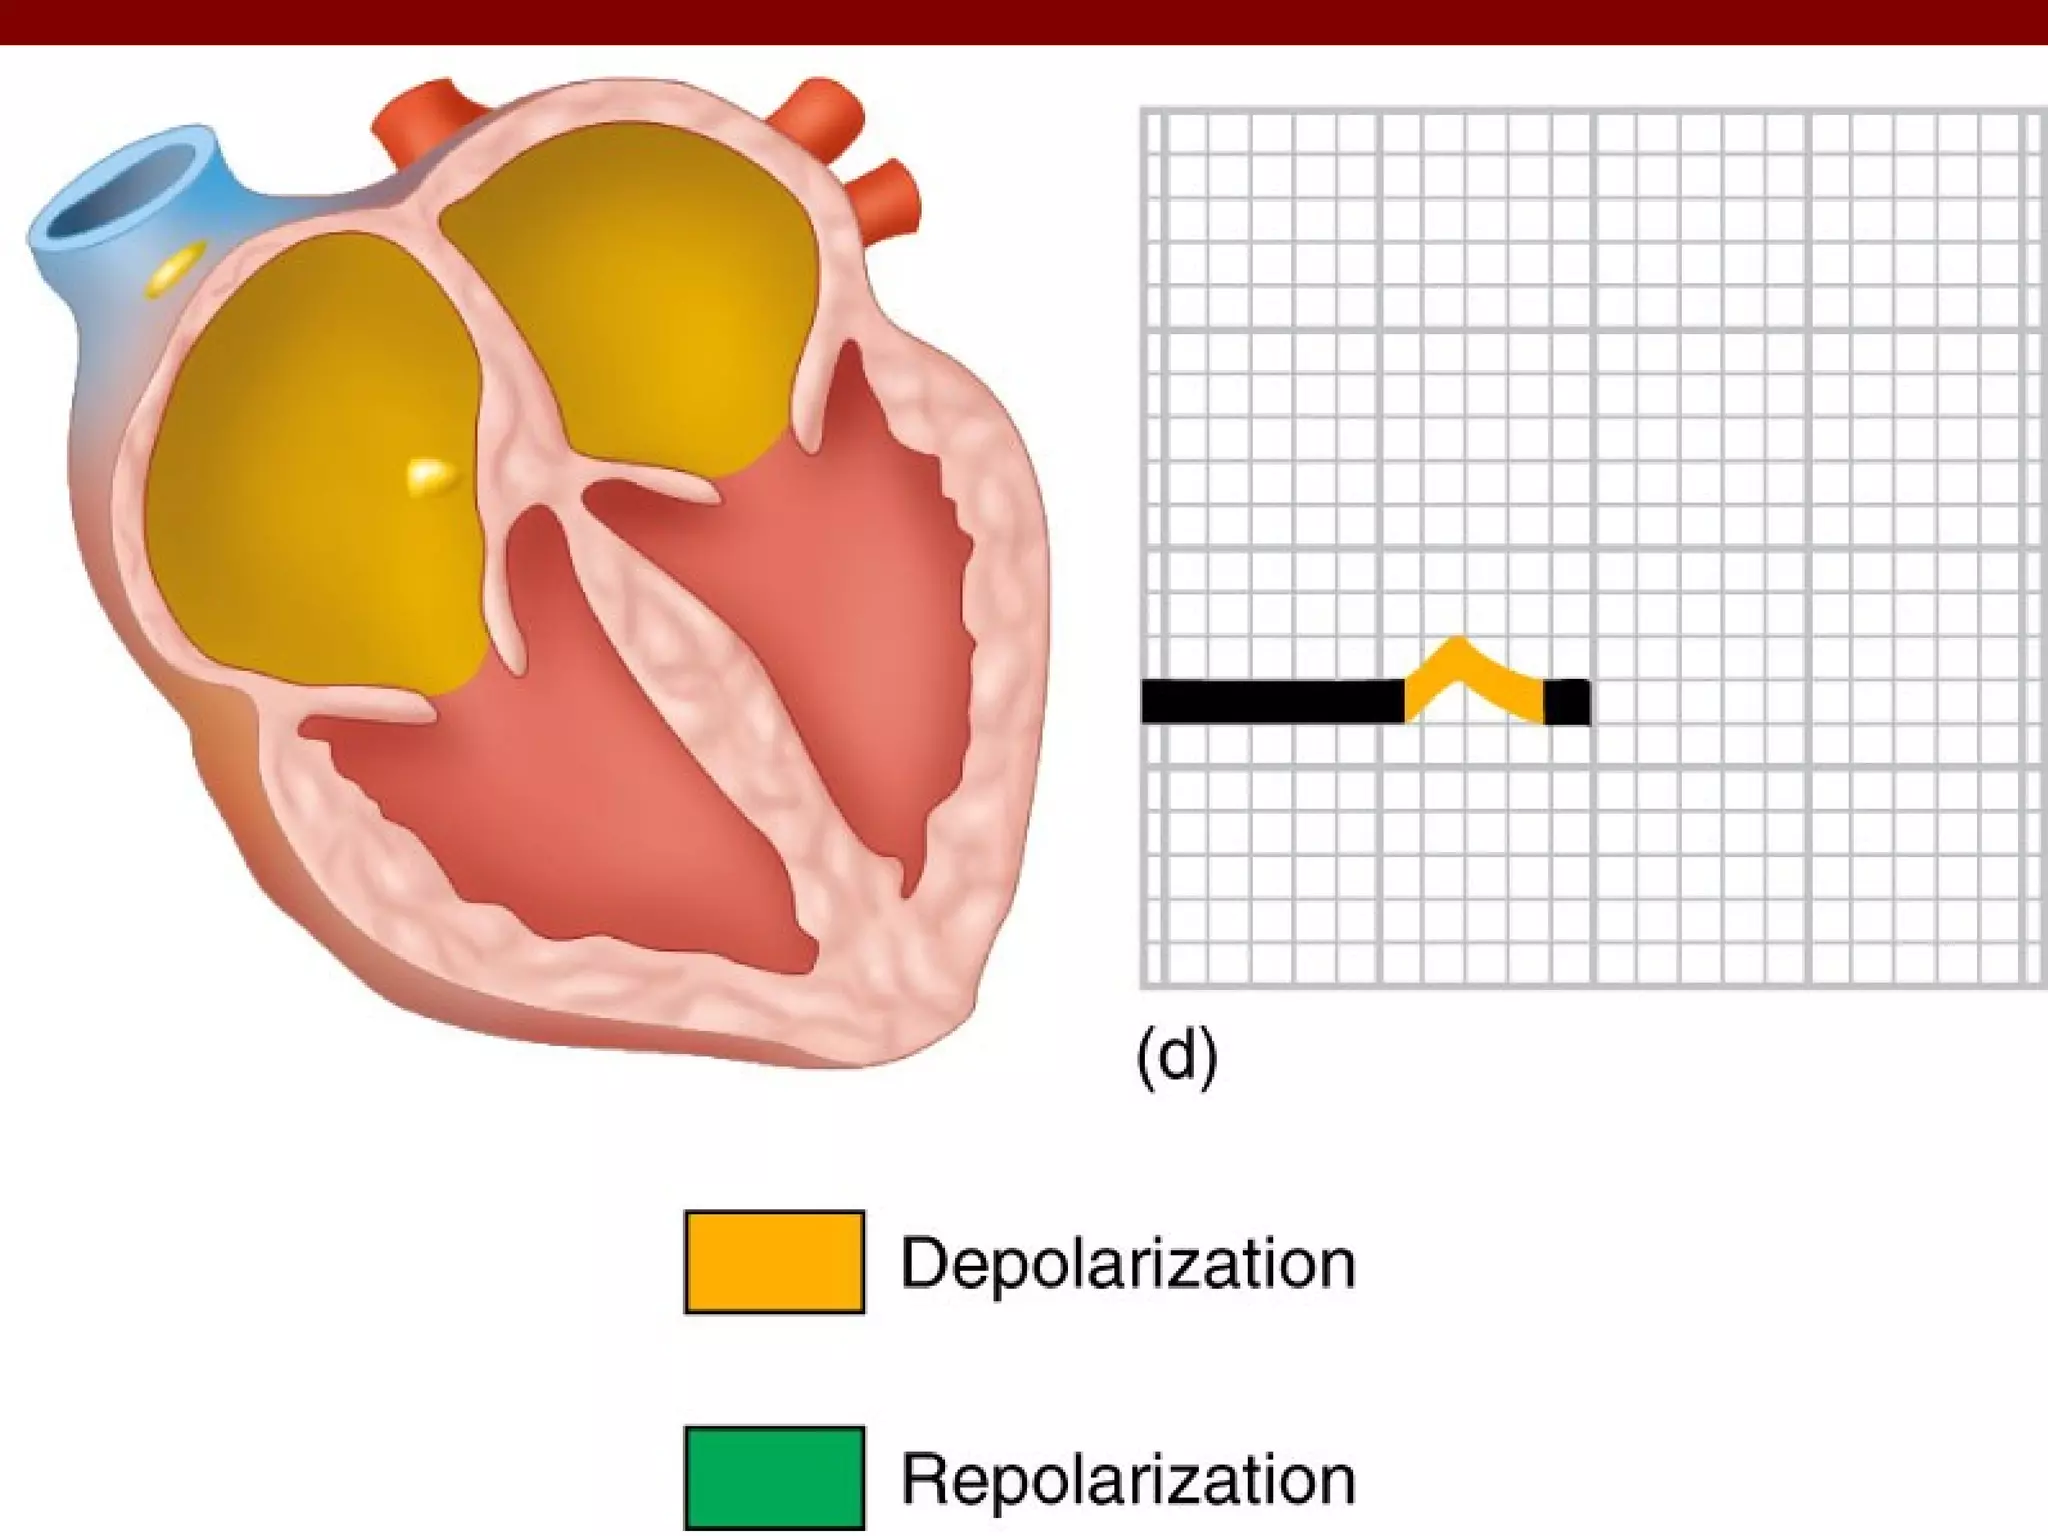


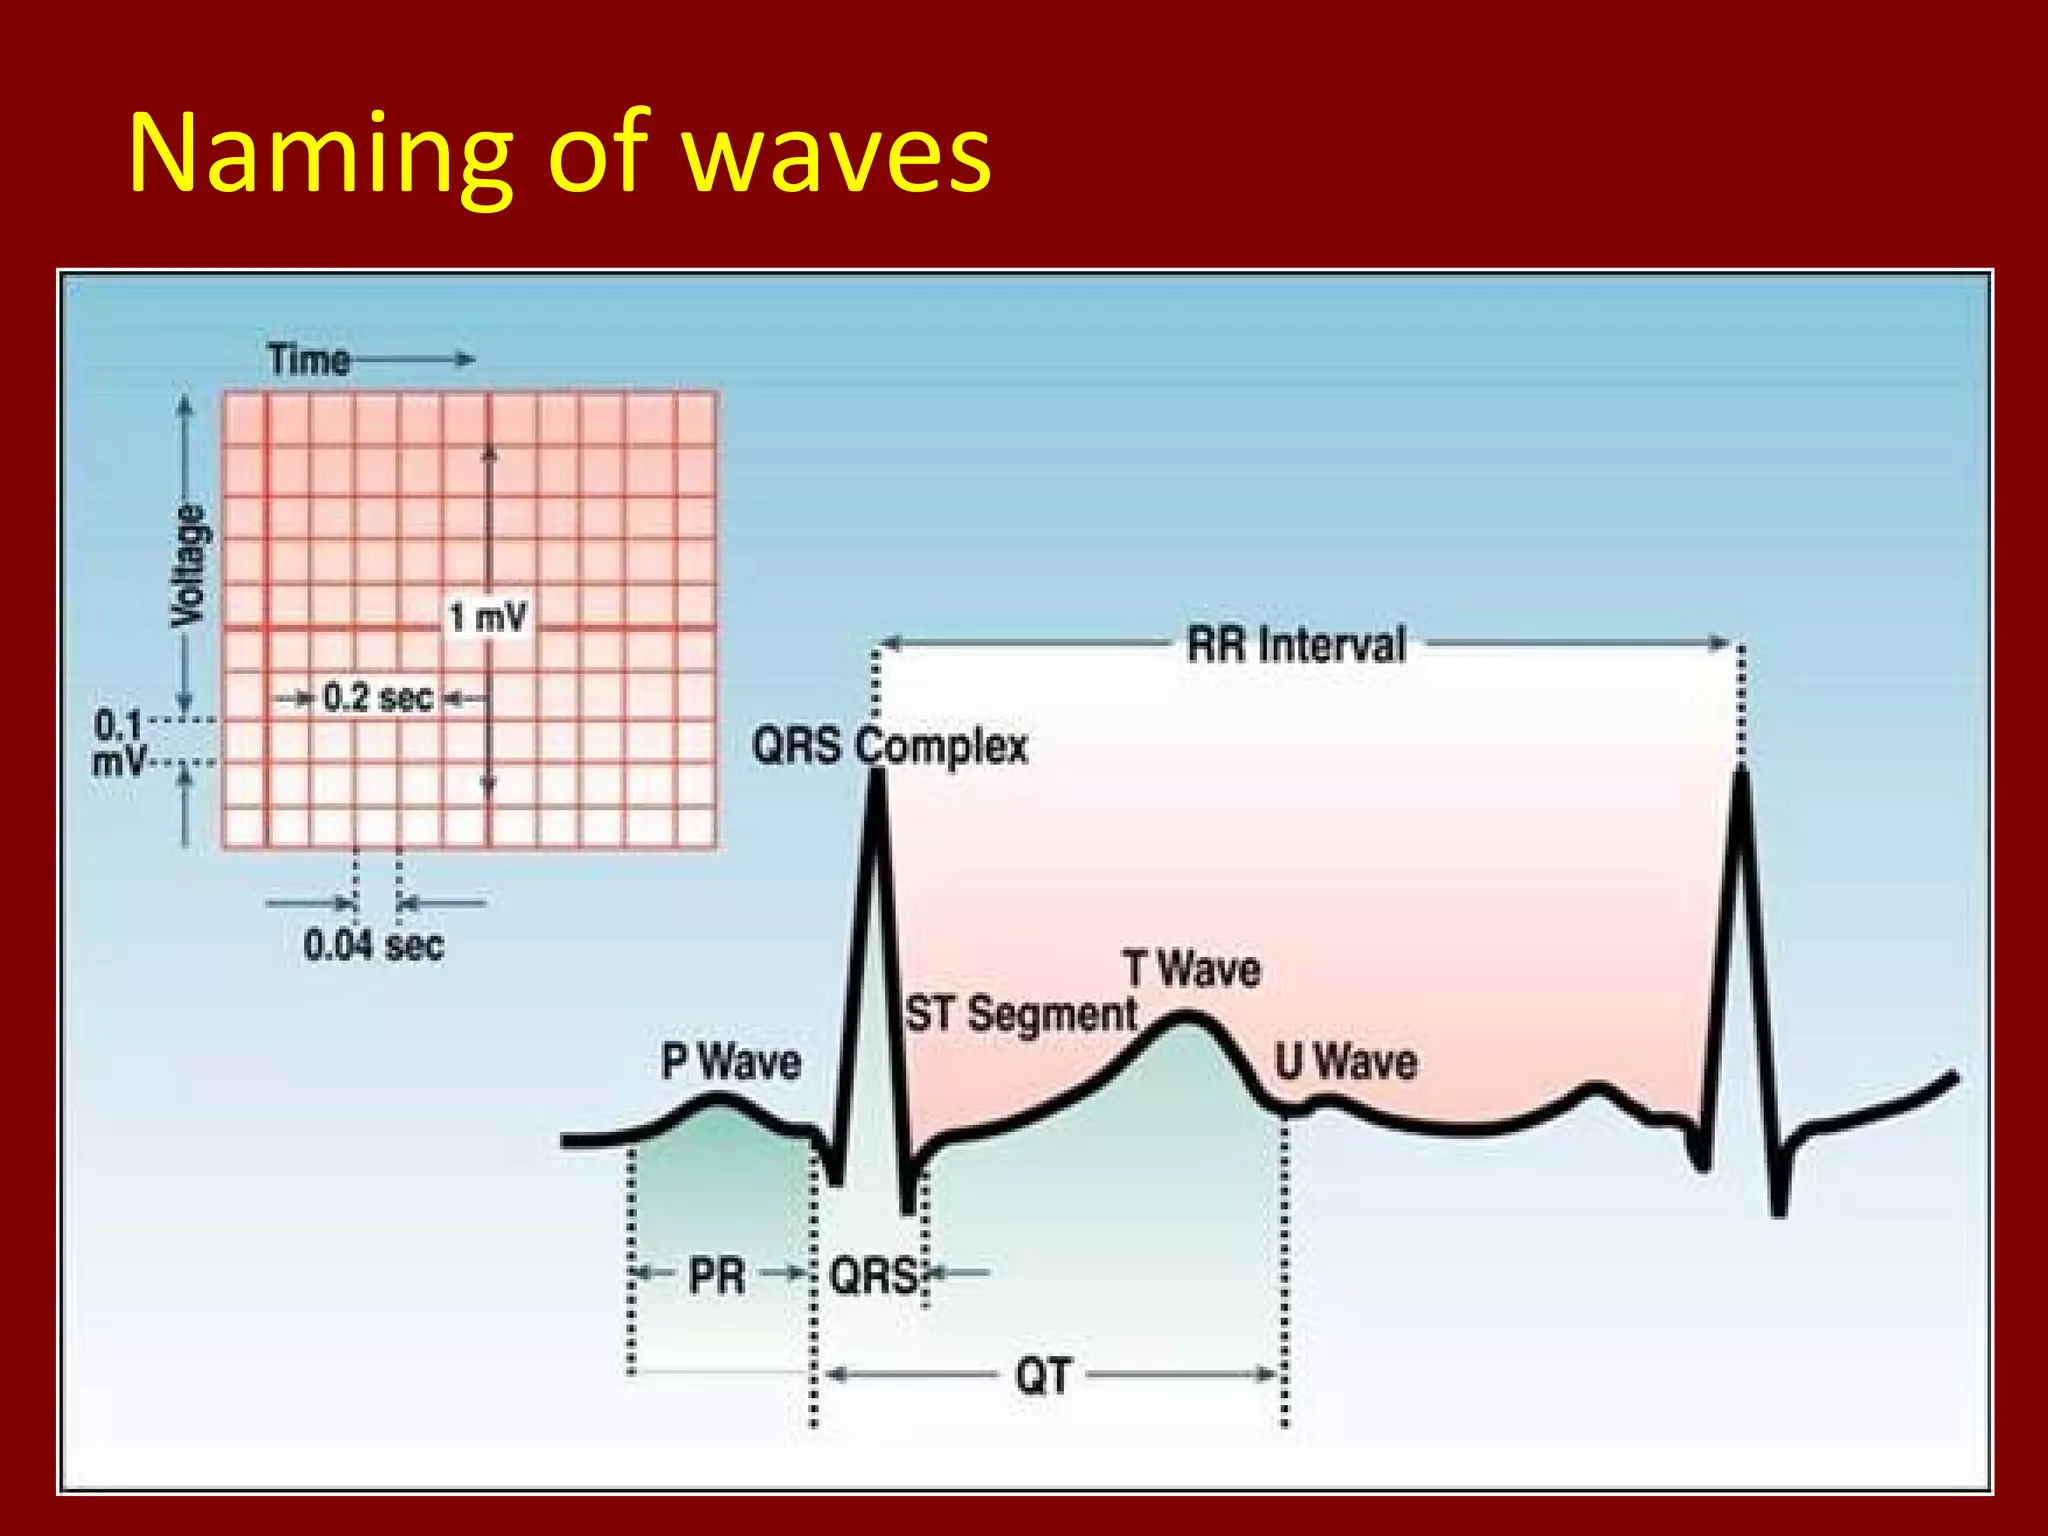


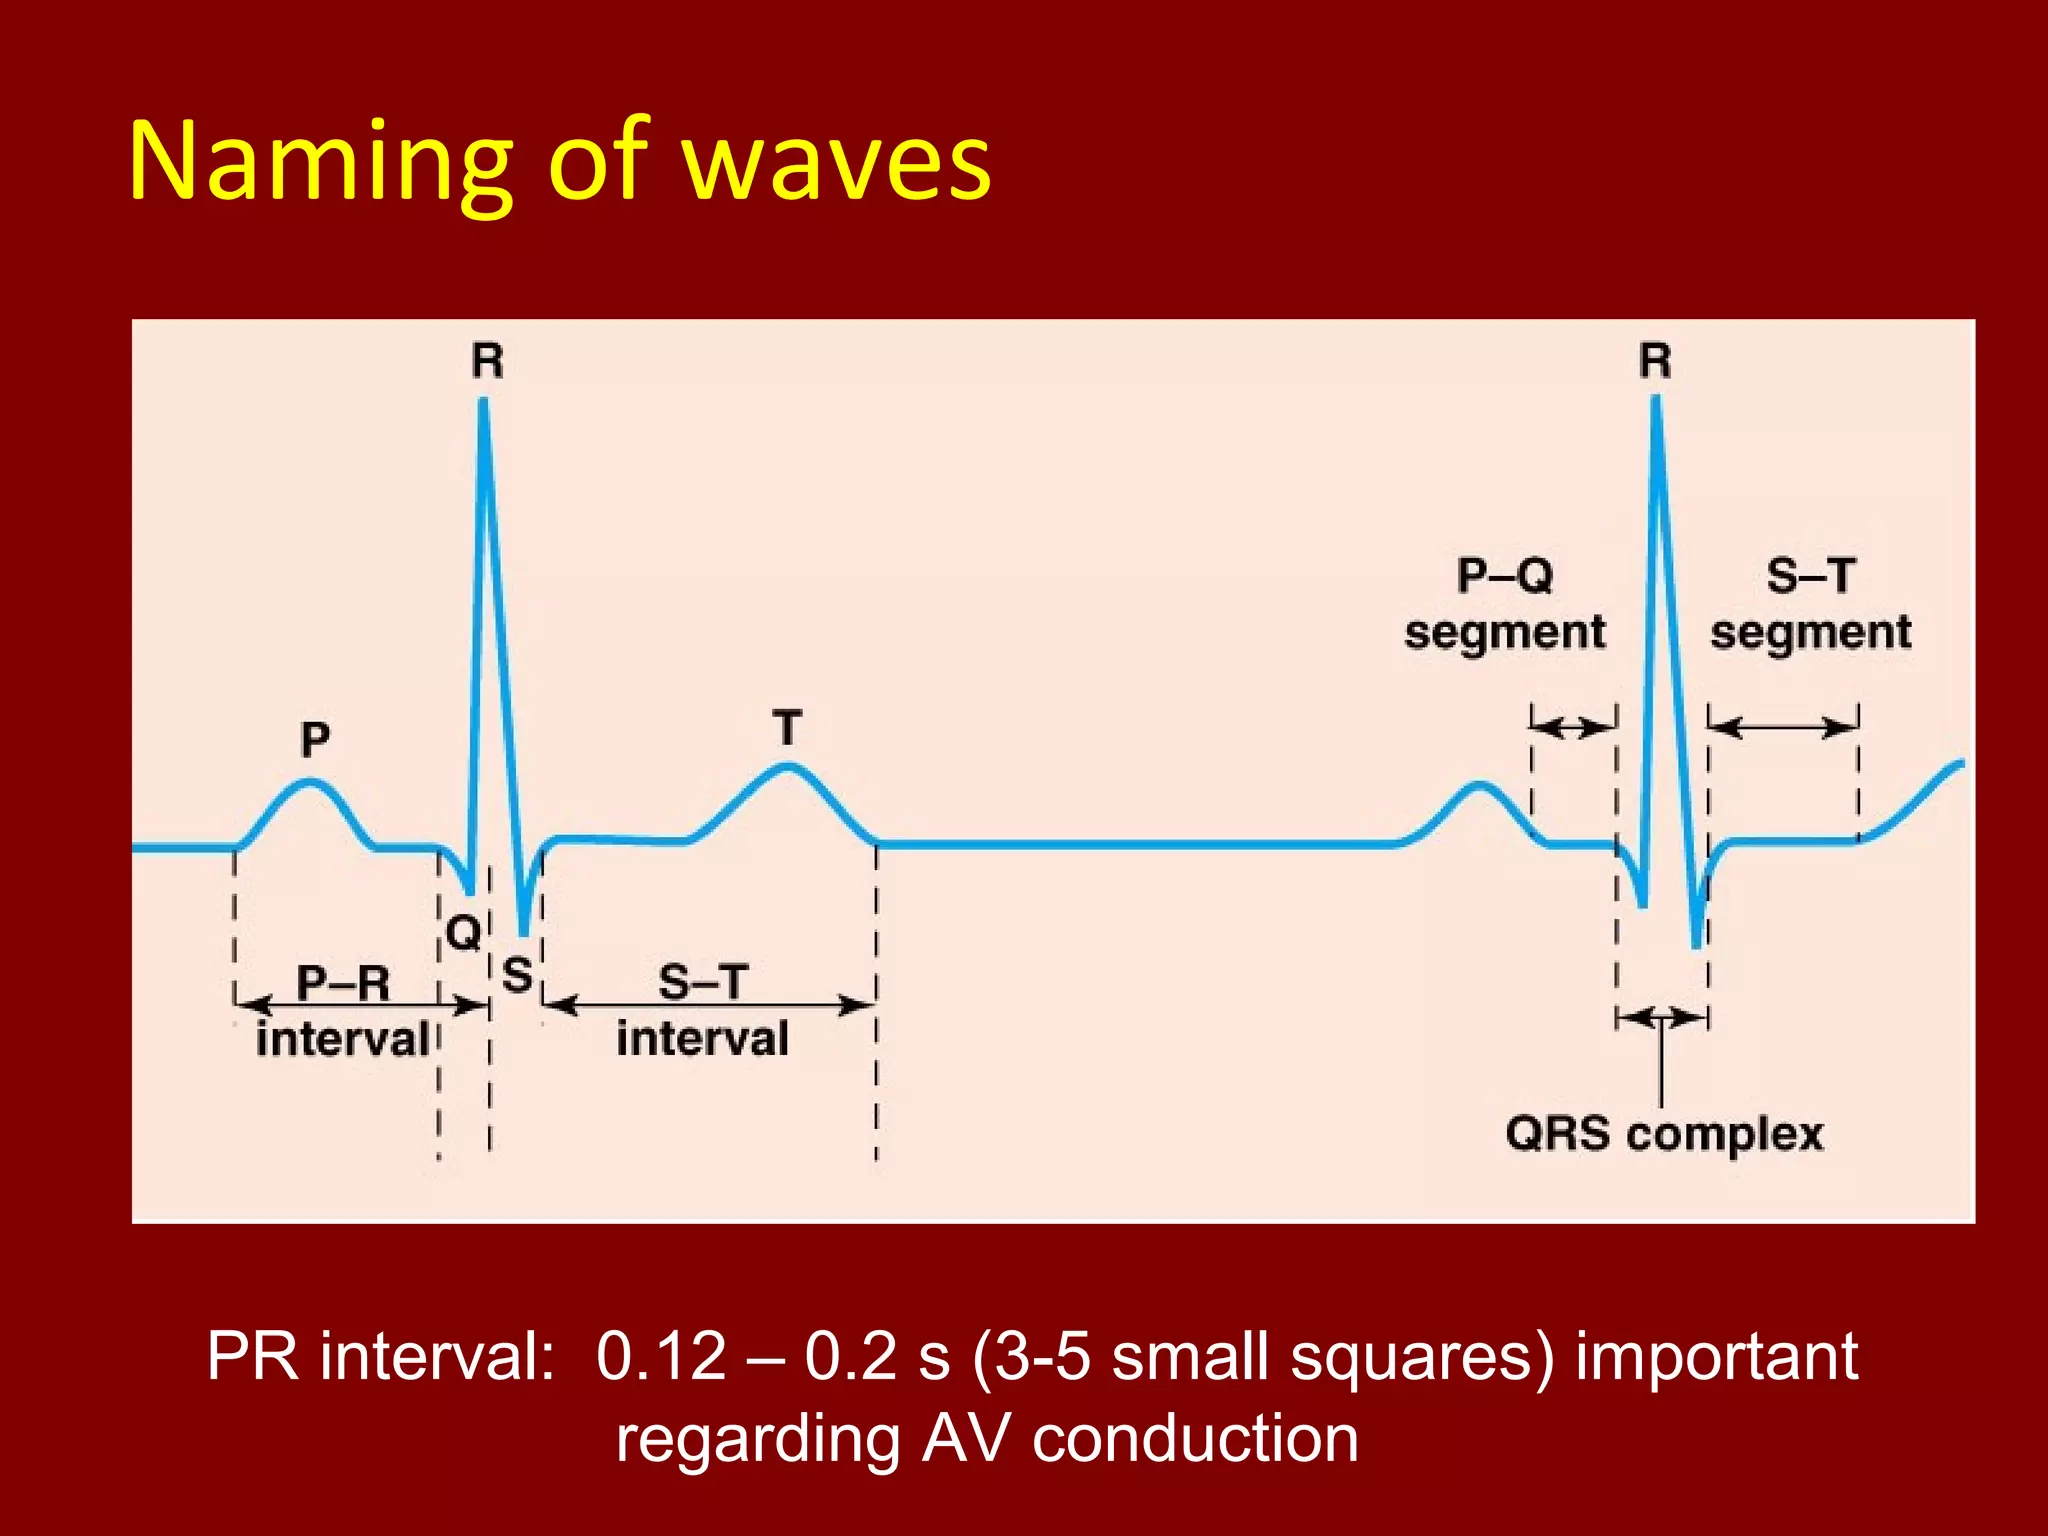


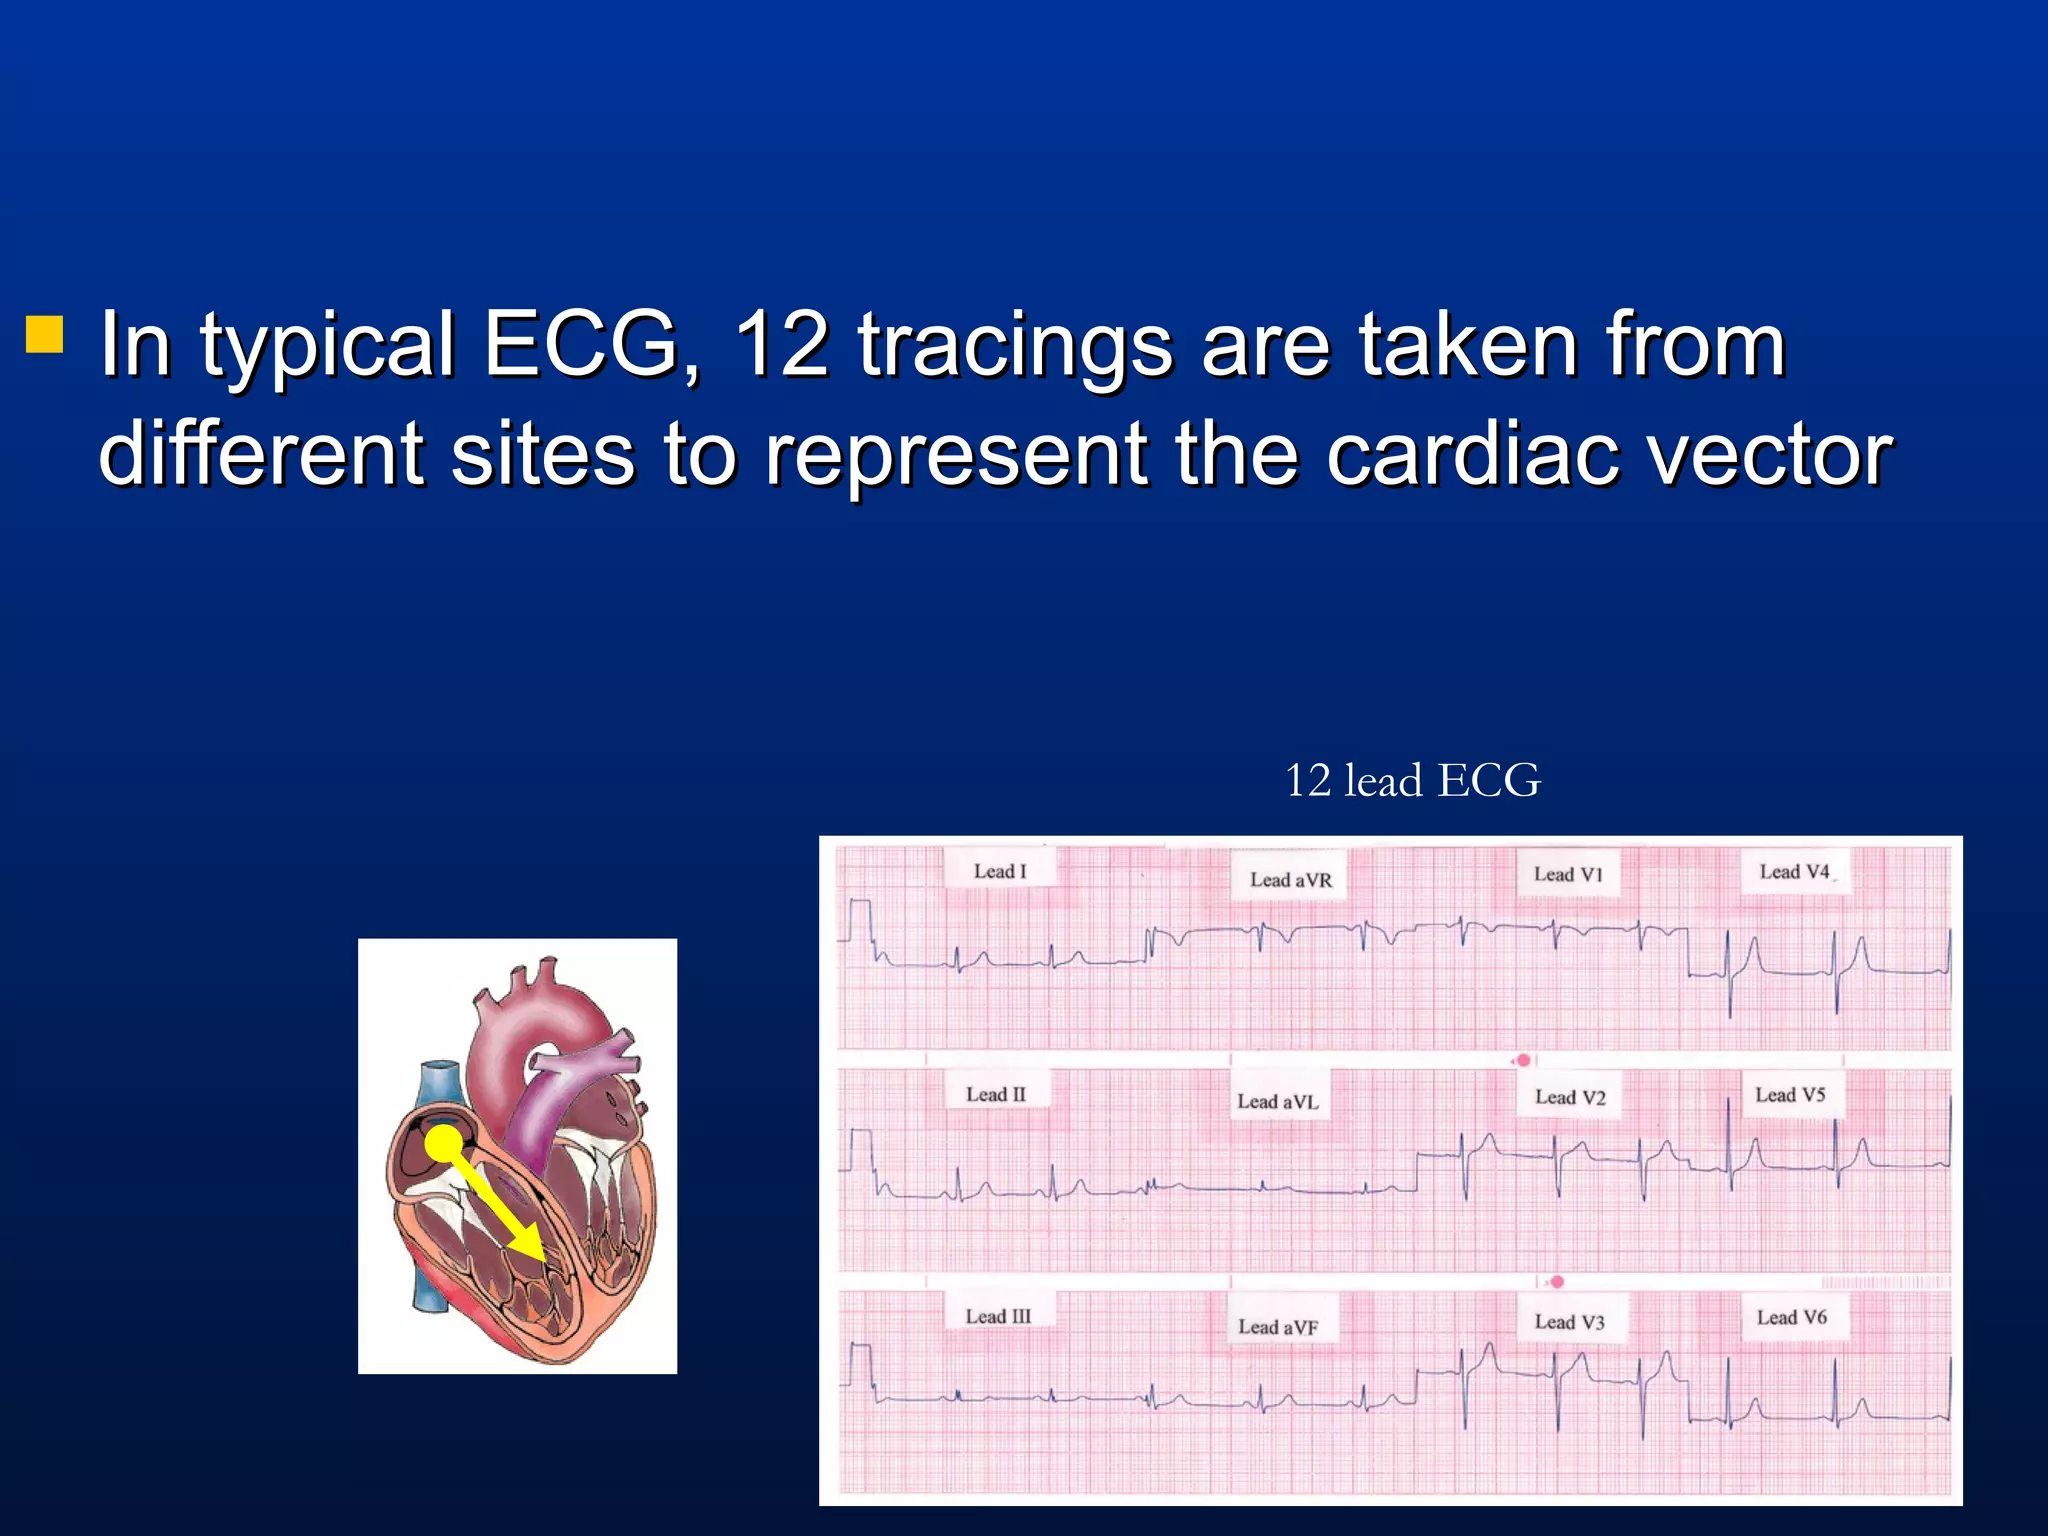


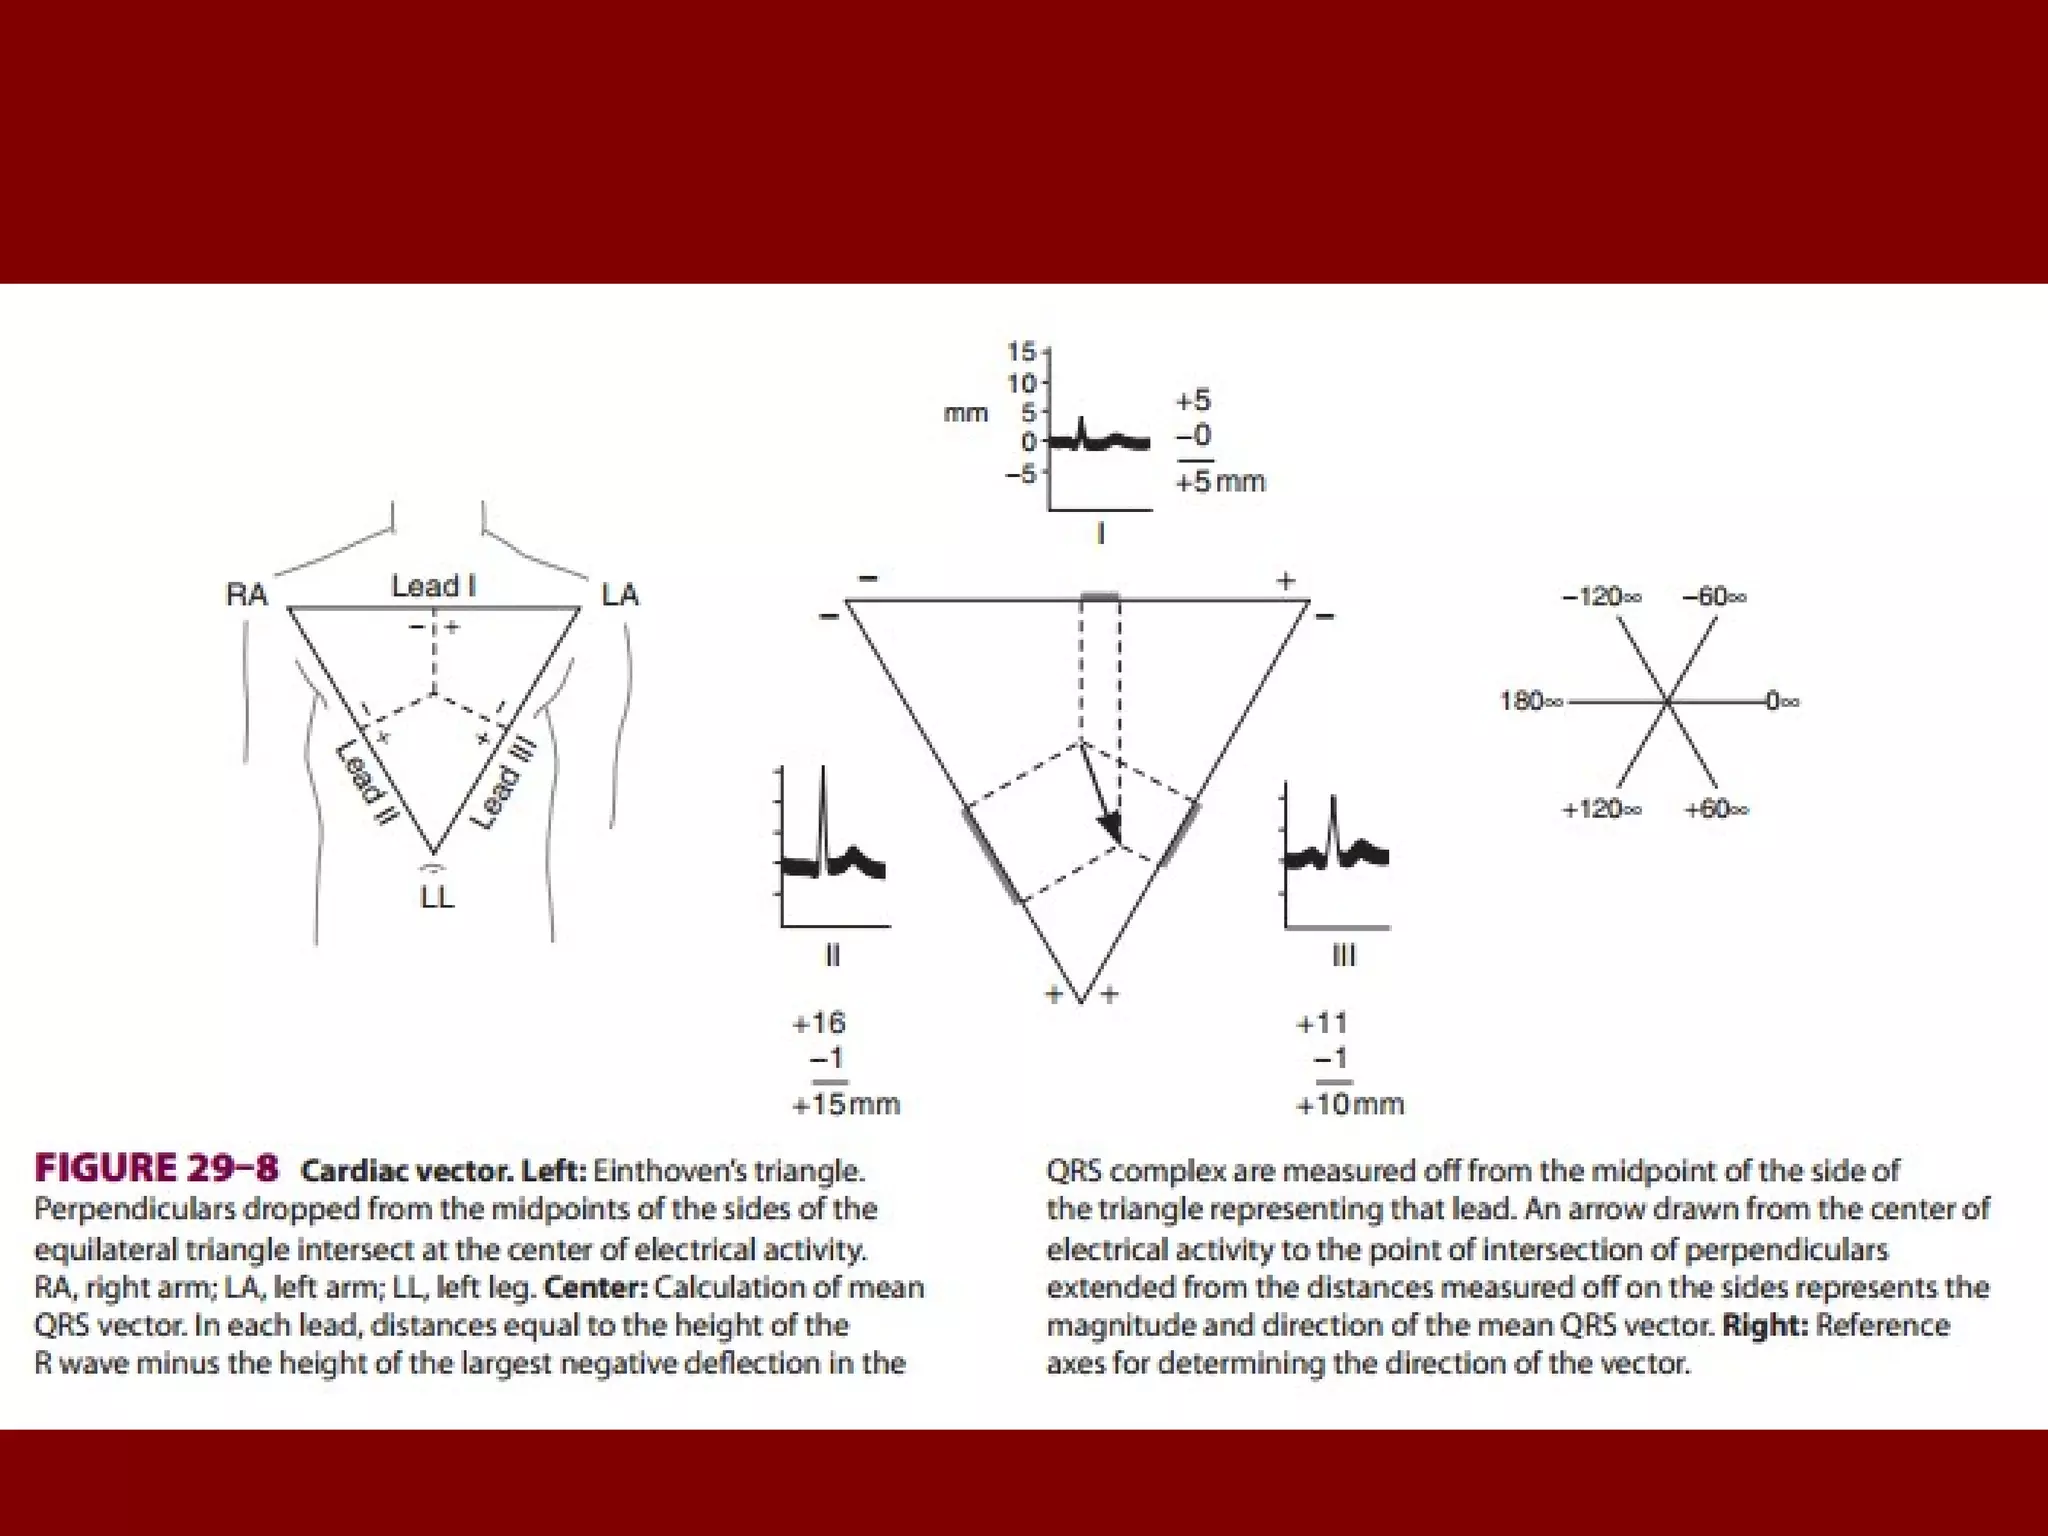
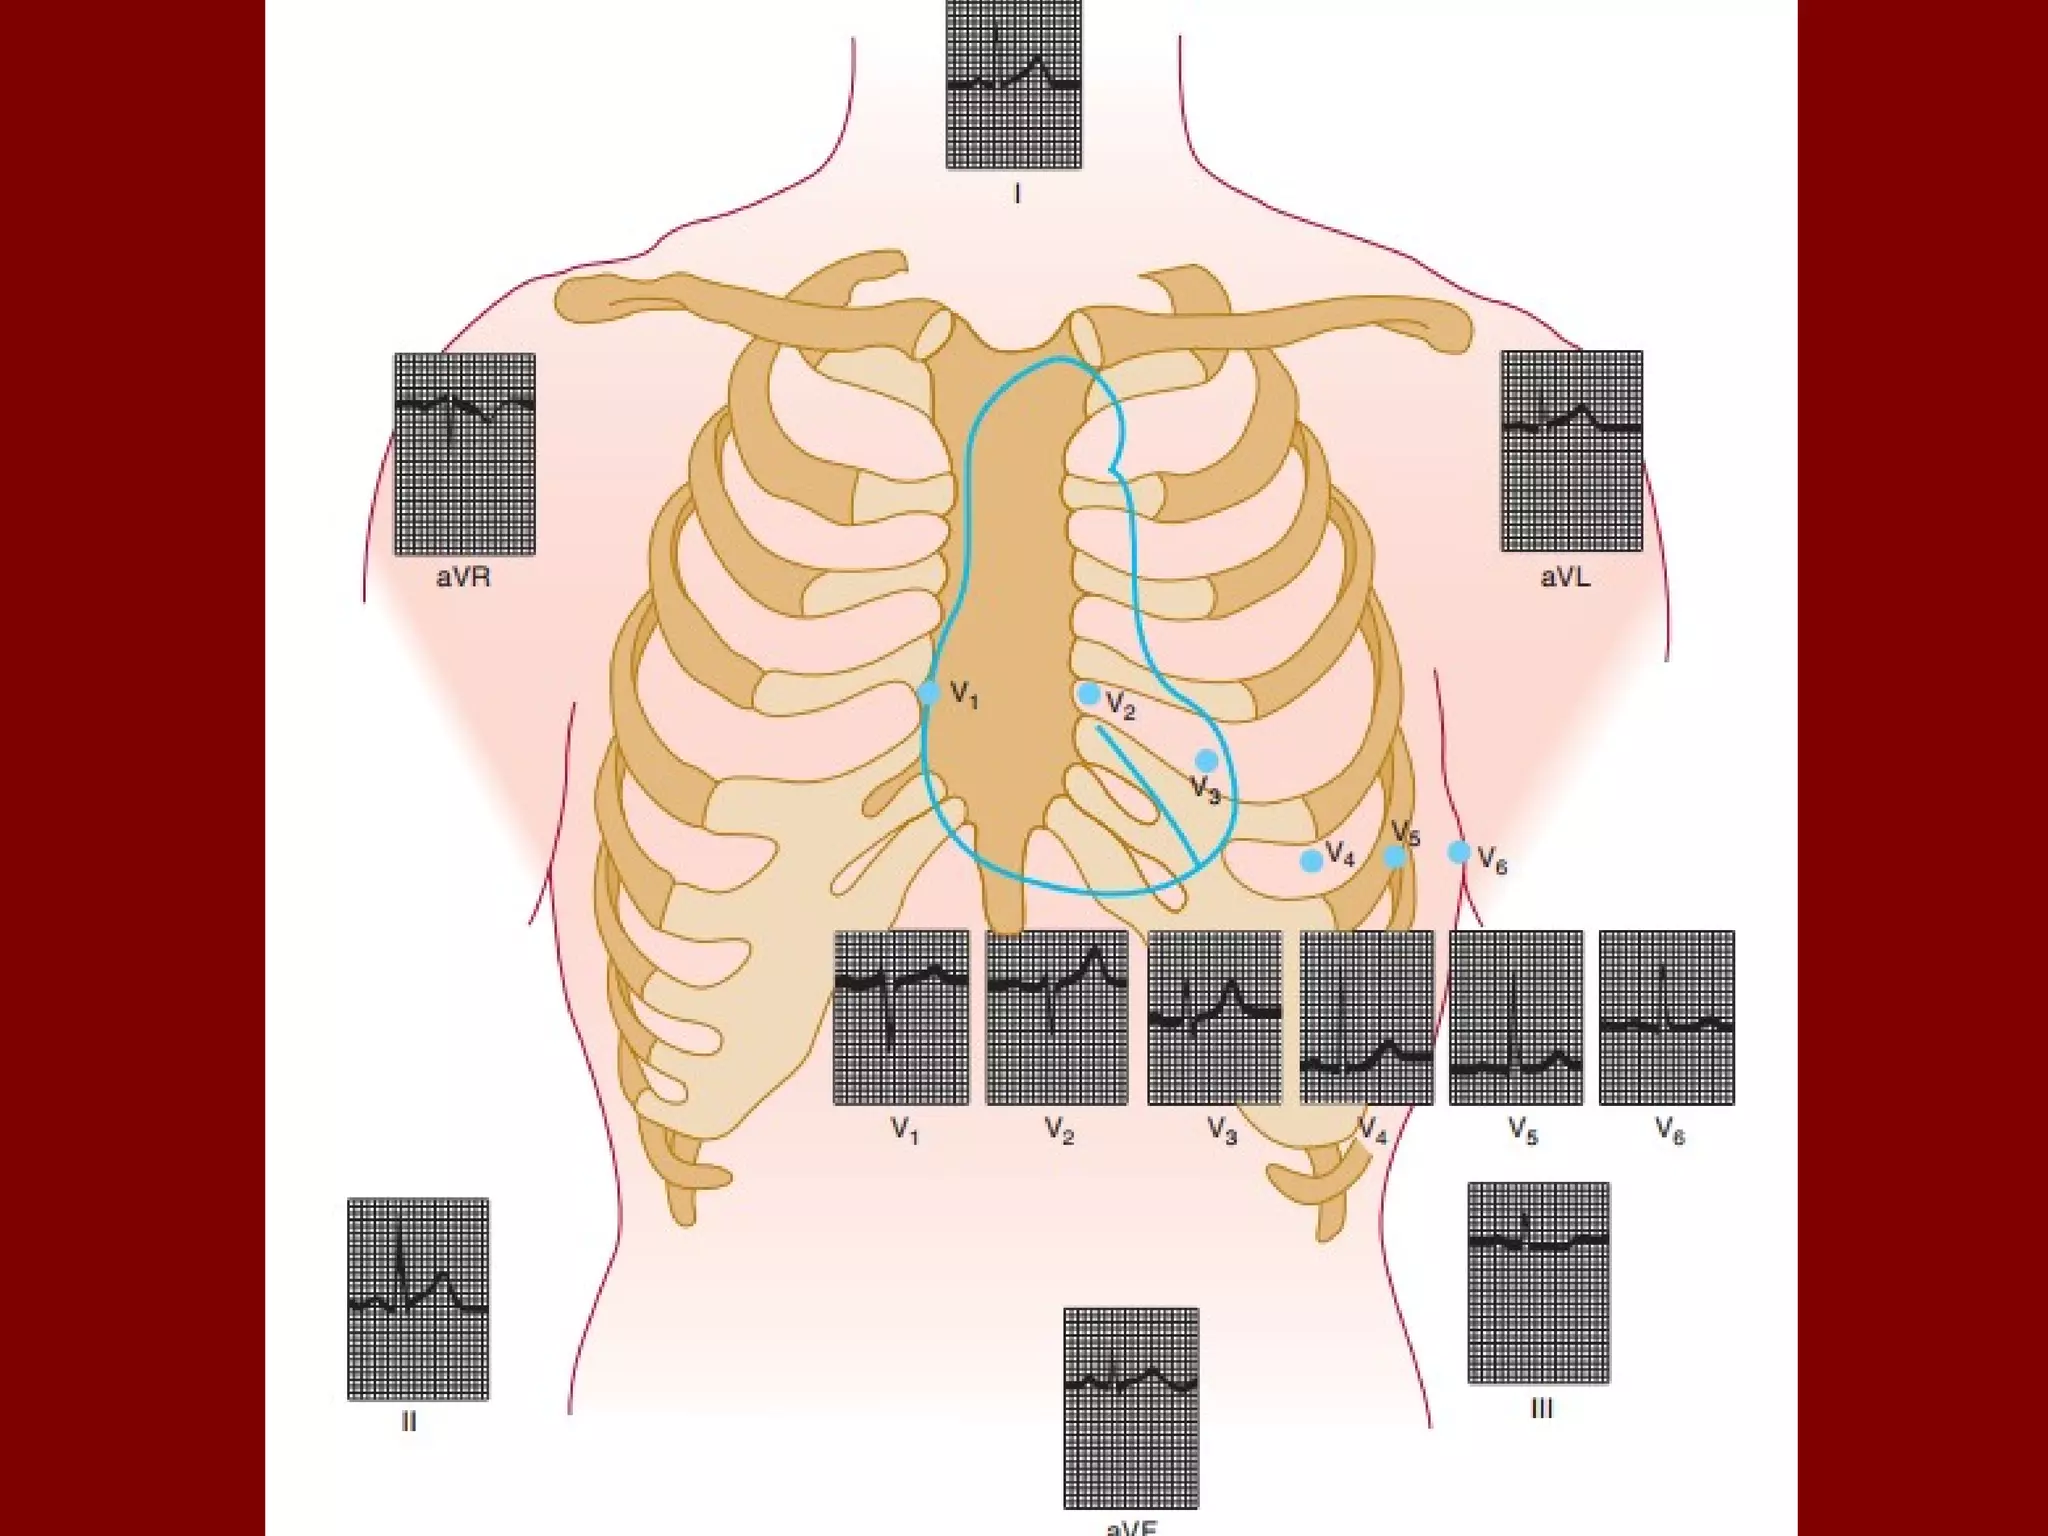
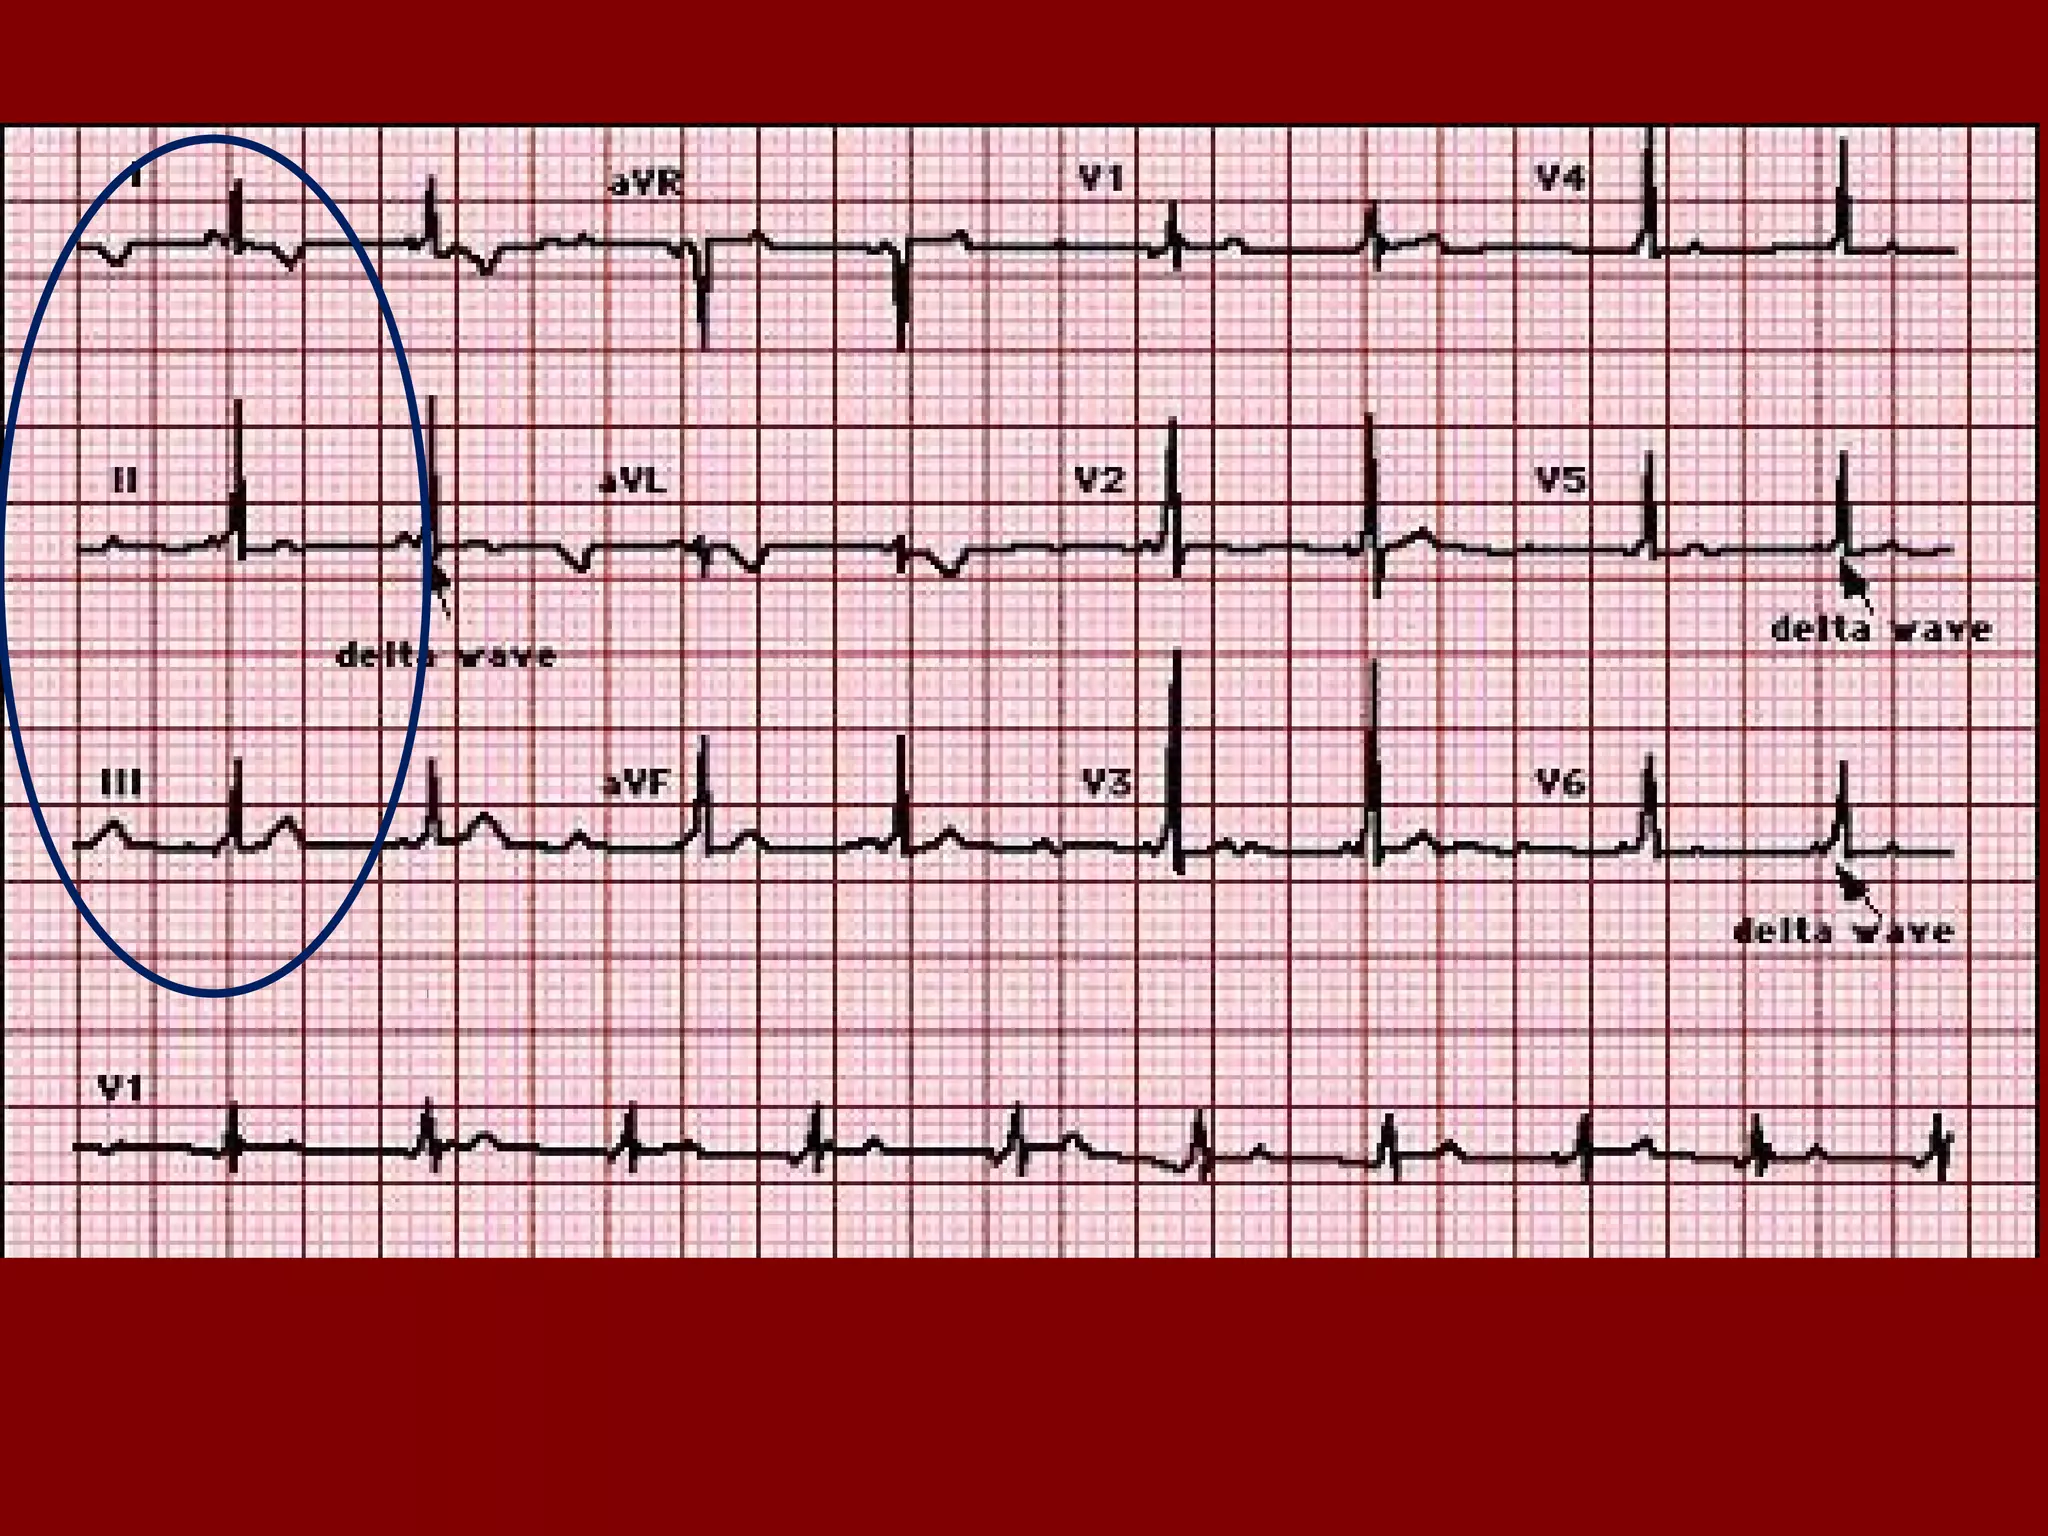
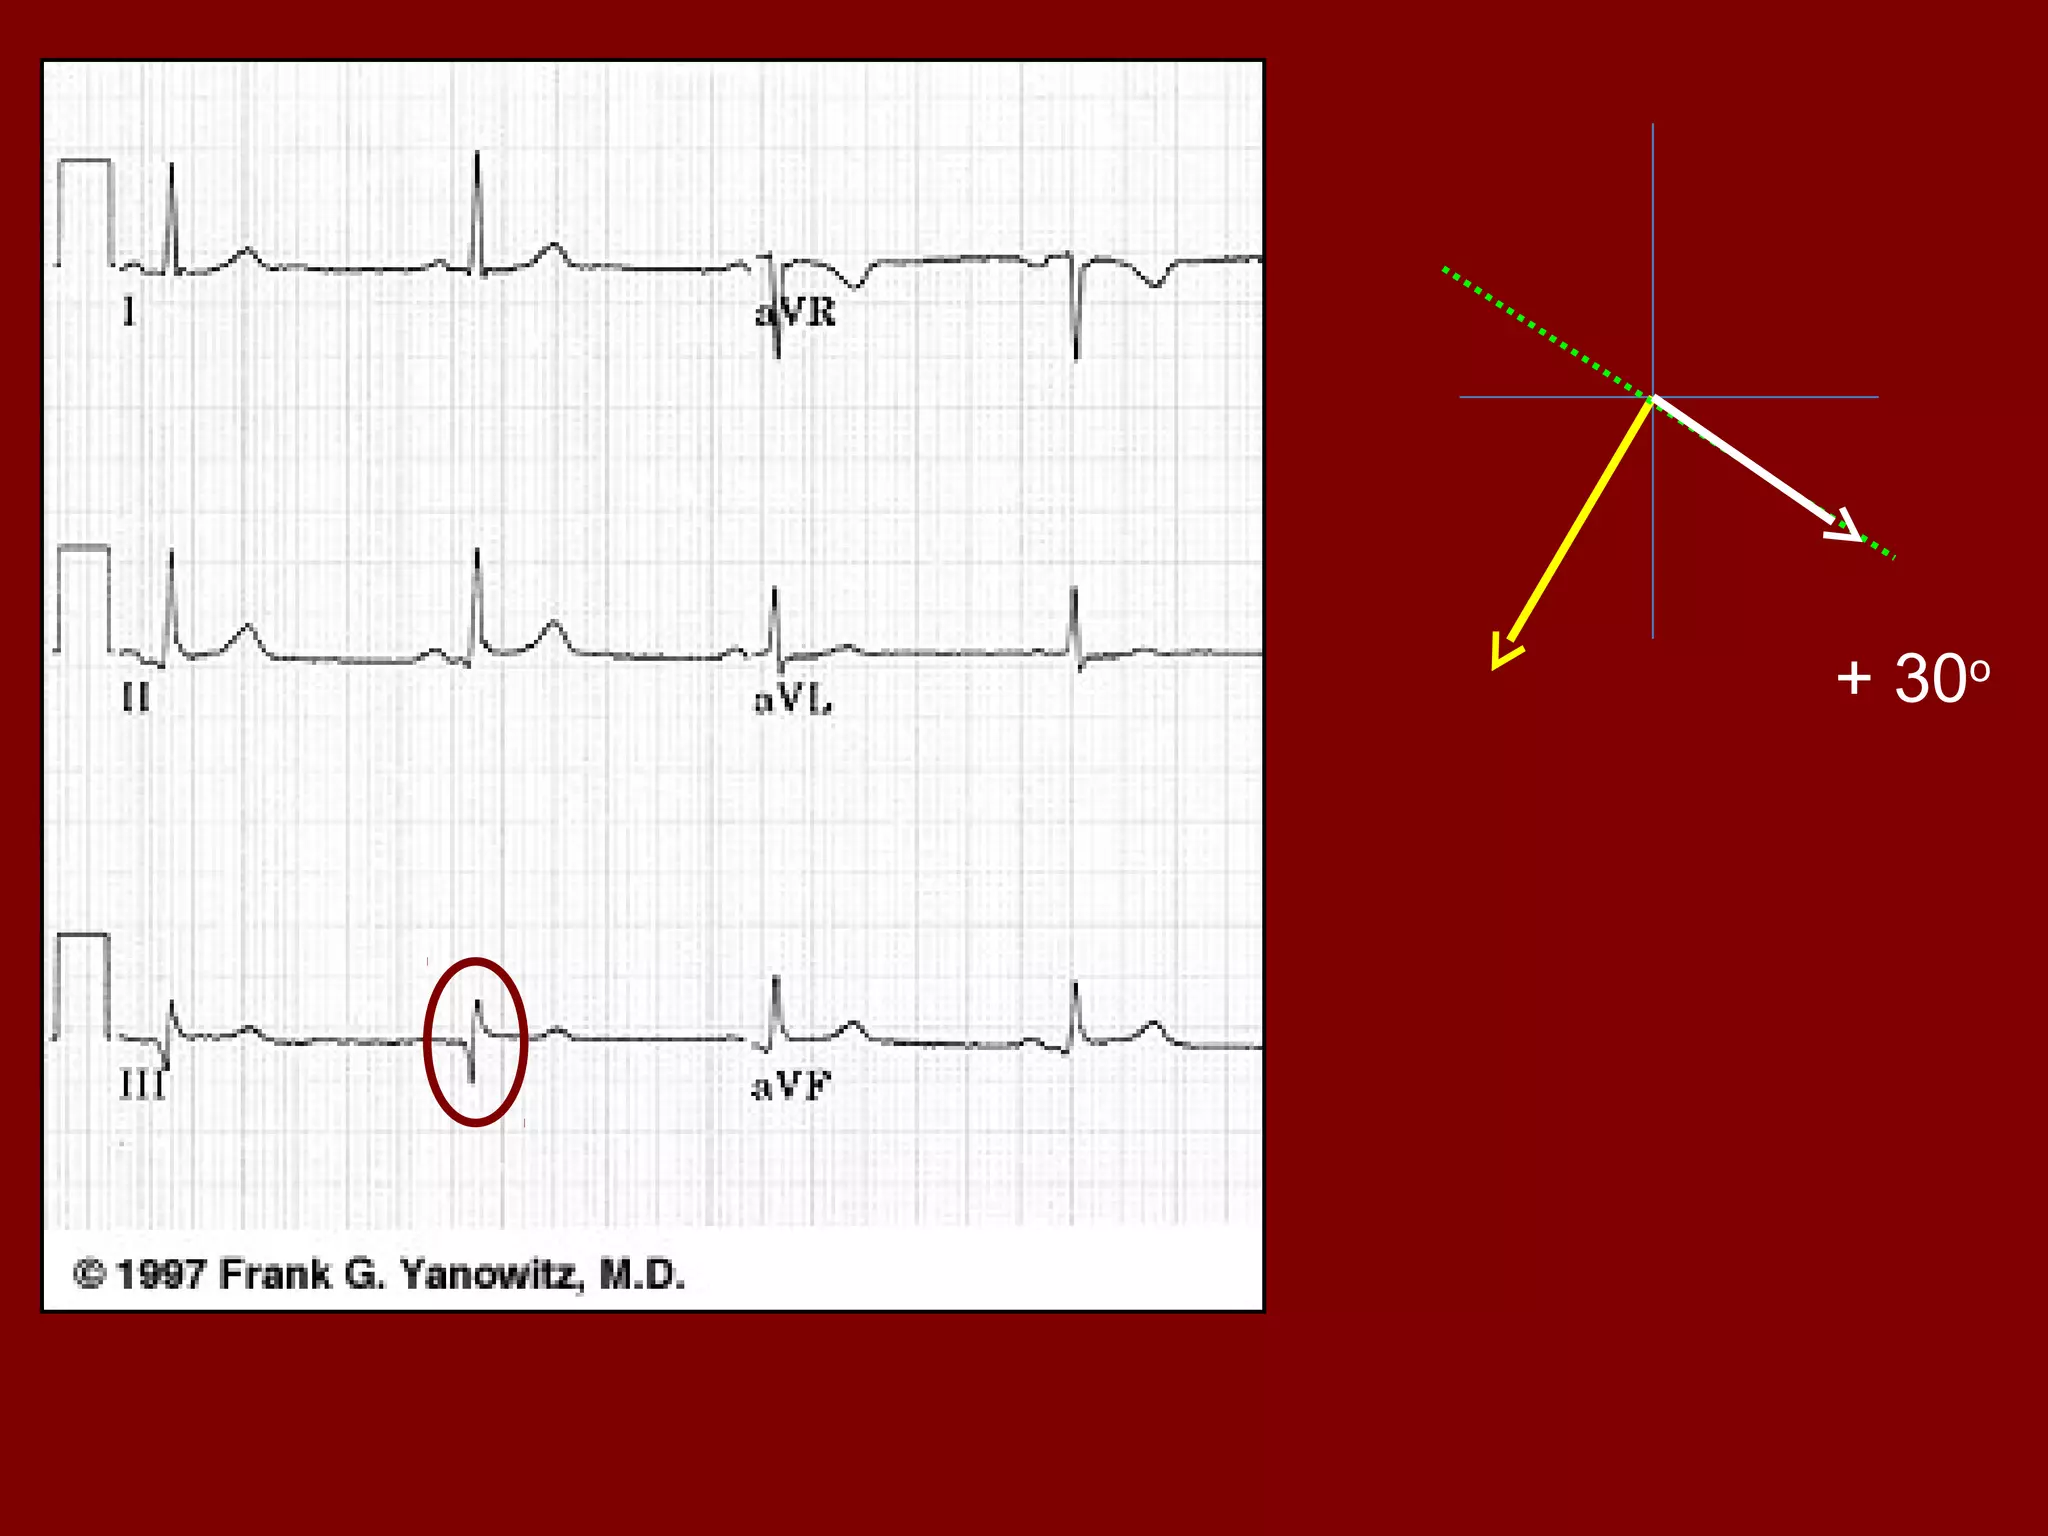
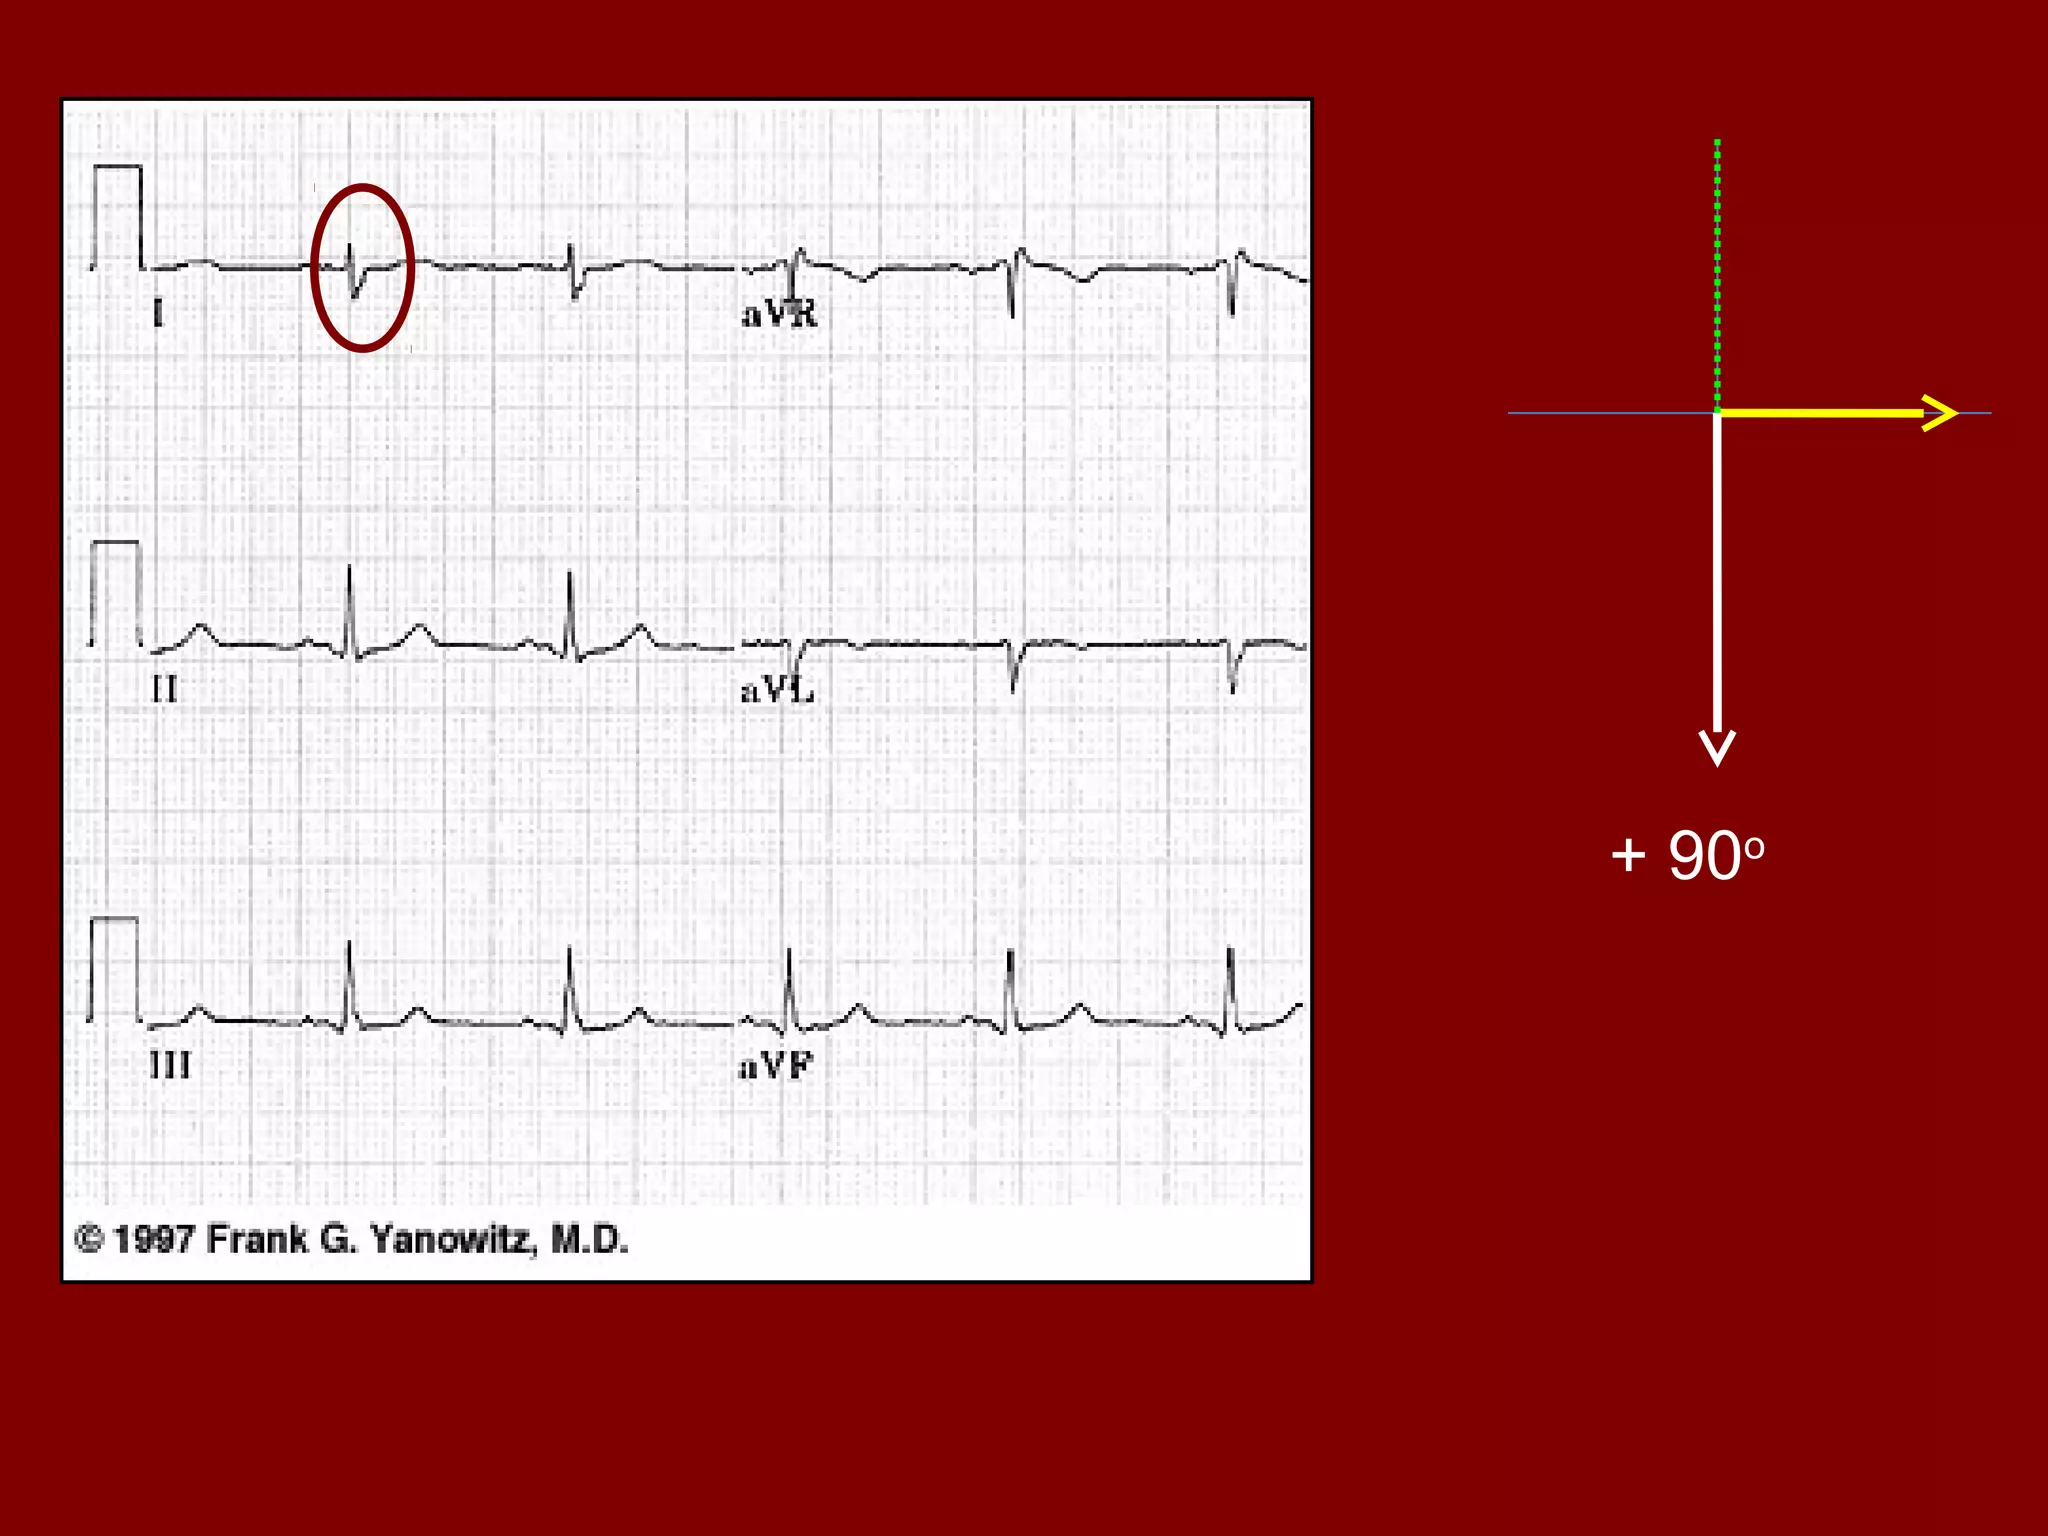

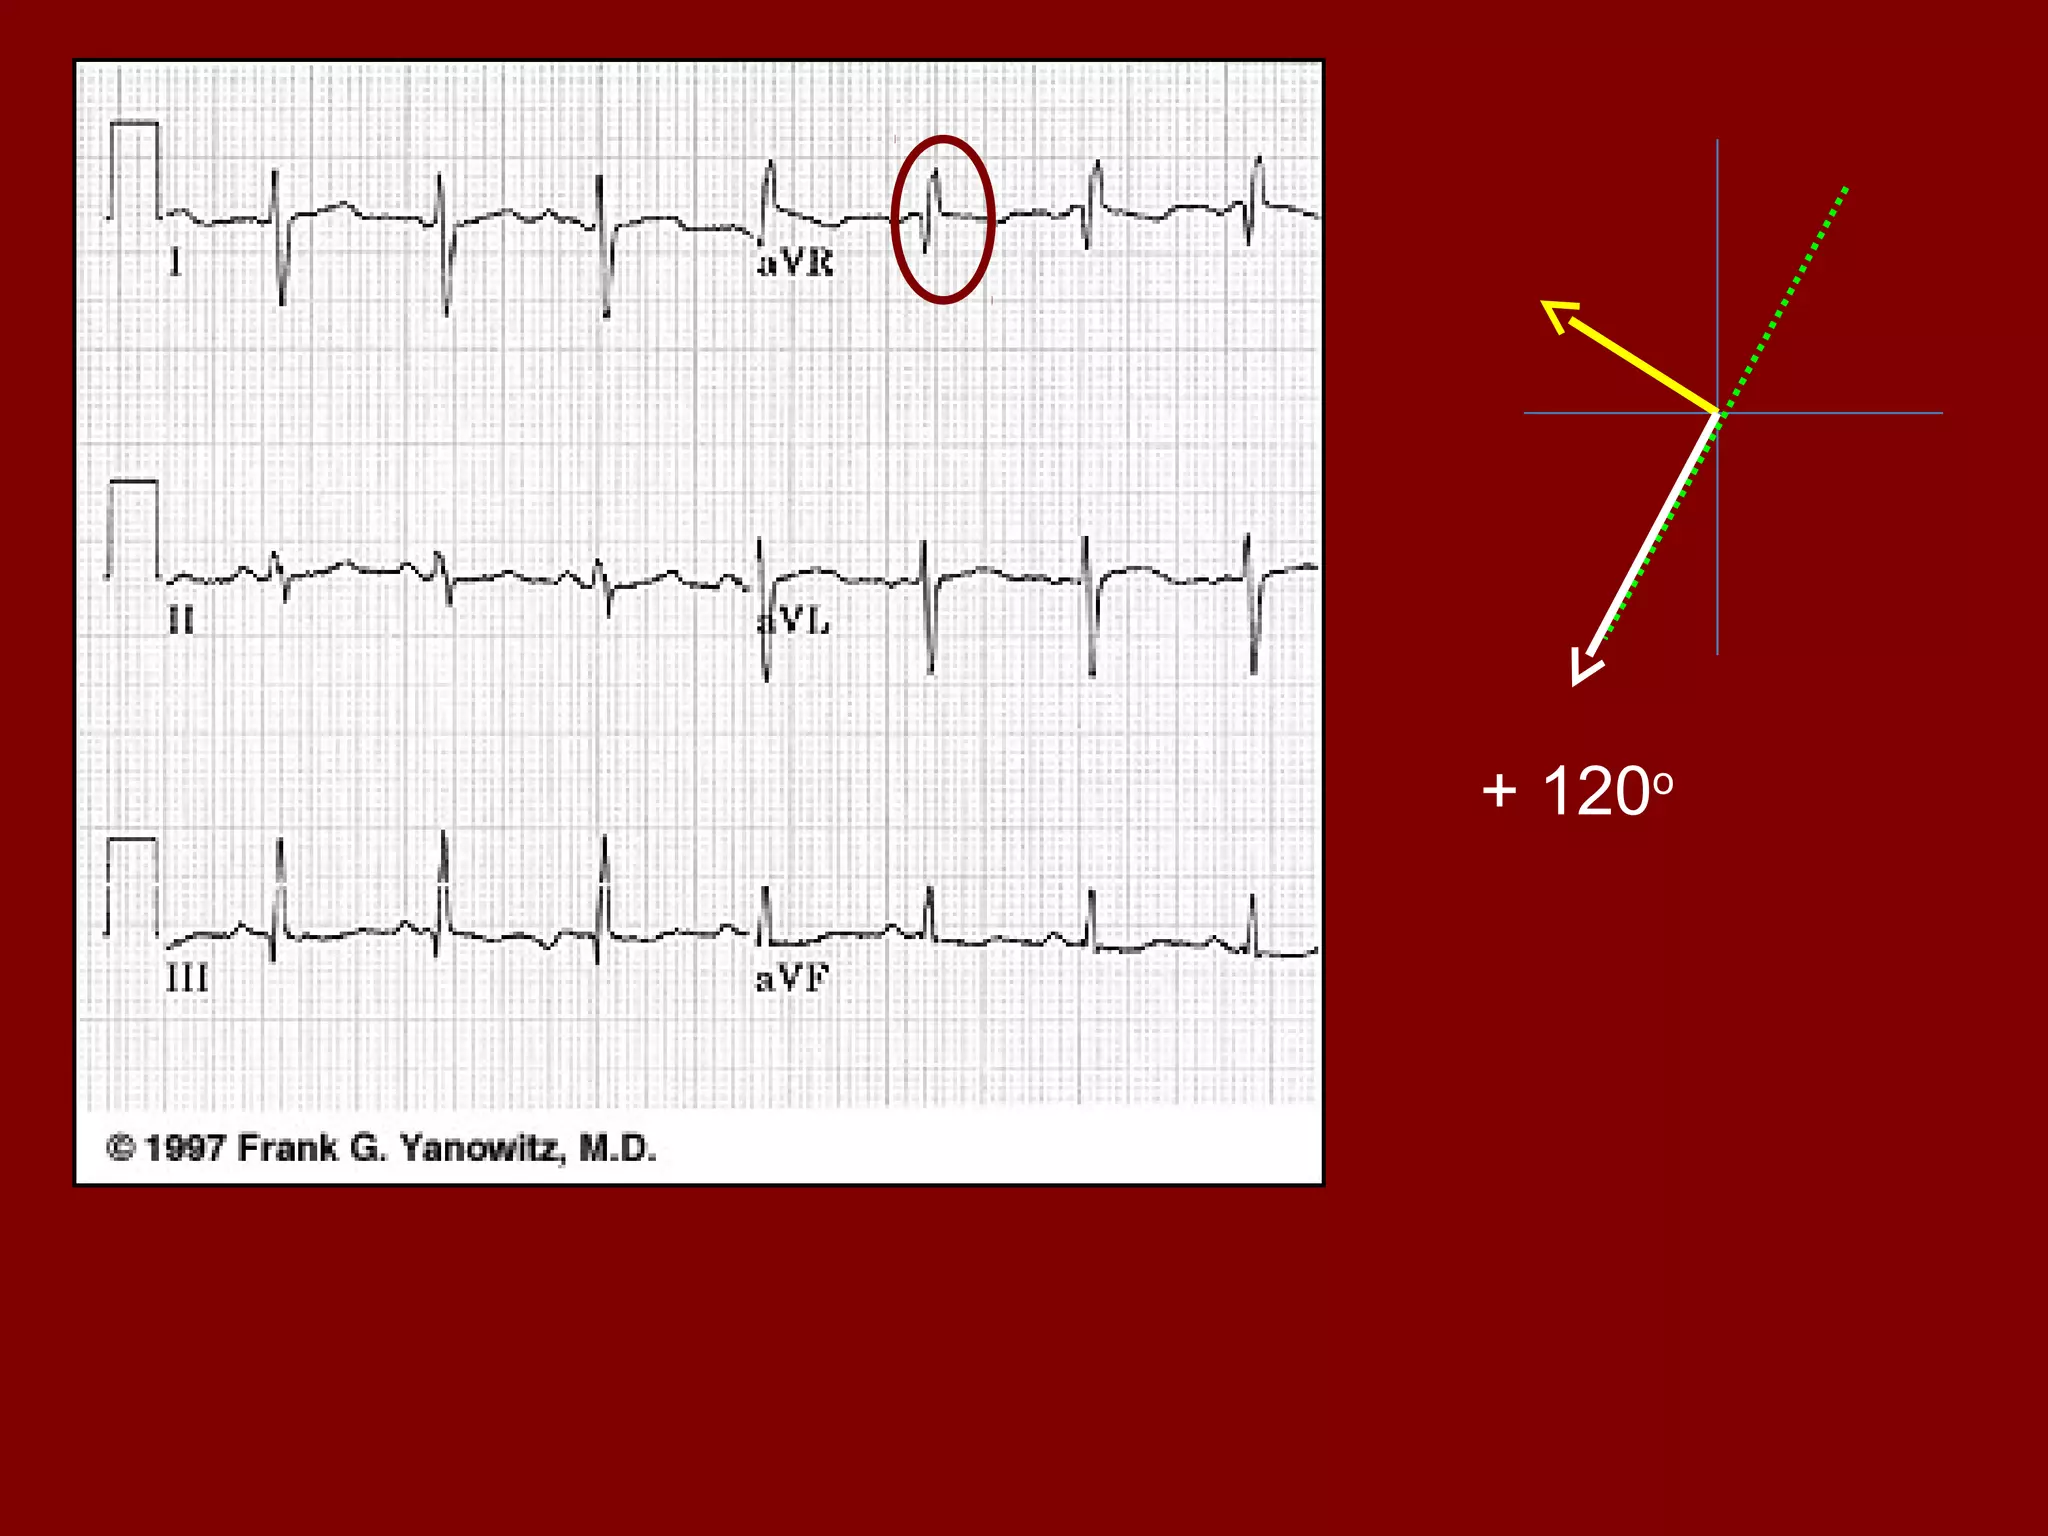


The document discusses electrocardiography (ECG), including its objectives, principles, and how it is used to analyze cardiac electrical activity. An ECG records from electrodes on the body and displays the P, QRS, and T waves representing atrial and ventricular depolarization and repolarization. The timing and amplitudes of the waves provide information on heart rate, rhythm, and conduction. Analysis of 12-lead ECGs can identify normal sinus rhythm as well as arrhythmias and conduction abnormalities associated with cardiac conditions.


![ECG [electrocardiogram].pptx](https://cdn.slidesharecdn.com/ss_thumbnails/ecgelectrocardiogram-220416062706-thumbnail.jpg?width=640&height=640&fit=bounds)


