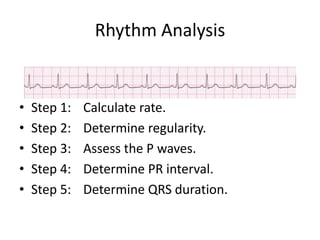
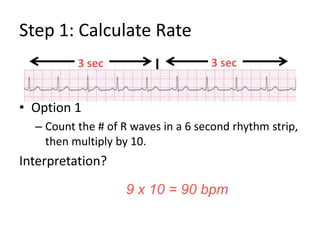
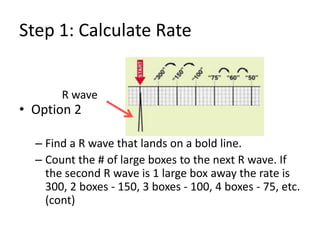
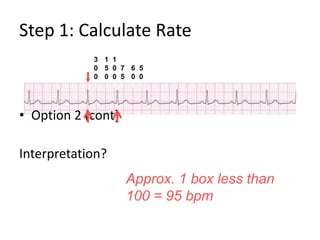
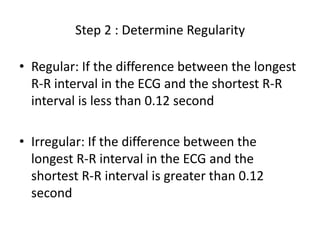
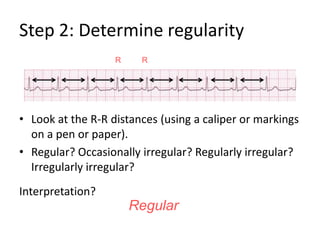
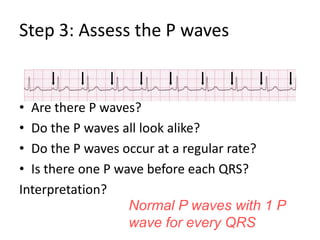
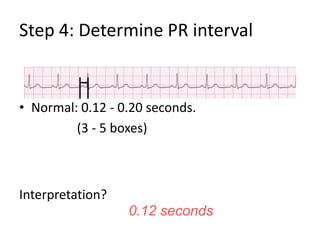
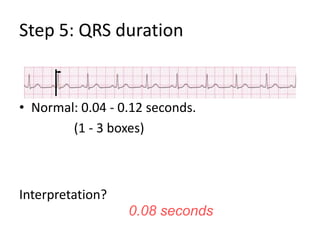
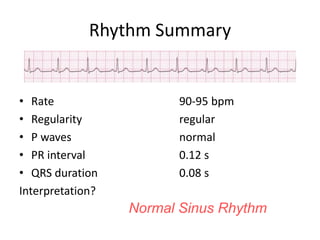
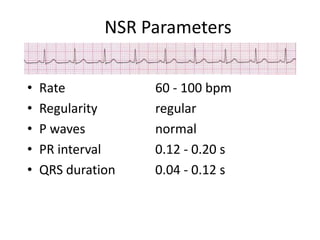
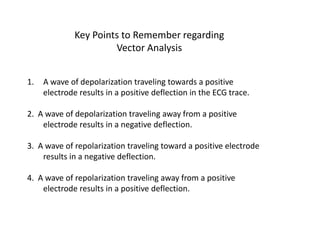
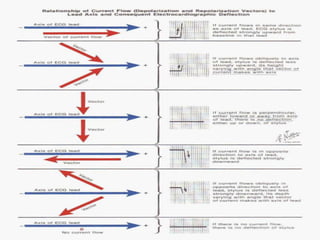
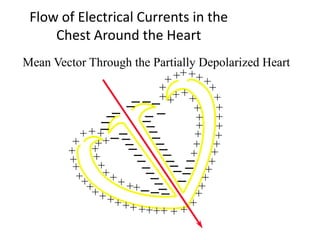
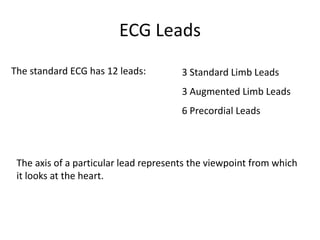
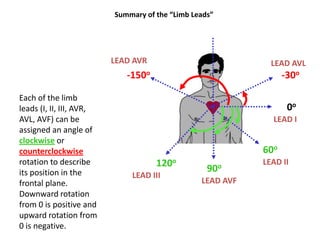
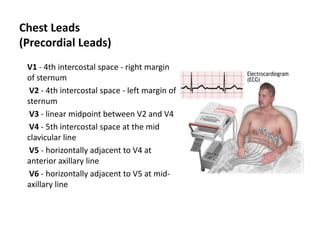
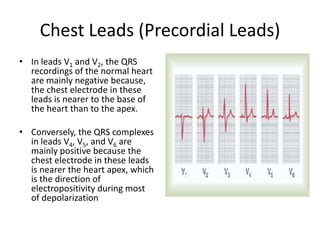
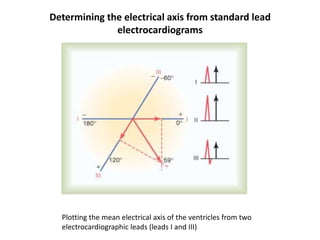
How to Analyze a Rhythm
Rhythm AnalysisStep 1:	Calculate rate.Step 2:	Determine regularity.Step 3:	Assess the P waves.Step 4:	Determine PR interval.Step 5:	Determine QRS duration.
Step 1: Calculate RateOption 1Count the # of R waves in a 6 second rhythm strip, then multiply by 10.Interpretation?3 sec3 sec9 x 10 = 90 bpm
Step 1: Calculate RateOption 2 Find a R wave that lands on a bold line.Count the # of large boxes to the next R wave. If the second R wave is 1 large box away the rate is 300, 2 boxes - 150, 3 boxes - 100, 4 boxes - 75, etc.  (cont)R wave
Step 1: Calculate RateOption 2 (cont) Interpretation?300150100 75 60 50Approx. 1 box less than 100 = 95 bpm
Step 2 : Determine RegularityRegular: If the difference between the longest R-R interval in the ECG and the shortest R-R interval is less than 0.12 secondIrregular: If the difference between the longest R-R interval in the ECG and the shortest R-R interval is greater than 0.12 second
Step 2: Determine regularityLook at the R-R distances (using a caliper or markings on a pen or paper).Regular? Occasionally irregular? Regularly irregular? Irregularly irregular?Interpretation?RRRegular
Step 3: Assess the P wavesAre there P waves?Do the P waves all look alike?Do the P waves occur at a regular rate?Is there one P wave before each QRS?Interpretation?Normal P waves with 1 P wave for every QRS
Step 4: Determine PR intervalNormal: 0.12 - 0.20 seconds.		        (3 - 5 boxes)Interpretation?0.12 seconds
Step 5: QRS durationNormal: 0.04 - 0.12 seconds.                 (1 - 3 boxes)Interpretation?0.08 seconds
Rhythm SummaryRate				90-95 bpm	Regularity				regularP waves				normalPR interval			0.12 sQRS duration			0.08 sInterpretation?Normal Sinus Rhythm
NSR ParametersRate			60 - 100 bpm	Regularity		regularP waves			normalPR interval		0.12 - 0.20 sQRS duration		0.04 - 0.12 s
Generation of the Electrocardiogram
Key Points to Remember regarding Vector AnalysisA wave of depolarization traveling towards a positive electrode results in a positive deflection in the ECG trace.2.  A wave of depolarization traveling away from a positive electrode results in a negative deflection.3.  A wave of repolarization traveling toward a positive electrode results in a negative deflection.4.  A wave of repolarization traveling away from a positive electrode results in a positive deflection.
Atrial Depolarization and the Inscription of the P-waveSA nodeAV nodeDelay (no electrical activity) before the beginning of ventricular depolarization due to AV node function090
Ventricular Depolarization and the Inscription of the QRS complex
Ventricular Repolarization and the Inscription of the T-wave
Flow of Electrical Currents in the Chest Around the Heart Ventricular depolarization starts at the  ventricular septum and the endocardial surfaces of the heart.The average current flows from negative to positive in the direction in the direction from the base of the heart to the apex.At the very end of depolarization the current reverses from 1/100 second and flows toward the outer walls of the ventricles near the base (S wave).
++++++++++++++++++++++++++++++++++++++++++++++++++++++++++++++++Flow of Electrical Currents in the Chest Around the HeartMean Vector Through the Partially Depolarized Heart_______________________________________
ECG leads and their AxisThe ECG is measured by placing skin electrodes on the body surface at different locations and connecting these electrode in different configurations to a voltage amplifier and recorder
ECG LeadsThe standard ECG has 12 leads:3 Standard Limb Leads3 Augmented Limb Leads6 Precordial LeadsThe axis of a particular lead represents the viewpoint from which it looks at the heart.
Three Bipolar Limb Leads To record limb lead I, the negative terminal of the electrocardiograph is connected to the right arm and the positive terminal to the left armTo record limb lead II, the negative terminal of the electrocardiograph is connected to the right arm and the positive terminal to the left legTo record limb lead III, the negative terminal of the electrocardiograph is connected to the left arm and the positive terminal to the left leg
Leads I, II, & III together(“Einthoven’s triangle”)
Normal Electrocardiograms Recorded from the Three Standard Bipolar Limb LeadsRecordings of the electrocardiograms in leads I, II, and III.
Augmented Unipolar Limb LeadsIn this type of recording, two of the limbs are connected through electrical resistances to the negative terminal of the electrocardiograph, and the third limb is connected to the positive terminal. When the positive terminal is on the right arm, the lead is known as the aVR leadwhen on the left arm, the aVL lead and when on the left leg, the aVF lead
Summary of the “Limb Leads”LEAD AVRLEAD AVL-30o-150oEach of the limb leads (I, II, III, AVR, AVL, AVF) can be assigned an angle of clockwise or counterclockwise rotation to describe its position in the frontal plane.  Downward rotation from 0 is positive and upward rotation from 0 is negative.0oLEAD I60oLEAD II120o90oLEAD IIILEAD AVF
Chest Leads (Precordial Leads)V1 - 4th intercostal space - right margin of sternumV2 - 4th intercostal space - left margin of sternumV3 - linear midpoint between V2 and V4V4 - 5th intercostal space at the mid clavicular lineV5 - horizontally adjacent to V4 at anterior axillary lineV6 - horizontally adjacent to V5 at mid- axillary line
Chest Leads (Precordial Leads)In leads V1 and V2, the QRS recordings of the normal heart are mainly negative because, the chest electrode in these leads is nearer to the base of the heart than to the apex.Conversely, the QRS complexes in leads V4, V5, and V6 are mainly positive because the chest electrode in these leads is nearer the heart apex, which is the direction of electropositivity during most of depolarization
Determining the electrical axis from standard lead electrocardiogramsPlotting the mean electrical axis of the ventricles from two electrocardiographic leads (leads I and III)
Left axis deviation in a hypertensive heart (hypertrophic left ventricle)
High-voltage electrocardiogram in congenital pulmonary valve stenosis with right ventricular hypertrophy. Intense right axis deviation and a slightly prolonged QRS complex also are seen

Lec18(cvs)

  • 1.
  • 2.
    Rhythm AnalysisStep 1: Calculaterate.Step 2: Determine regularity.Step 3: Assess the P waves.Step 4: Determine PR interval.Step 5: Determine QRS duration.
  • 3.
    Step 1: CalculateRateOption 1Count the # of R waves in a 6 second rhythm strip, then multiply by 10.Interpretation?3 sec3 sec9 x 10 = 90 bpm
  • 4.
    Step 1: CalculateRateOption 2 Find a R wave that lands on a bold line.Count the # of large boxes to the next R wave. If the second R wave is 1 large box away the rate is 300, 2 boxes - 150, 3 boxes - 100, 4 boxes - 75, etc. (cont)R wave
  • 5.
    Step 1: CalculateRateOption 2 (cont) Interpretation?300150100 75 60 50Approx. 1 box less than 100 = 95 bpm
  • 6.
    Step 2 :Determine RegularityRegular: If the difference between the longest R-R interval in the ECG and the shortest R-R interval is less than 0.12 secondIrregular: If the difference between the longest R-R interval in the ECG and the shortest R-R interval is greater than 0.12 second
  • 7.
    Step 2: DetermineregularityLook at the R-R distances (using a caliper or markings on a pen or paper).Regular? Occasionally irregular? Regularly irregular? Irregularly irregular?Interpretation?RRRegular
  • 8.
    Step 3: Assessthe P wavesAre there P waves?Do the P waves all look alike?Do the P waves occur at a regular rate?Is there one P wave before each QRS?Interpretation?Normal P waves with 1 P wave for every QRS
  • 9.
    Step 4: DeterminePR intervalNormal: 0.12 - 0.20 seconds. (3 - 5 boxes)Interpretation?0.12 seconds
  • 10.
    Step 5: QRSdurationNormal: 0.04 - 0.12 seconds. (1 - 3 boxes)Interpretation?0.08 seconds
  • 11.
    Rhythm SummaryRate 90-95 bpm Regularity regularPwaves normalPR interval 0.12 sQRS duration 0.08 sInterpretation?Normal Sinus Rhythm
  • 12.
    NSR ParametersRate 60 -100 bpm Regularity regularP waves normalPR interval 0.12 - 0.20 sQRS duration 0.04 - 0.12 s
  • 13.
    Generation of theElectrocardiogram
  • 14.
    Key Points toRemember regarding Vector AnalysisA wave of depolarization traveling towards a positive electrode results in a positive deflection in the ECG trace.2. A wave of depolarization traveling away from a positive electrode results in a negative deflection.3. A wave of repolarization traveling toward a positive electrode results in a negative deflection.4. A wave of repolarization traveling away from a positive electrode results in a positive deflection.
  • 15.
    Atrial Depolarization andthe Inscription of the P-waveSA nodeAV nodeDelay (no electrical activity) before the beginning of ventricular depolarization due to AV node function090
  • 16.
    Ventricular Depolarization andthe Inscription of the QRS complex
  • 17.
    Ventricular Repolarization andthe Inscription of the T-wave
  • 18.
    Flow of ElectricalCurrents in the Chest Around the Heart Ventricular depolarization starts at the ventricular septum and the endocardial surfaces of the heart.The average current flows from negative to positive in the direction in the direction from the base of the heart to the apex.At the very end of depolarization the current reverses from 1/100 second and flows toward the outer walls of the ventricles near the base (S wave).
  • 20.
    ++++++++++++++++++++++++++++++++++++++++++++++++++++++++++++++++Flow of ElectricalCurrents in the Chest Around the HeartMean Vector Through the Partially Depolarized Heart_______________________________________
  • 21.
    ECG leads andtheir AxisThe ECG is measured by placing skin electrodes on the body surface at different locations and connecting these electrode in different configurations to a voltage amplifier and recorder
  • 22.
    ECG LeadsThe standardECG has 12 leads:3 Standard Limb Leads3 Augmented Limb Leads6 Precordial LeadsThe axis of a particular lead represents the viewpoint from which it looks at the heart.
  • 23.
    Three Bipolar LimbLeads To record limb lead I, the negative terminal of the electrocardiograph is connected to the right arm and the positive terminal to the left armTo record limb lead II, the negative terminal of the electrocardiograph is connected to the right arm and the positive terminal to the left legTo record limb lead III, the negative terminal of the electrocardiograph is connected to the left arm and the positive terminal to the left leg
  • 24.
    Leads I, II,& III together(“Einthoven’s triangle”)
  • 25.
    Normal Electrocardiograms Recordedfrom the Three Standard Bipolar Limb LeadsRecordings of the electrocardiograms in leads I, II, and III.
  • 26.
    Augmented Unipolar LimbLeadsIn this type of recording, two of the limbs are connected through electrical resistances to the negative terminal of the electrocardiograph, and the third limb is connected to the positive terminal. When the positive terminal is on the right arm, the lead is known as the aVR leadwhen on the left arm, the aVL lead and when on the left leg, the aVF lead
  • 27.
    Summary of the“Limb Leads”LEAD AVRLEAD AVL-30o-150oEach of the limb leads (I, II, III, AVR, AVL, AVF) can be assigned an angle of clockwise or counterclockwise rotation to describe its position in the frontal plane. Downward rotation from 0 is positive and upward rotation from 0 is negative.0oLEAD I60oLEAD II120o90oLEAD IIILEAD AVF
  • 28.
    Chest Leads (PrecordialLeads)V1 - 4th intercostal space - right margin of sternumV2 - 4th intercostal space - left margin of sternumV3 - linear midpoint between V2 and V4V4 - 5th intercostal space at the mid clavicular lineV5 - horizontally adjacent to V4 at anterior axillary lineV6 - horizontally adjacent to V5 at mid- axillary line
  • 29.
    Chest Leads (PrecordialLeads)In leads V1 and V2, the QRS recordings of the normal heart are mainly negative because, the chest electrode in these leads is nearer to the base of the heart than to the apex.Conversely, the QRS complexes in leads V4, V5, and V6 are mainly positive because the chest electrode in these leads is nearer the heart apex, which is the direction of electropositivity during most of depolarization
  • 30.
    Determining the electricalaxis from standard lead electrocardiogramsPlotting the mean electrical axis of the ventricles from two electrocardiographic leads (leads I and III)
  • 31.
    Left axis deviationin a hypertensive heart (hypertrophic left ventricle)
  • 32.
    High-voltage electrocardiogram incongenital pulmonary valve stenosis with right ventricular hypertrophy. Intense right axis deviation and a slightly prolonged QRS complex also are seen