SEQUENCE ALIGNMENT
Homology vsSimilarity
Homology:
o Homology refers to the relationship between sequences that have a
common evolutionary ancestor.
o It is a qualitative measure; sequences are either homologous or not.
o Homology can be further classified into orthologs (sequences in
different species that evolved from a common ancestral gene by
speciation) and paralogs (sequences within the same species that
arose by gene duplication).
Similarity:
o Similarity refers to the degree of likeness between two sequences.
o It is a quantitative measure; sequences can have varying degrees of
similarity.
o Similarity is often measured as a percentage of identical or similar
residues (nucleotides or amino acids) in an alignment.
2.
Similarity:
o Similarity isa broader term that encompasses both identical and
similar residues.
o It considers both exact matches (identity) and conservative
substitutions, where amino acids with similar properties are aligned.
o Similarity is typically expressed as a percentage, representing the
proportion of aligned residues that are either identical or similar.
Identity:
o Identity is a more specific term that refers only to exact matches
between residues.
o It considers only those residues that are exactly the same (e.g., an
adenine (A) in one sequence aligning with an adenine (A) in the
other sequence).
o Identity is also expressed as a percentage, representing the
proportion of aligned residues that are exactly identical.
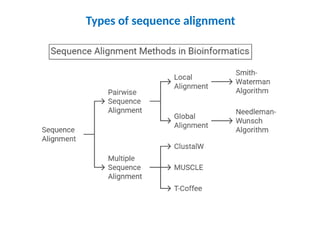
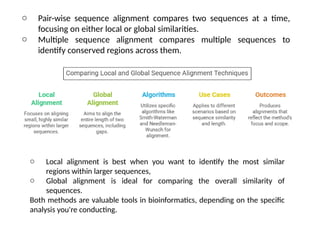
o Pair-wise sequencealignment compares two sequences at a time,
focusing on either local or global similarities.
o Multiple sequence alignment compares multiple sequences to
identify conserved regions across them.
o Local alignment is best when you want to identify the most similar
regions within larger sequences,
o Global alignment is ideal for comparing the overall similarity of
sequences.
Both methods are valuable tools in bioinformatics, depending on the specific
analysis you're conducting.
5.
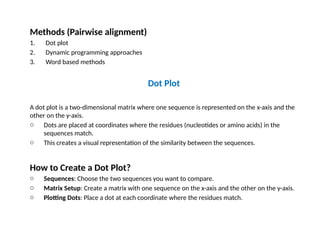
Methods (Pairwise alignment)
1.Dot plot
2. Dynamic programming approaches
3. Word based methods
Dot Plot
A dot plot is a two-dimensional matrix where one sequence is represented on the x-axis and the
other on the y-axis.
o Dots are placed at coordinates where the residues (nucleotides or amino acids) in the
sequences match.
o This creates a visual representation of the similarity between the sequences.
How to Create a Dot Plot?
o Sequences: Choose the two sequences you want to compare.
o Matrix Setup: Create a matrix with one sequence on the x-axis and the other on the y-axis.
o Plotting Dots: Place a dot at each coordinate where the residues match.
6.
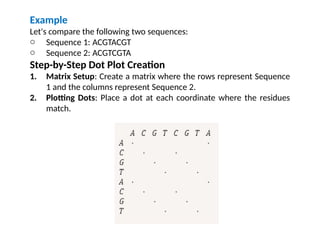
Example
Let's compare thefollowing two sequences:
o Sequence 1: ACGTACGT
o Sequence 2: ACGTCGTA
Step-by-Step Dot Plot Creation
1. Matrix Setup: Create a matrix where the rows represent Sequence
1 and the columns represent Sequence 2.
2. Plotting Dots: Place a dot at each coordinate where the residues
match.
7.
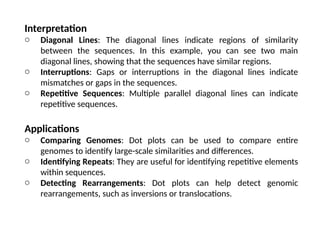
Interpretation
o Diagonal Lines:The diagonal lines indicate regions of similarity
between the sequences. In this example, you can see two main
diagonal lines, showing that the sequences have similar regions.
o Interruptions: Gaps or interruptions in the diagonal lines indicate
mismatches or gaps in the sequences.
o Repetitive Sequences: Multiple parallel diagonal lines can indicate
repetitive sequences.
Applications
o Comparing Genomes: Dot plots can be used to compare entire
genomes to identify large-scale similarities and differences.
o Identifying Repeats: They are useful for identifying repetitive elements
within sequences.
o Detecting Rearrangements: Dot plots can help detect genomic
rearrangements, such as inversions or translocations.
8.
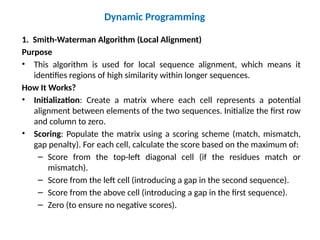
Dynamic Programming
1. Smith-WatermanAlgorithm (Local Alignment)
Purpose
• This algorithm is used for local sequence alignment, which means it
identifies regions of high similarity within longer sequences.
How It Works?
• Initialization: Create a matrix where each cell represents a potential
alignment between elements of the two sequences. Initialize the first row
and column to zero.
• Scoring: Populate the matrix using a scoring scheme (match, mismatch,
gap penalty). For each cell, calculate the score based on the maximum of:
– Score from the top-left diagonal cell (if the residues match or
mismatch).
– Score from the left cell (introducing a gap in the second sequence).
– Score from the above cell (introducing a gap in the first sequence).
– Zero (to ensure no negative scores).
9.
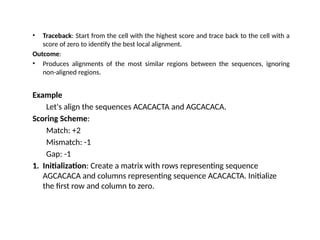
• Traceback: Startfrom the cell with the highest score and trace back to the cell with a
score of zero to identify the best local alignment.
Outcome:
• Produces alignments of the most similar regions between the sequences, ignoring
non-aligned regions.
Example
Let's align the sequences ACACACTA and AGCACACA.
Scoring Scheme:
Match: +2
Mismatch: -1
Gap: -1
1. Initialization: Create a matrix with rows representing sequence
AGCACACA and columns representing sequence ACACACTA. Initialize
the first row and column to zero.
10.
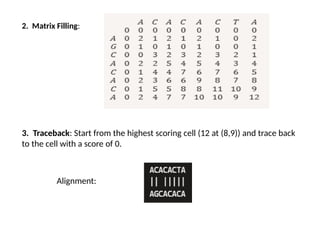
2. Matrix Filling:
3.Traceback: Start from the highest scoring cell (12 at (8,9)) and trace back
to the cell with a score of 0.
Alignment:
11.
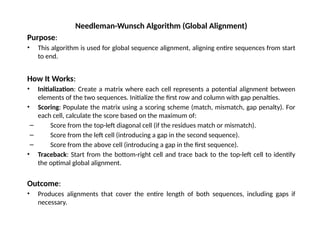
Needleman-Wunsch Algorithm (GlobalAlignment)
Purpose:
• This algorithm is used for global sequence alignment, aligning entire sequences from start
to end.
How It Works:
• Initialization: Create a matrix where each cell represents a potential alignment between
elements of the two sequences. Initialize the first row and column with gap penalties.
• Scoring: Populate the matrix using a scoring scheme (match, mismatch, gap penalty). For
each cell, calculate the score based on the maximum of:
– Score from the top-left diagonal cell (if the residues match or mismatch).
– Score from the left cell (introducing a gap in the second sequence).
– Score from the above cell (introducing a gap in the first sequence).
• Traceback: Start from the bottom-right cell and trace back to the top-left cell to identify
the optimal global alignment.
Outcome:
• Produces alignments that cover the entire length of both sequences, including gaps if
necessary.
12.
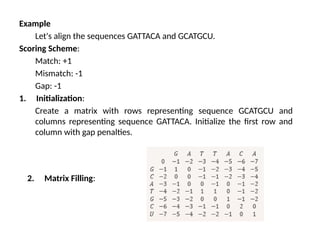
Example
Let's align thesequences GATTACA and GCATGCU.
Scoring Scheme:
Match: +1
Mismatch: -1
Gap: -1
1. Initialization:
Create a matrix with rows representing sequence GCATGCU and
columns representing sequence GATTACA. Initialize the first row and
column with gap penalties.
2. Matrix Filling:
13.
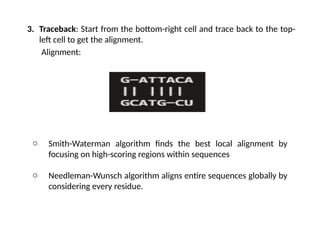
3. Traceback: Startfrom the bottom-right cell and trace back to the top-
left cell to get the alignment.
Alignment:
o Smith-Waterman algorithm finds the best local alignment by
focusing on high-scoring regions within sequences
o Needleman-Wunsch algorithm aligns entire sequences globally by
considering every residue.