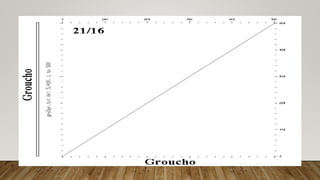
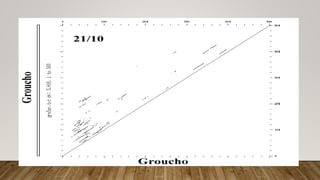
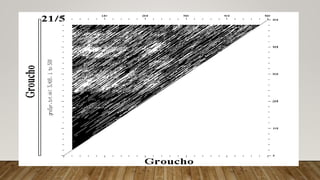
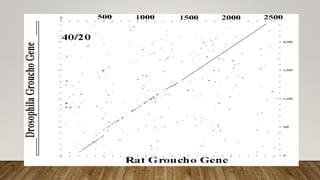
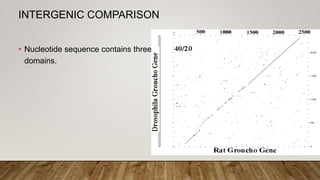
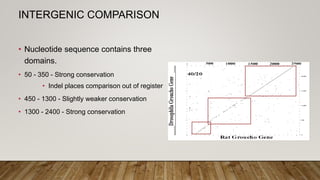
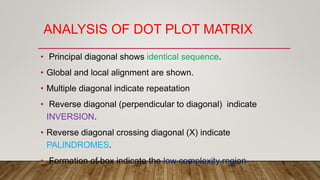
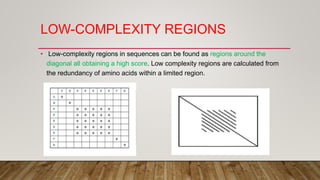
This document discusses dot plots, which are graphical methods for comparing biological sequences and identifying similar regions. It provides background on dot plots, including their history, principles, examples, interpretation, and applications. Key points covered include how dot plots represent sequences along axes and plot dots to indicate identities, different features that can be observed in dot plots like direct repeats and palindromes, and how dot plots can be used to find sequence alignments and gene locations. Limitations and different scoring schemes for dot plots are also summarized.