Dot plots are a graphical method for assessing similarity between two sequences. A dot plot is created by making a matrix of one sequence against the other and coloring in cells with identical letters. Regions of local similarity appear as diagonal lines of colored dots. The document discusses how to create dot plots between DNA and protein sequences and explains how using a sliding window threshold can filter out random matches. Pros and cons of dot plots are provided along with examples of software that can be used to generate dot plots.
Dot plots
Dr Avril Coghlan
alc@sanger.ac.uk
Note: this talk contains animations which can only be seen by
downloading and using ‘View Slide show’ in Powerpoint
2.
Dot plots
• Howcan we compare the human & Drosophila
melanogaster Eyeless protein sequences?
One method is a dotplot
• A dotplot is a graphical method for assessing
similarity
Make a matrix (table) with one row for each letter in sequence 1, & one
column for each letter in sequence 2
Colour in each cell with an identical letter in the 2 sequences
Regions of local similarity between the 2 sequences appear as diagonal
lines of coloured cells (‘dots’)
3.
eg. for sequences‘RQQEPVRSTC’ and ‘QQESGPVRST’:
Q Q E S G P V R S T Sequence 2
R
Q
Q
E
Sequence 1
P
V
R
S
T
C
Regions of local similarity between the 2 sequences appear as
diagonal lines
Some off-diagonal dots may be due to chance similarities
4.
Problem
• Make adot-plot for DNA sequences “GCATCGGC” &
“CCATCGCCATCG”. Are there regions of similarity?
5.
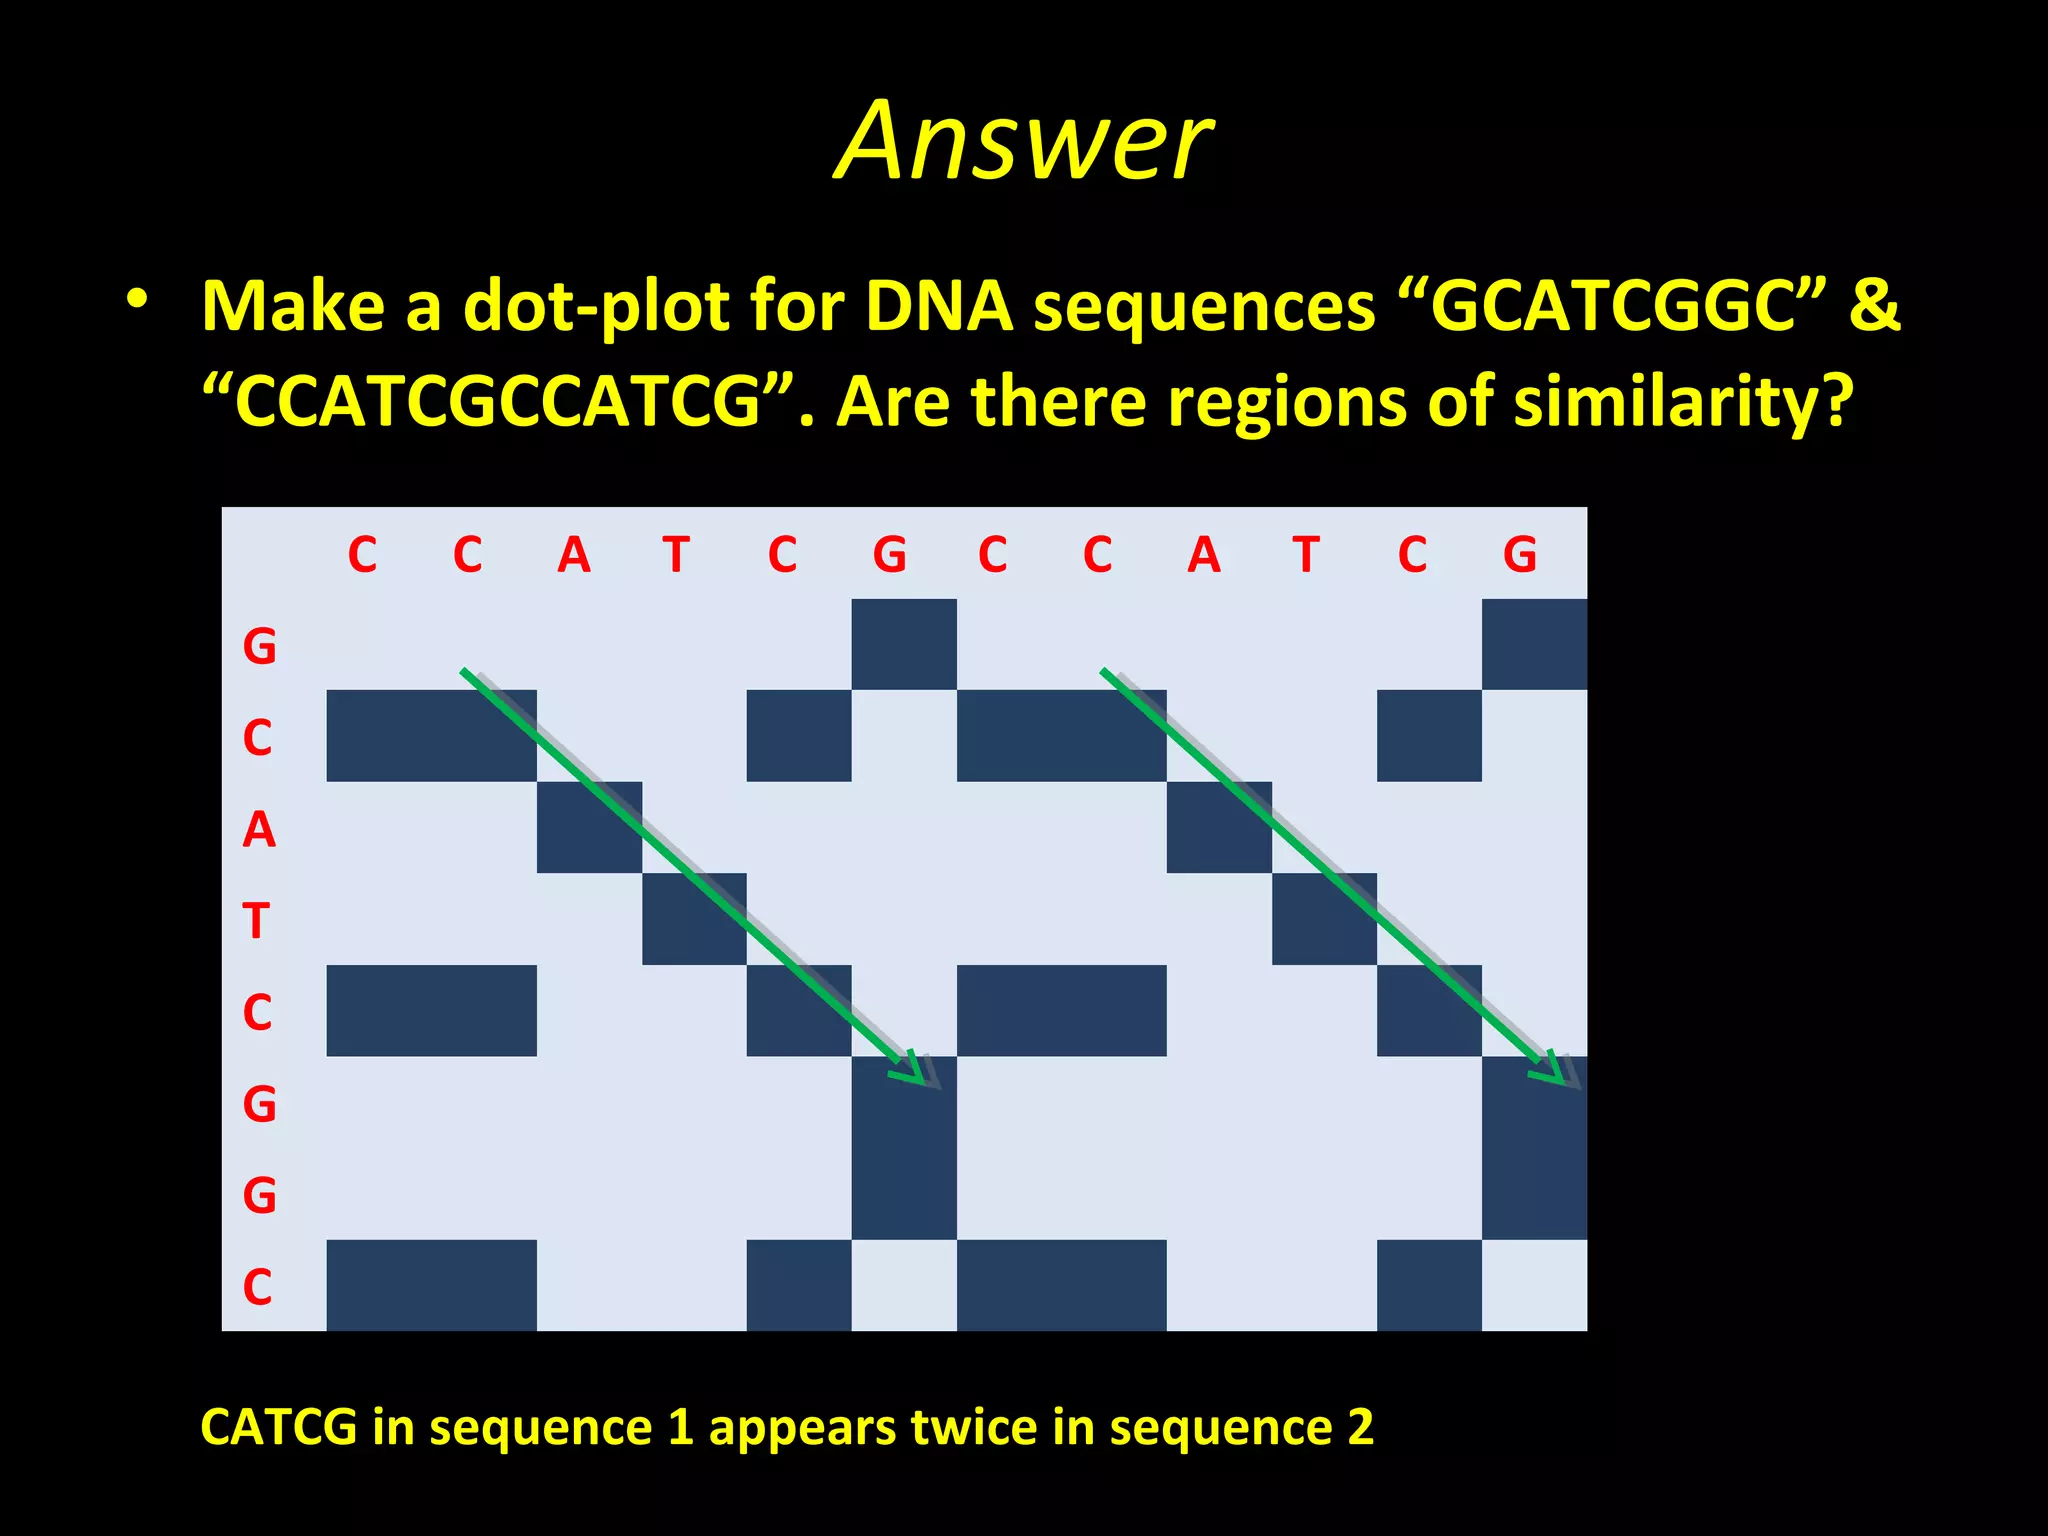
Answer
• Make adot-plot for DNA sequences “GCATCGGC” &
“CCATCGCCATCG”. Are there regions of similarity?
C C A T C G C C A T C G
G
C
A
T
C
G
G
C
CATCG in sequence 1 appears twice in sequence 2
6.
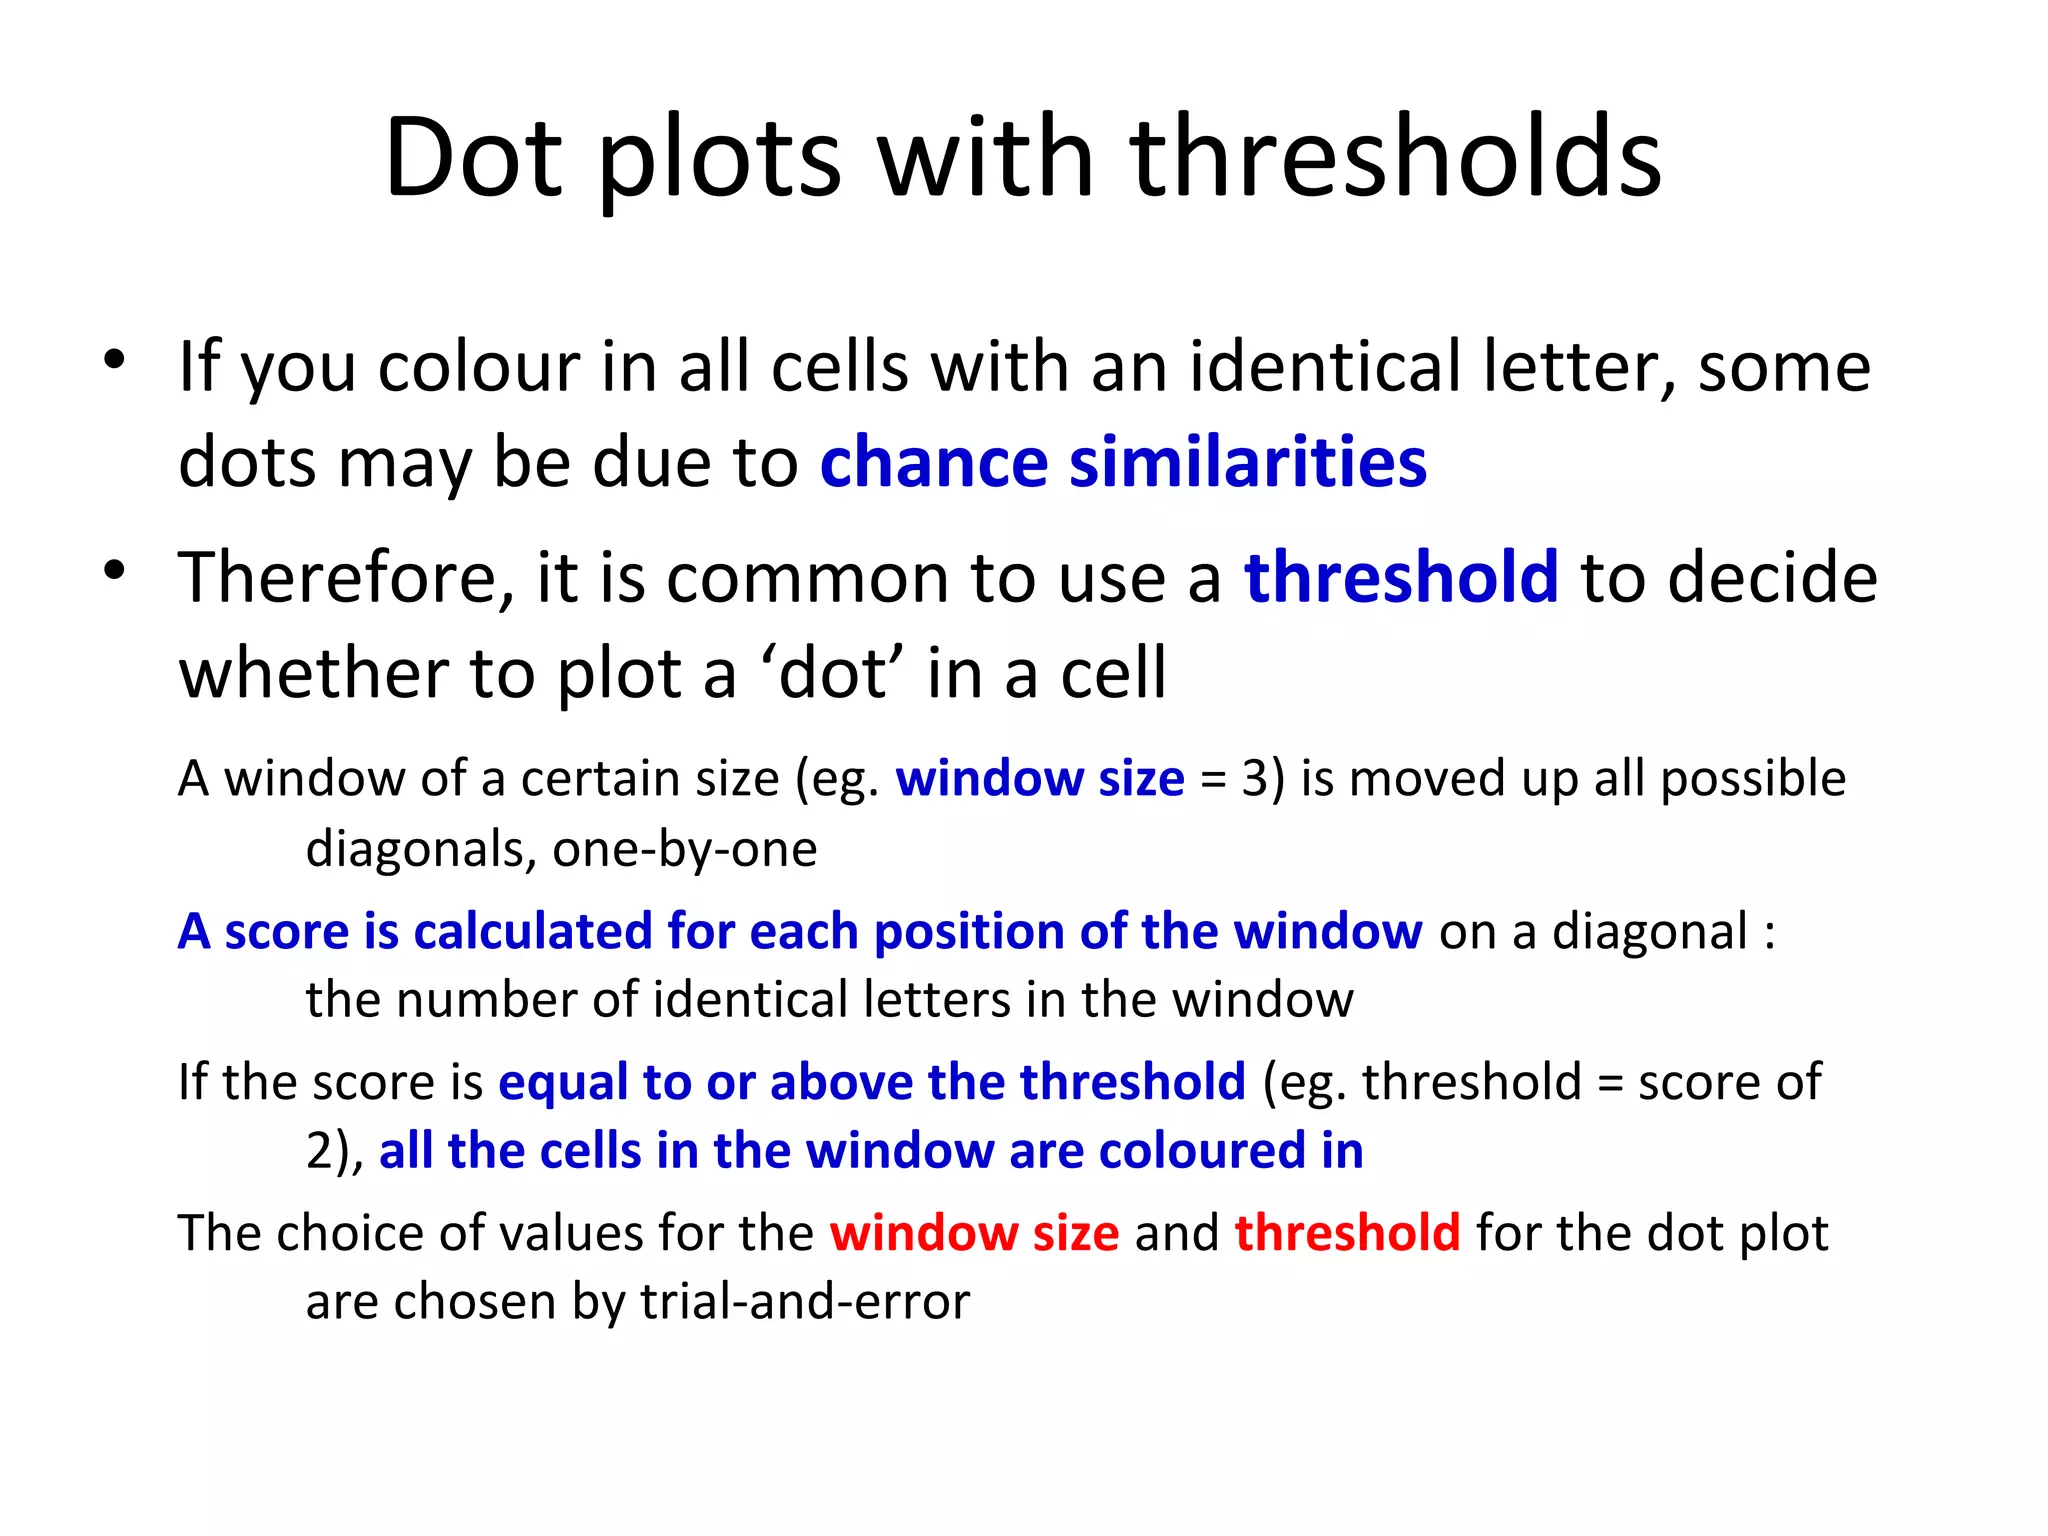
Dot plots withthresholds
• If you colour in all cells with an identical letter, some
dots may be due to chance similarities
• Therefore, it is common to use a threshold to decide
whether to plot a ‘dot’ in a cell
A window of a certain size (eg. window size = 3) is moved up all possible
diagonals, one-by-one
A score is calculated for each position of the window on a diagonal :
the number of identical letters in the window
If the score is equal to or above the threshold (eg. threshold = score of
2), all the cells in the window are coloured in
The choice of values for the window size and threshold for the dot plot
are chosen by trial-and-error
7.
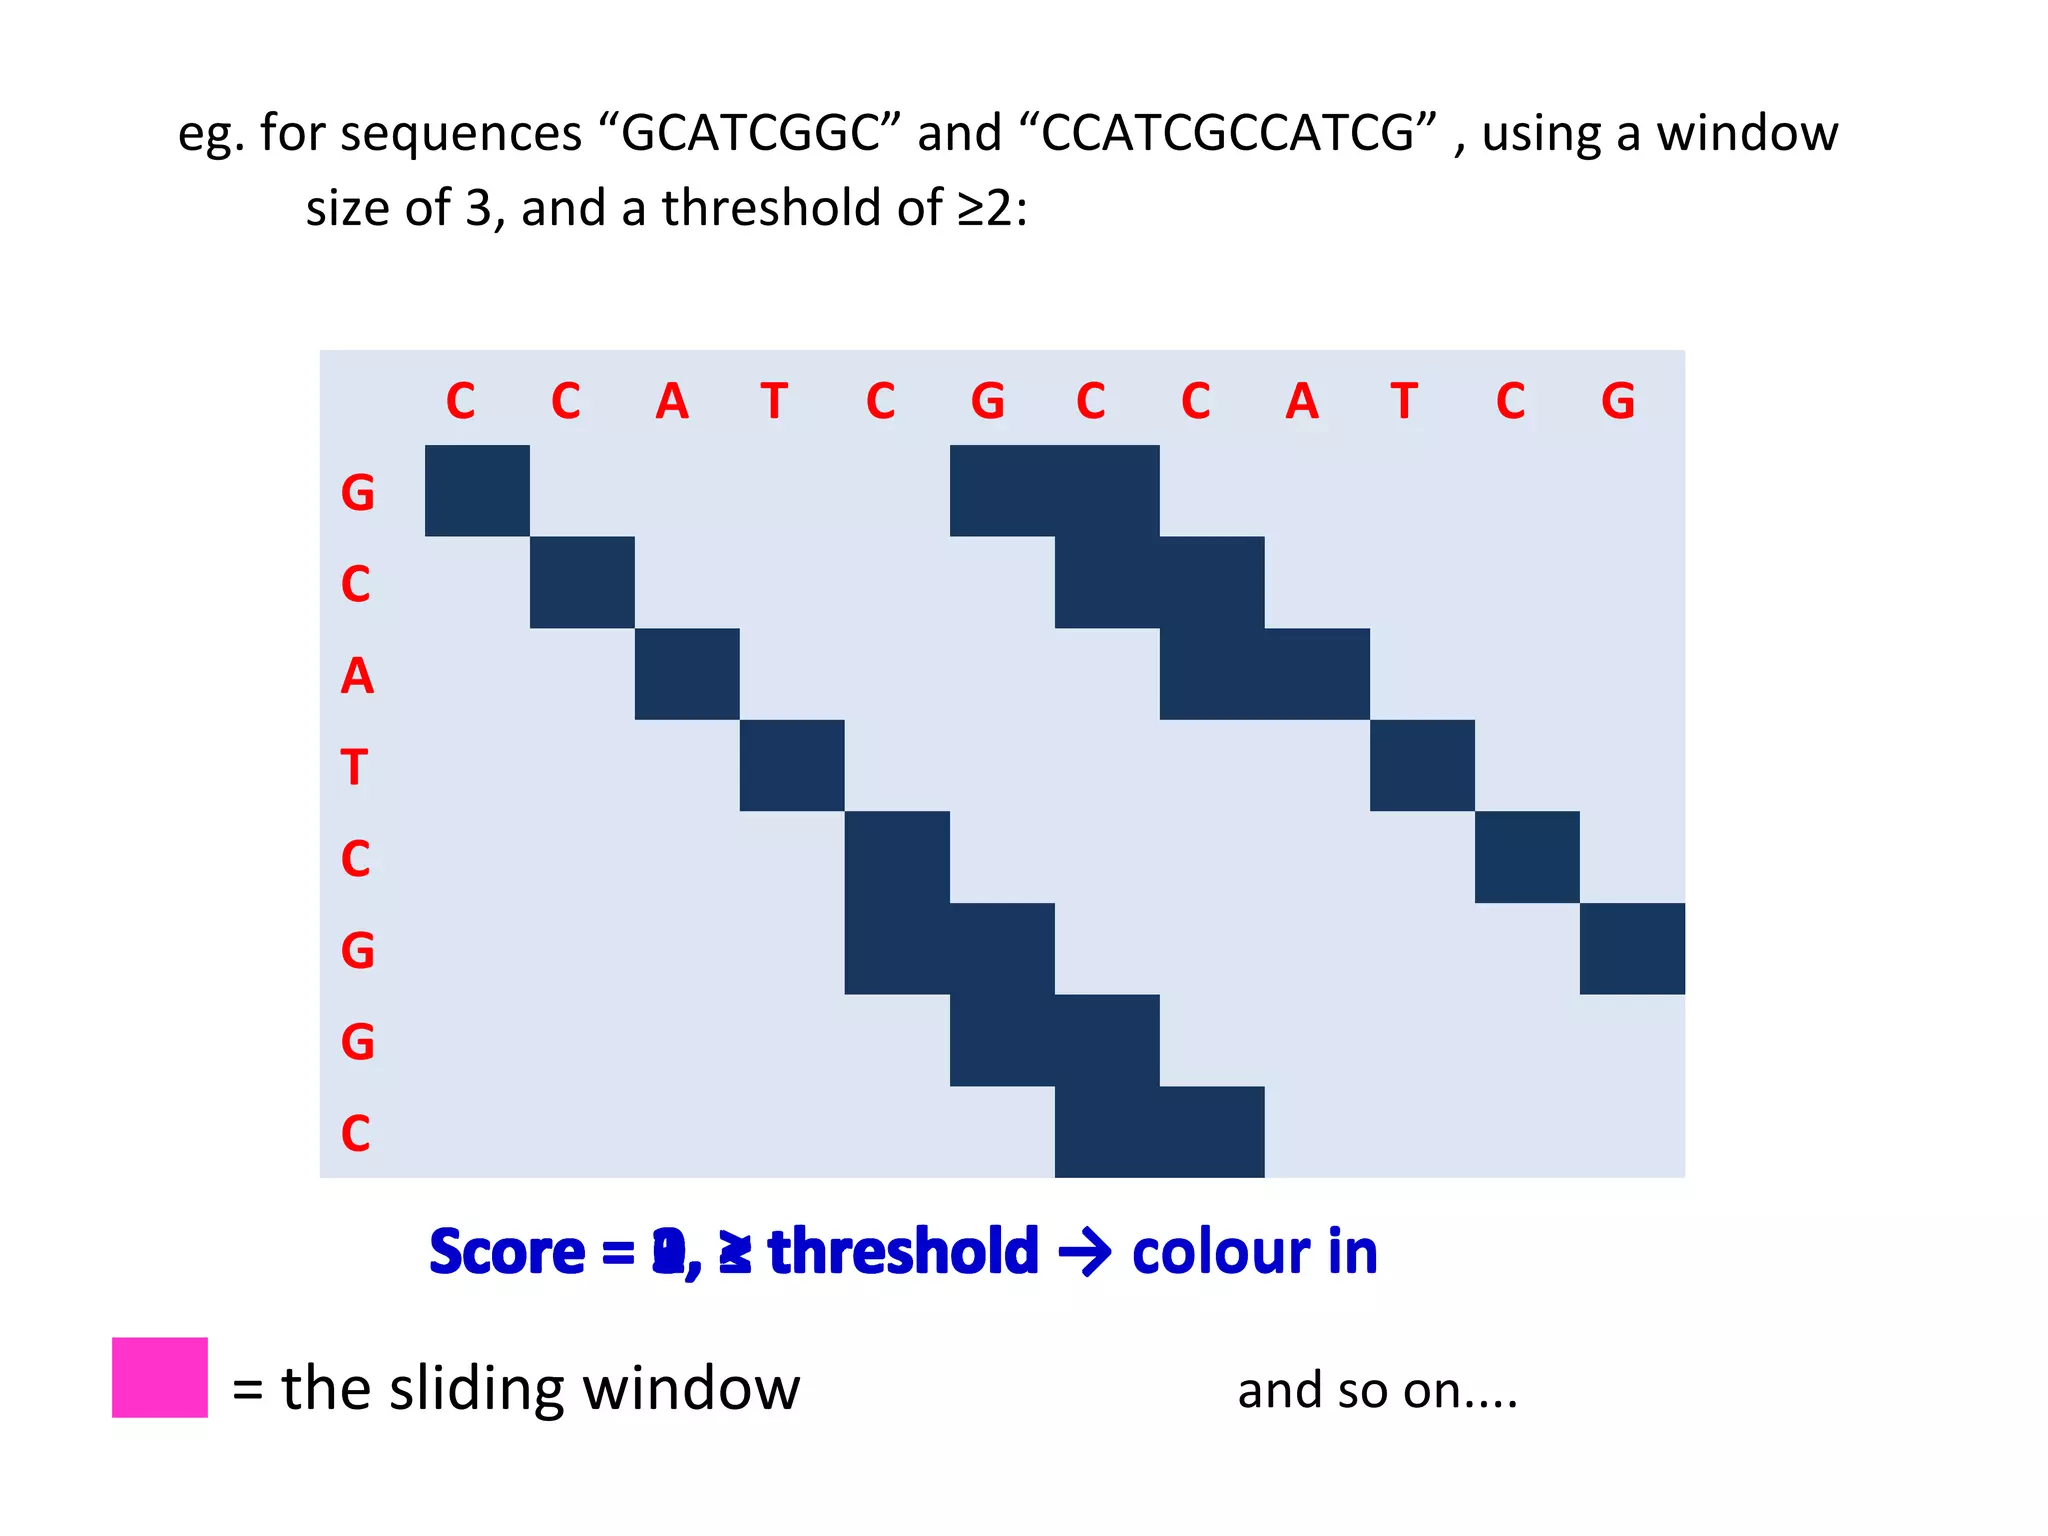
eg. for sequences“GCATCGGC” and “CCATCGCCATCG” , using a window
size of 3, and a threshold of ≥2:
C C A T C G C C A T C G
G
C
A
T
C
G
G
C
Score = 2, ≥ threshold → colour in
3, <
0,
1,
= the sliding window and so on....
8.
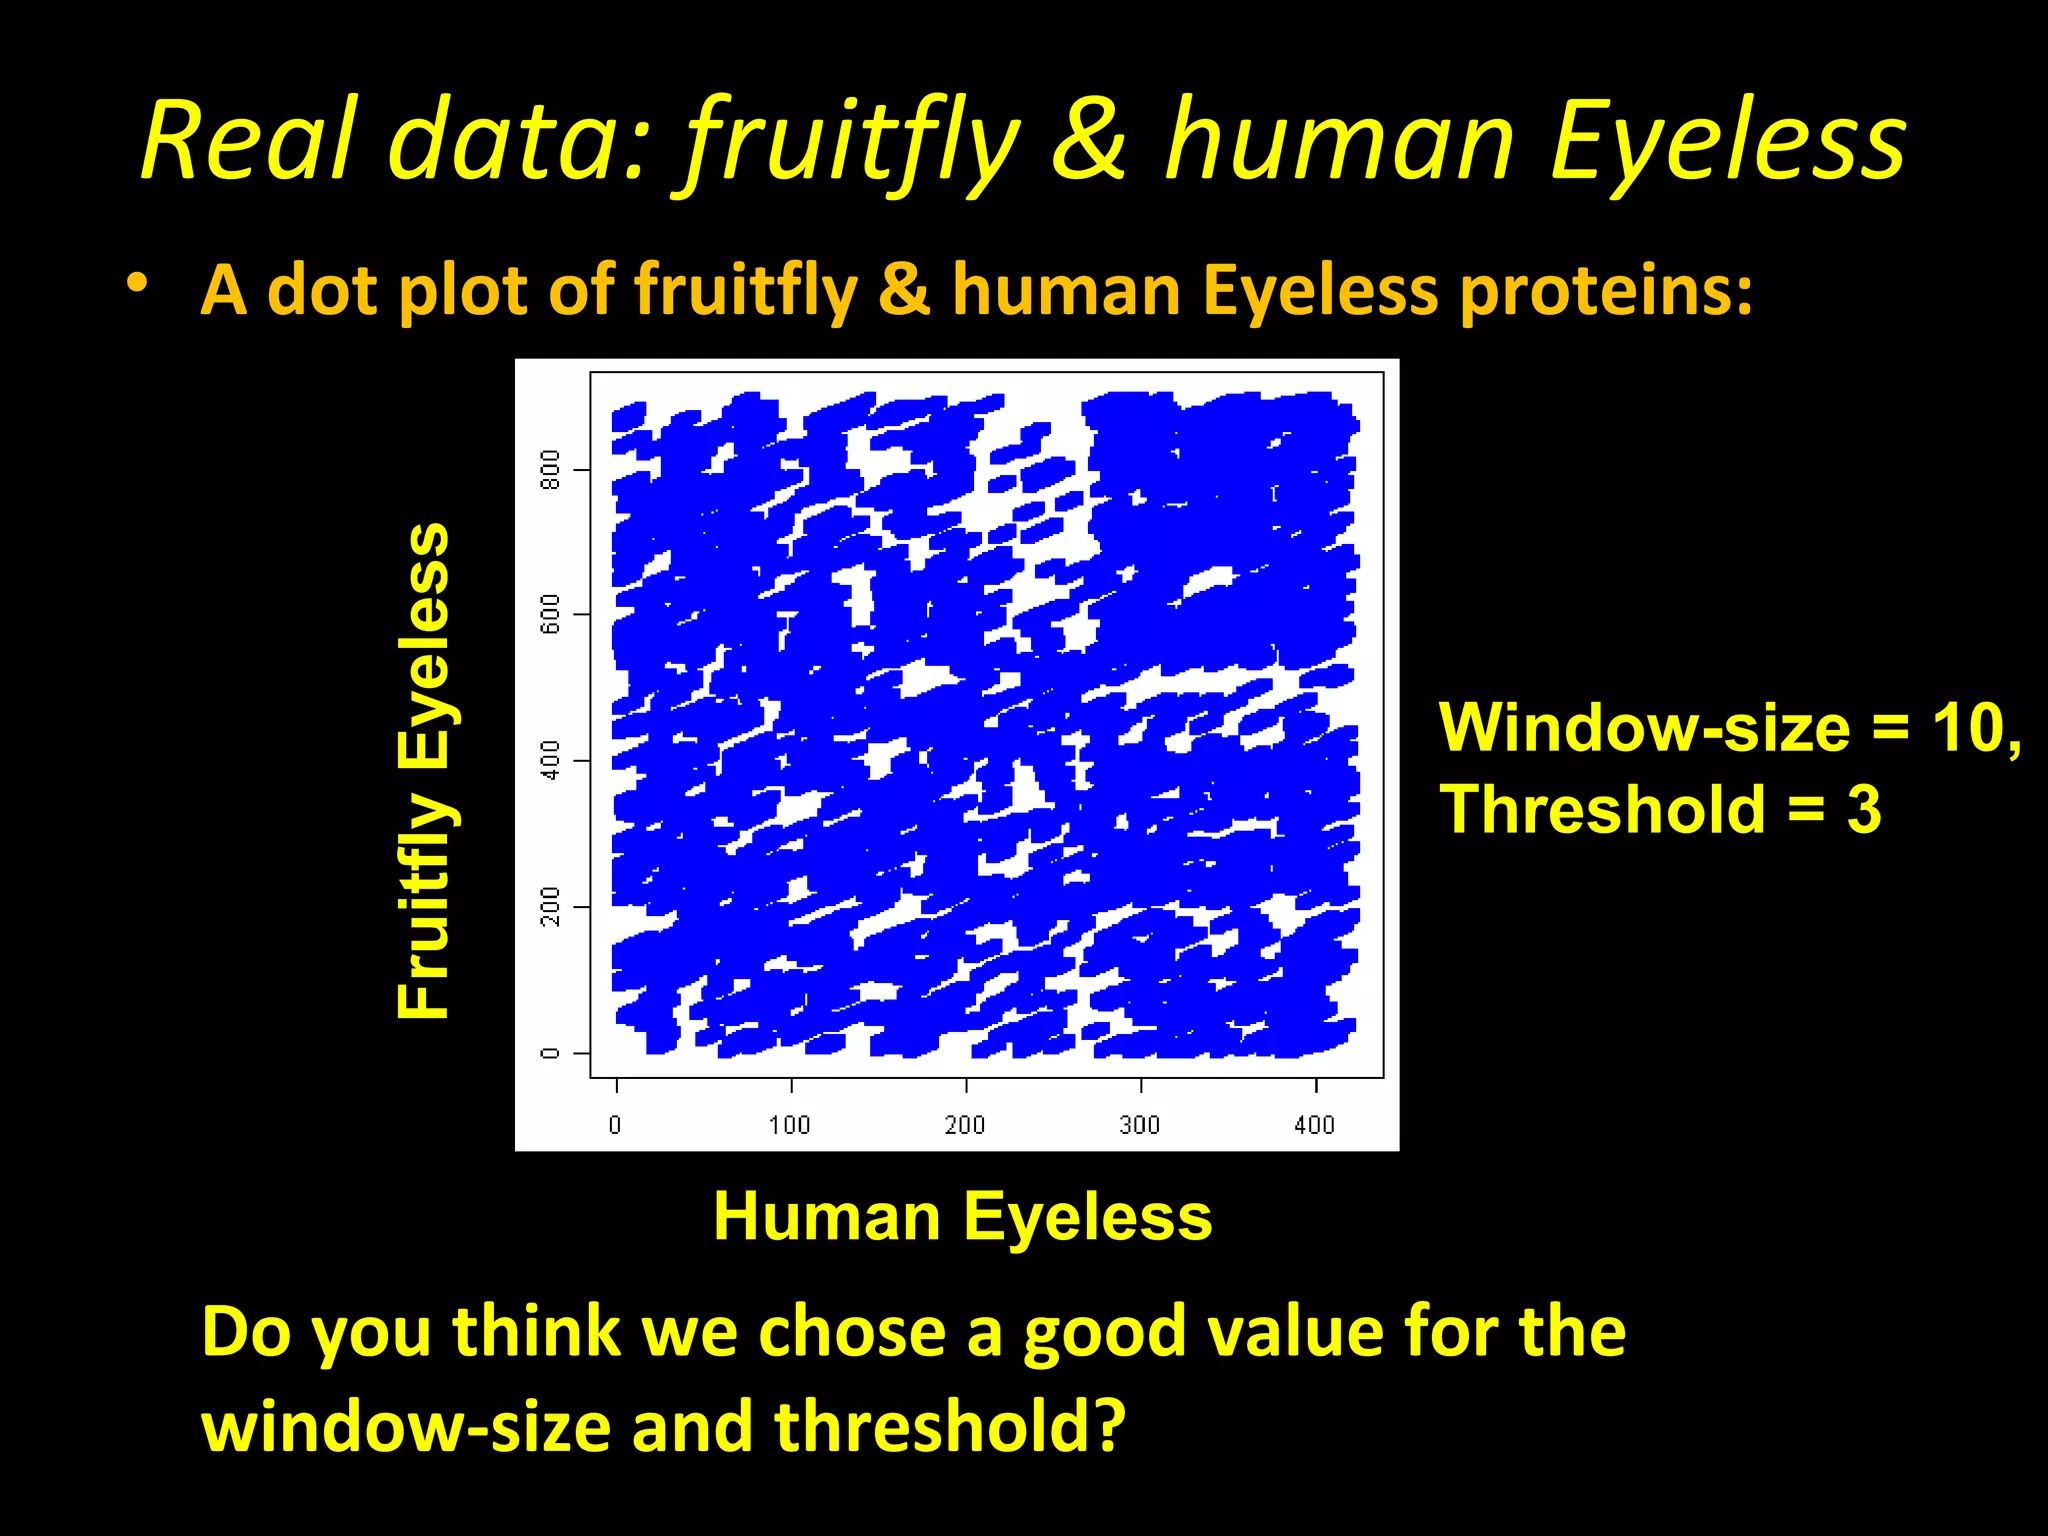
Real data: fruitfly& human Eyeless
• A dot plot of fruitfly & human Eyeless proteins:
Fruitfly Eyeless
Window-size = 10,
Threshold = 3
Human Eyeless
Do you think we chose a good value for the
window-size and threshold?
9.
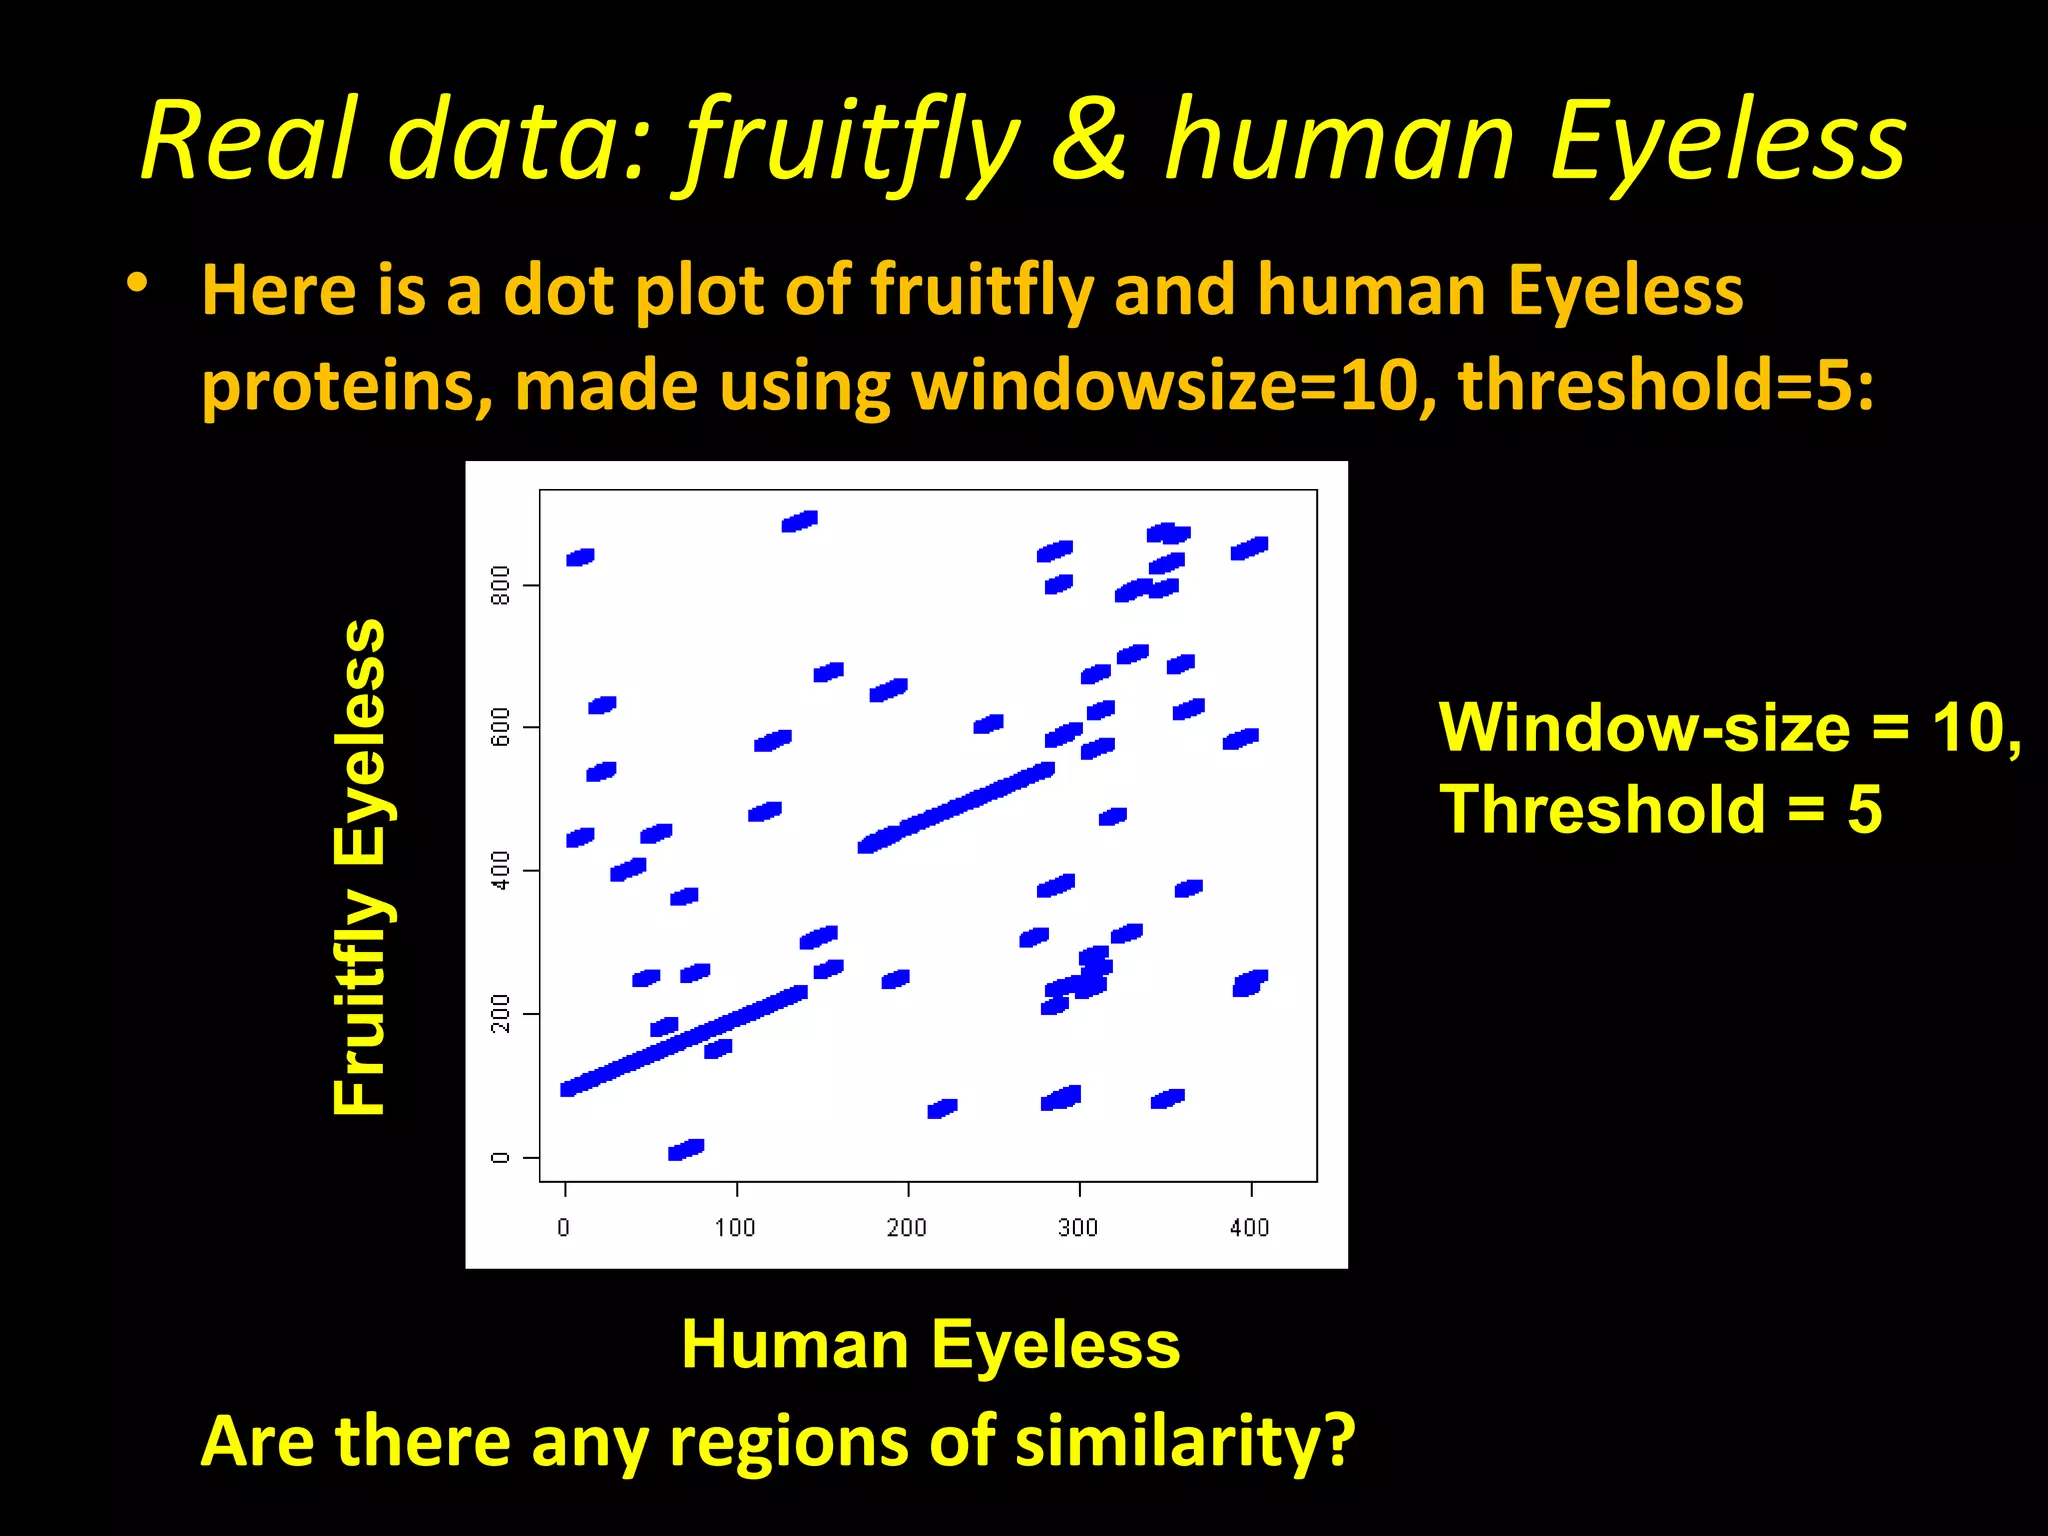
Real data: fruitfly& human Eyeless
• Here is a dot plot of fruitfly and human Eyeless
proteins, made using windowsize=10, threshold=5:
Fruitfly Eyeless
Window-size = 10,
Threshold = 5
Human Eyeless
Are there any regions of similarity?
10.
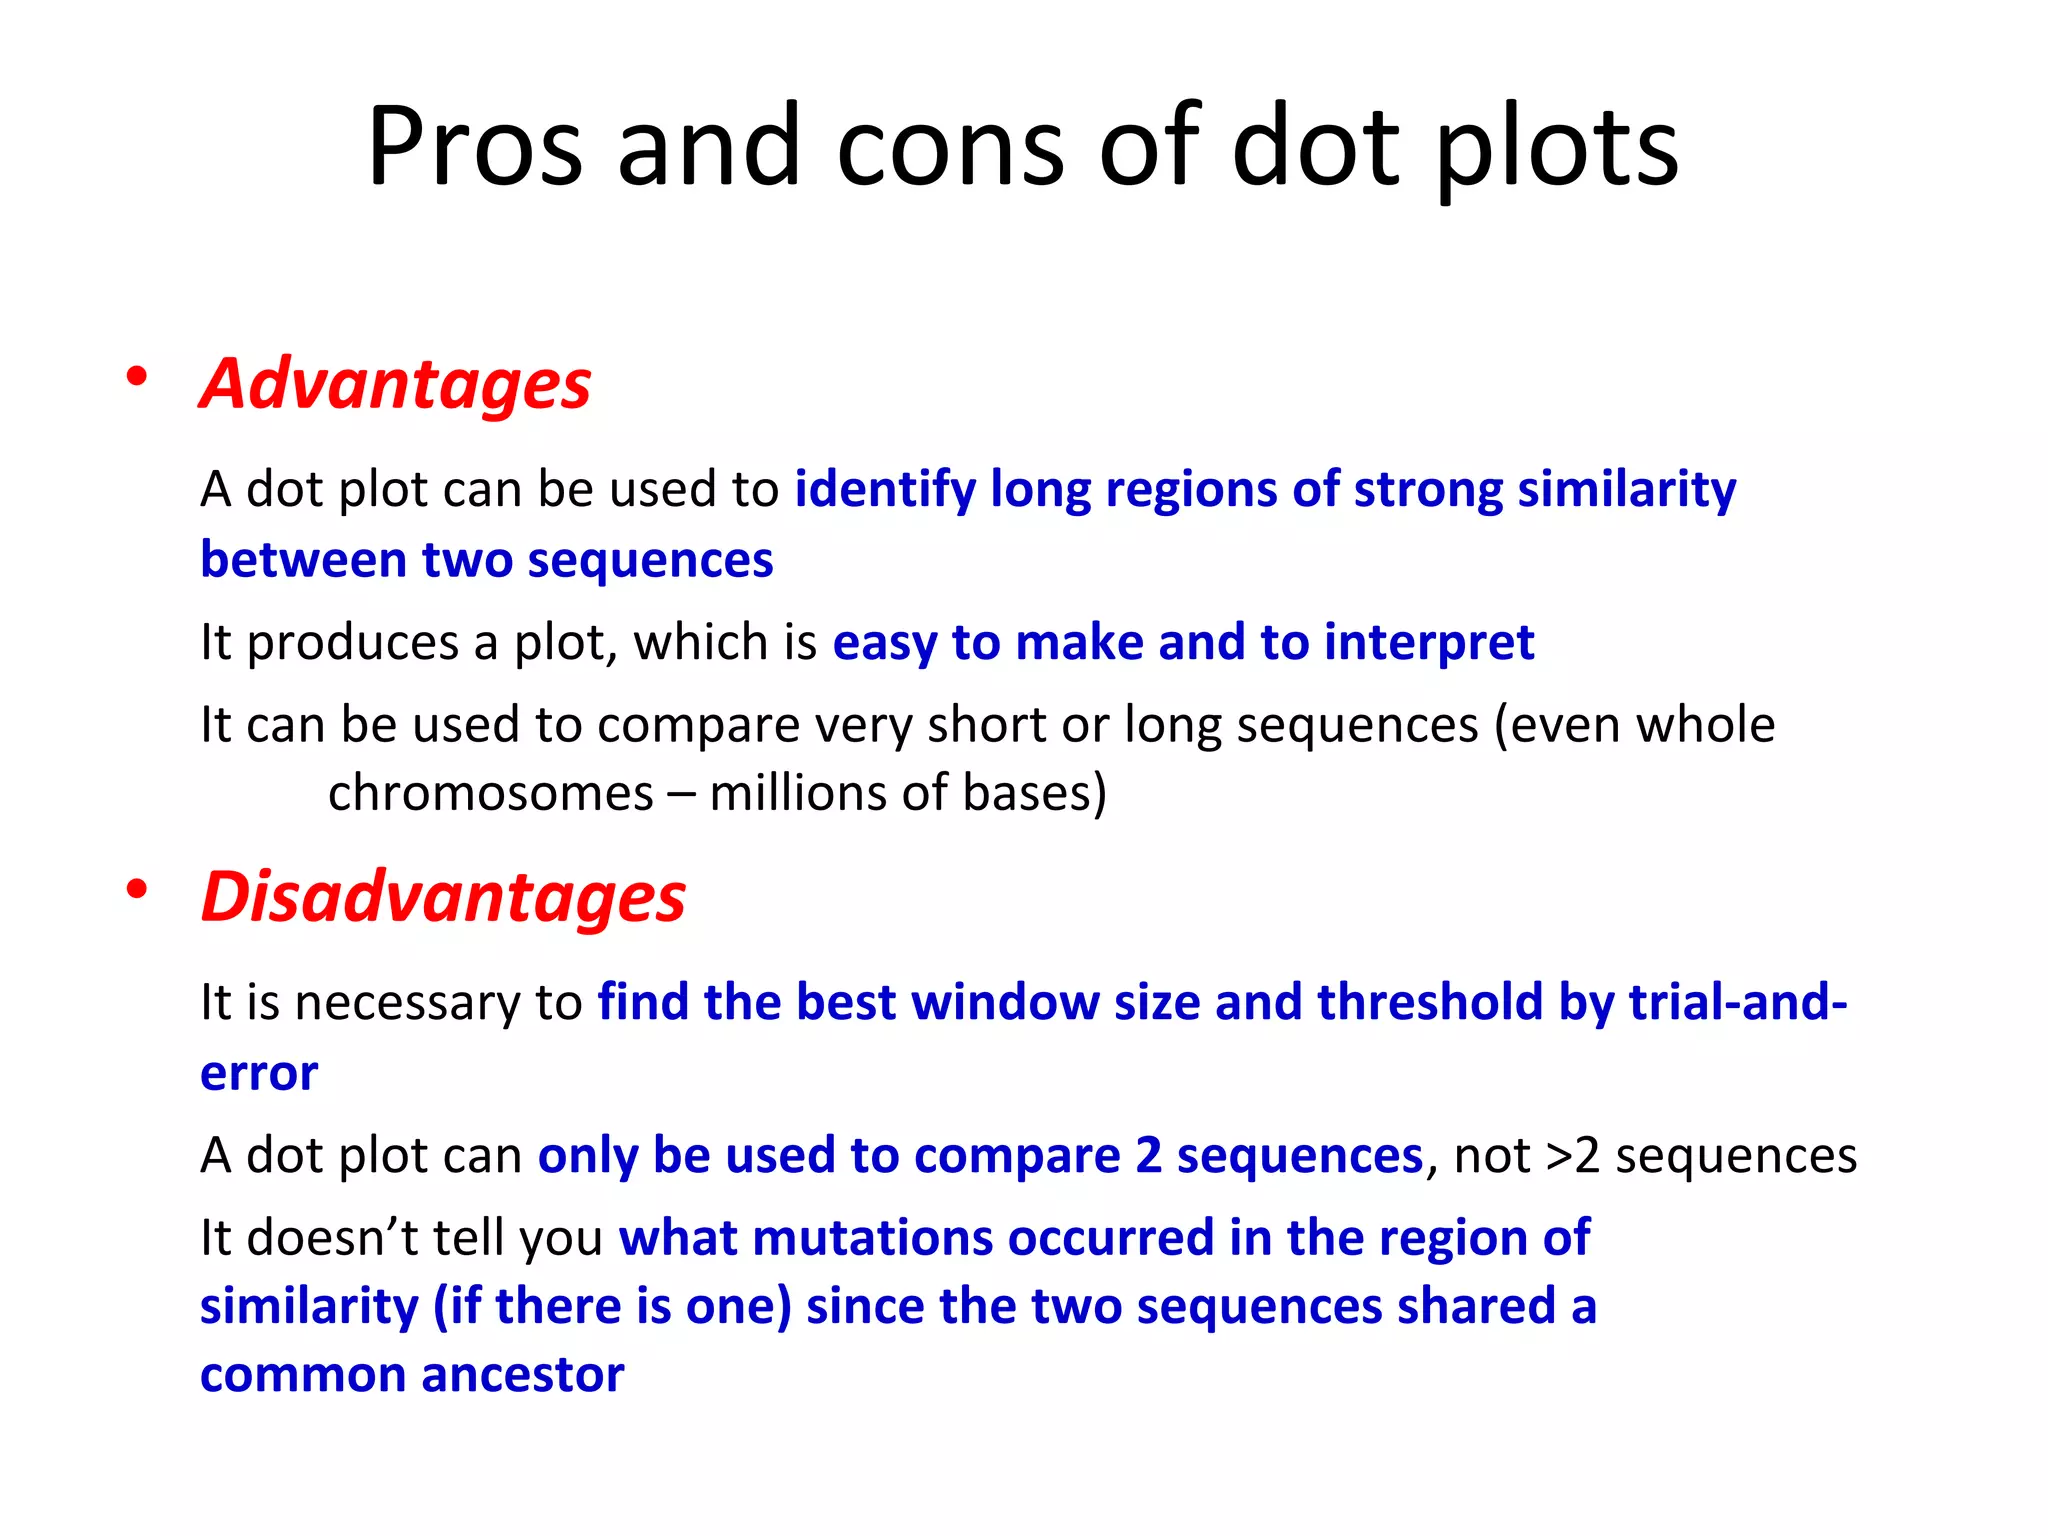
Pros and consof dot plots
• Advantages
A dot plot can be used to identify long regions of strong similarity
between two sequences
It produces a plot, which is easy to make and to interpret
It can be used to compare very short or long sequences (even whole
chromosomes – millions of bases)
• Disadvantages
It is necessary to find the best window size and threshold by trial-and-
error
A dot plot can only be used to compare 2 sequences, not >2 sequences
It doesn’t tell you what mutations occurred in the region of
similarity (if there is one) since the two sequences shared a
common ancestor
11.
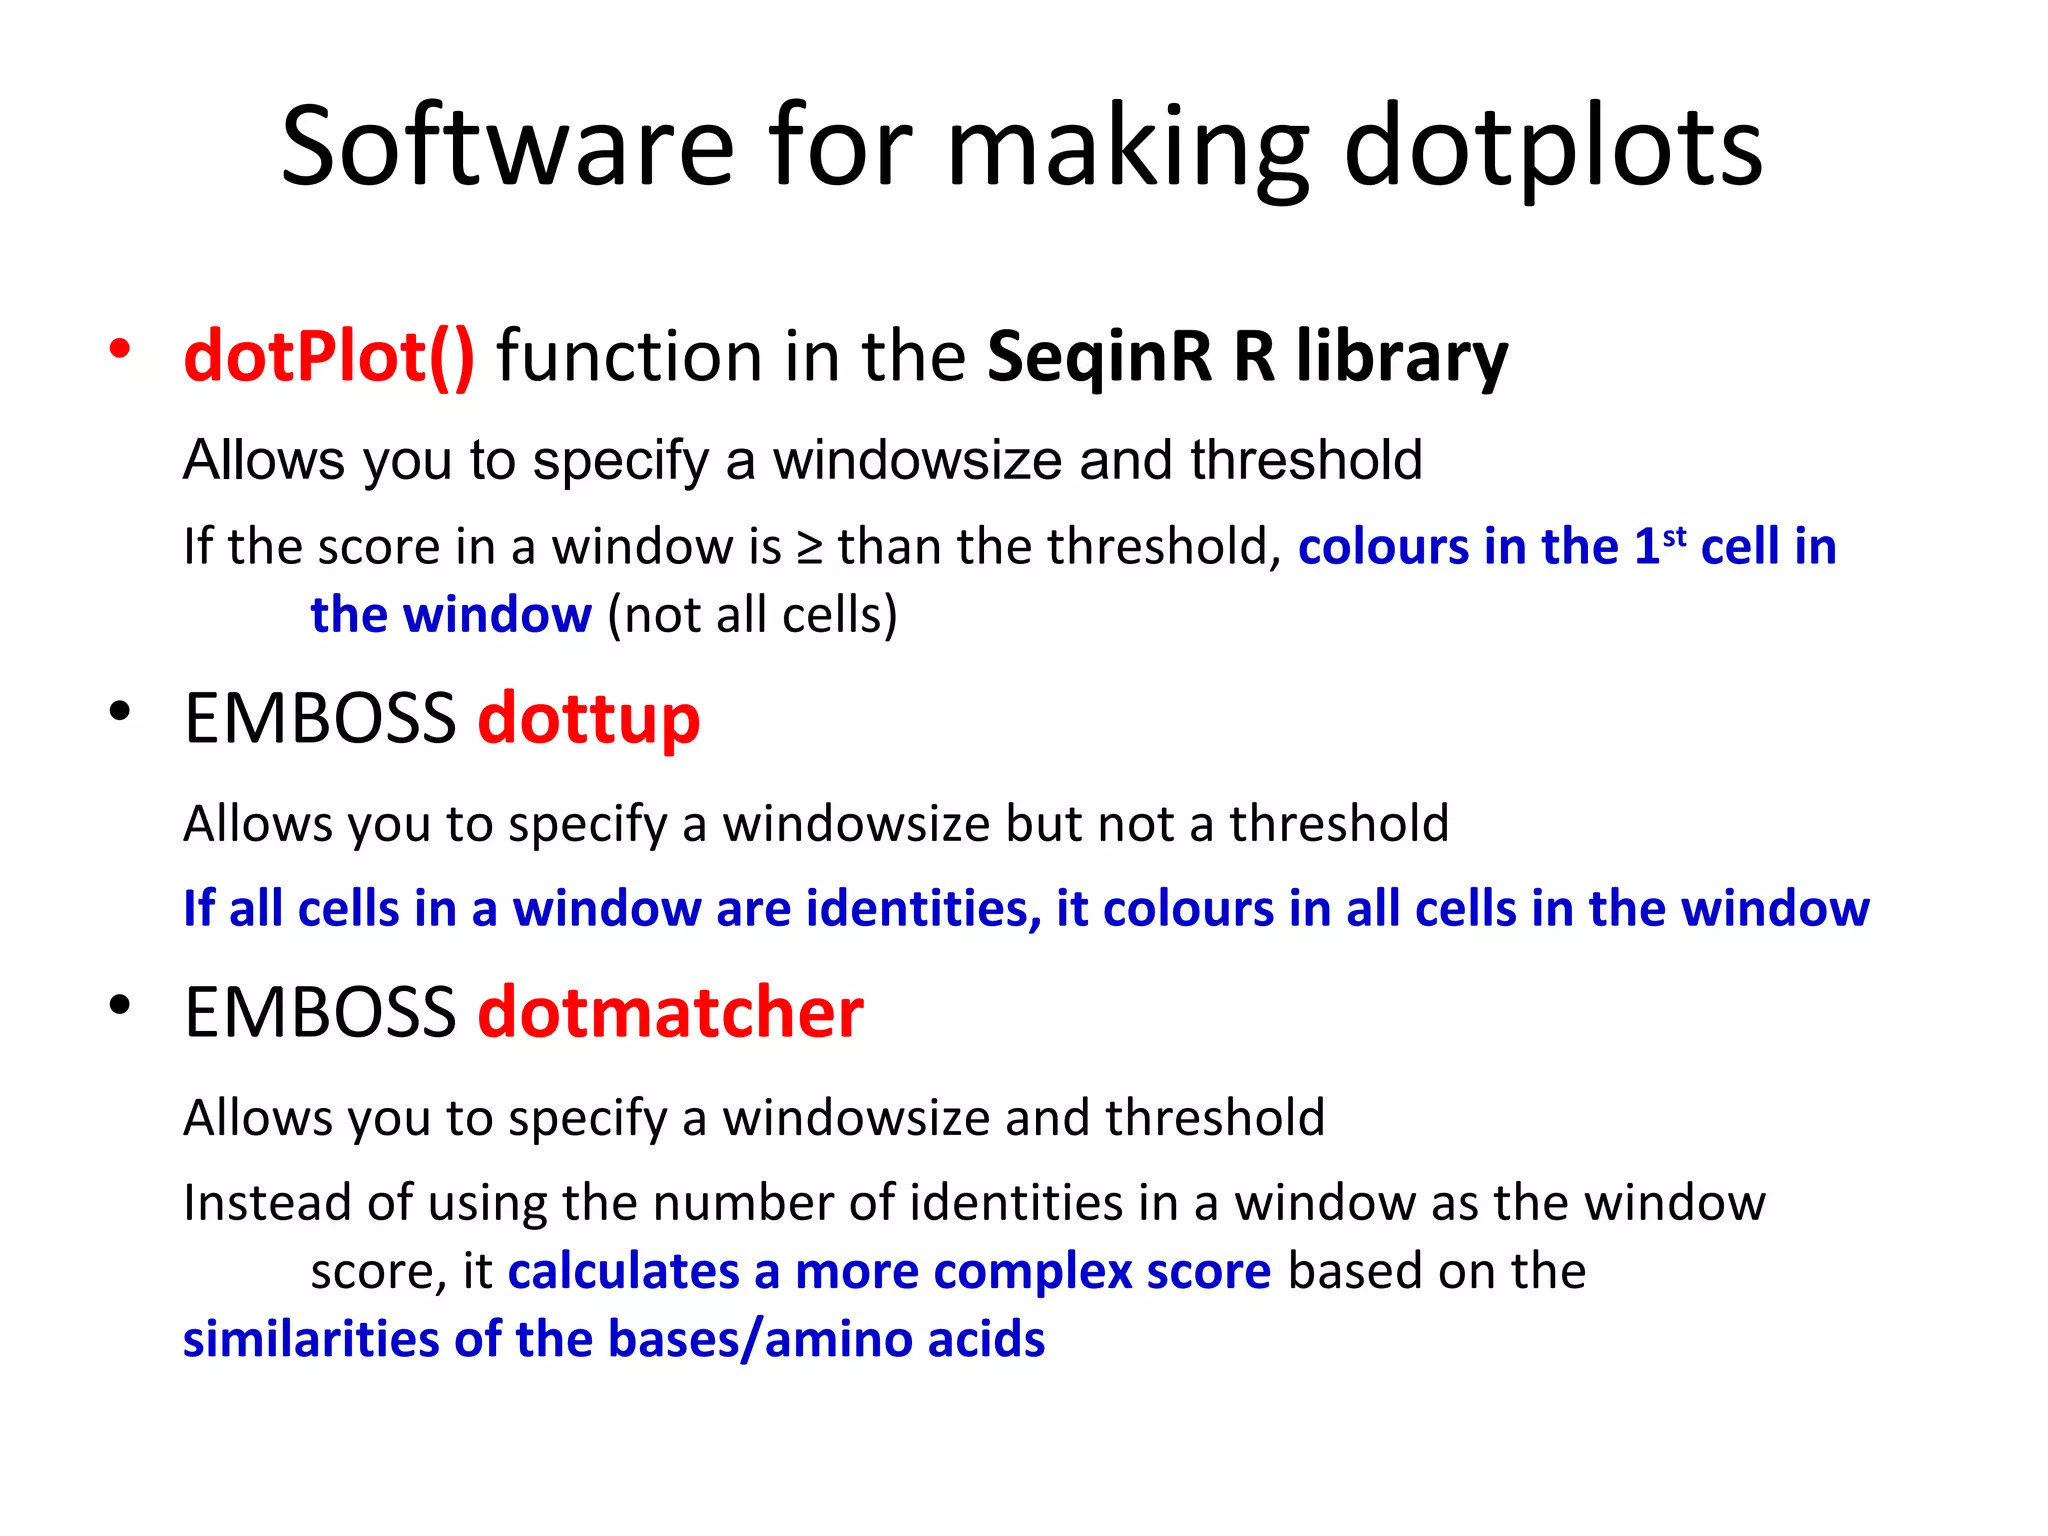
Software for makingdotplots
• dotPlot() function in the SeqinR R library
Allows you to specify a windowsize and threshold
If the score in a window is ≥ than the threshold, colours in the 1st cell in
the window (not all cells)
• EMBOSS dottup
Allows you to specify a windowsize but not a threshold
If all cells in a window are identities, it colours in all cells in the window
• EMBOSS dotmatcher
Allows you to specify a windowsize and threshold
Instead of using the number of identities in a window as the window
score, it calculates a more complex score based on the
similarities of the bases/amino acids
12.
Problem
• Make adot-plot for amino acid sequences
“RQQEPVRSTC” and “QQESGPVRST”, using a
window size of 3, and a threshold of ≥3
13.
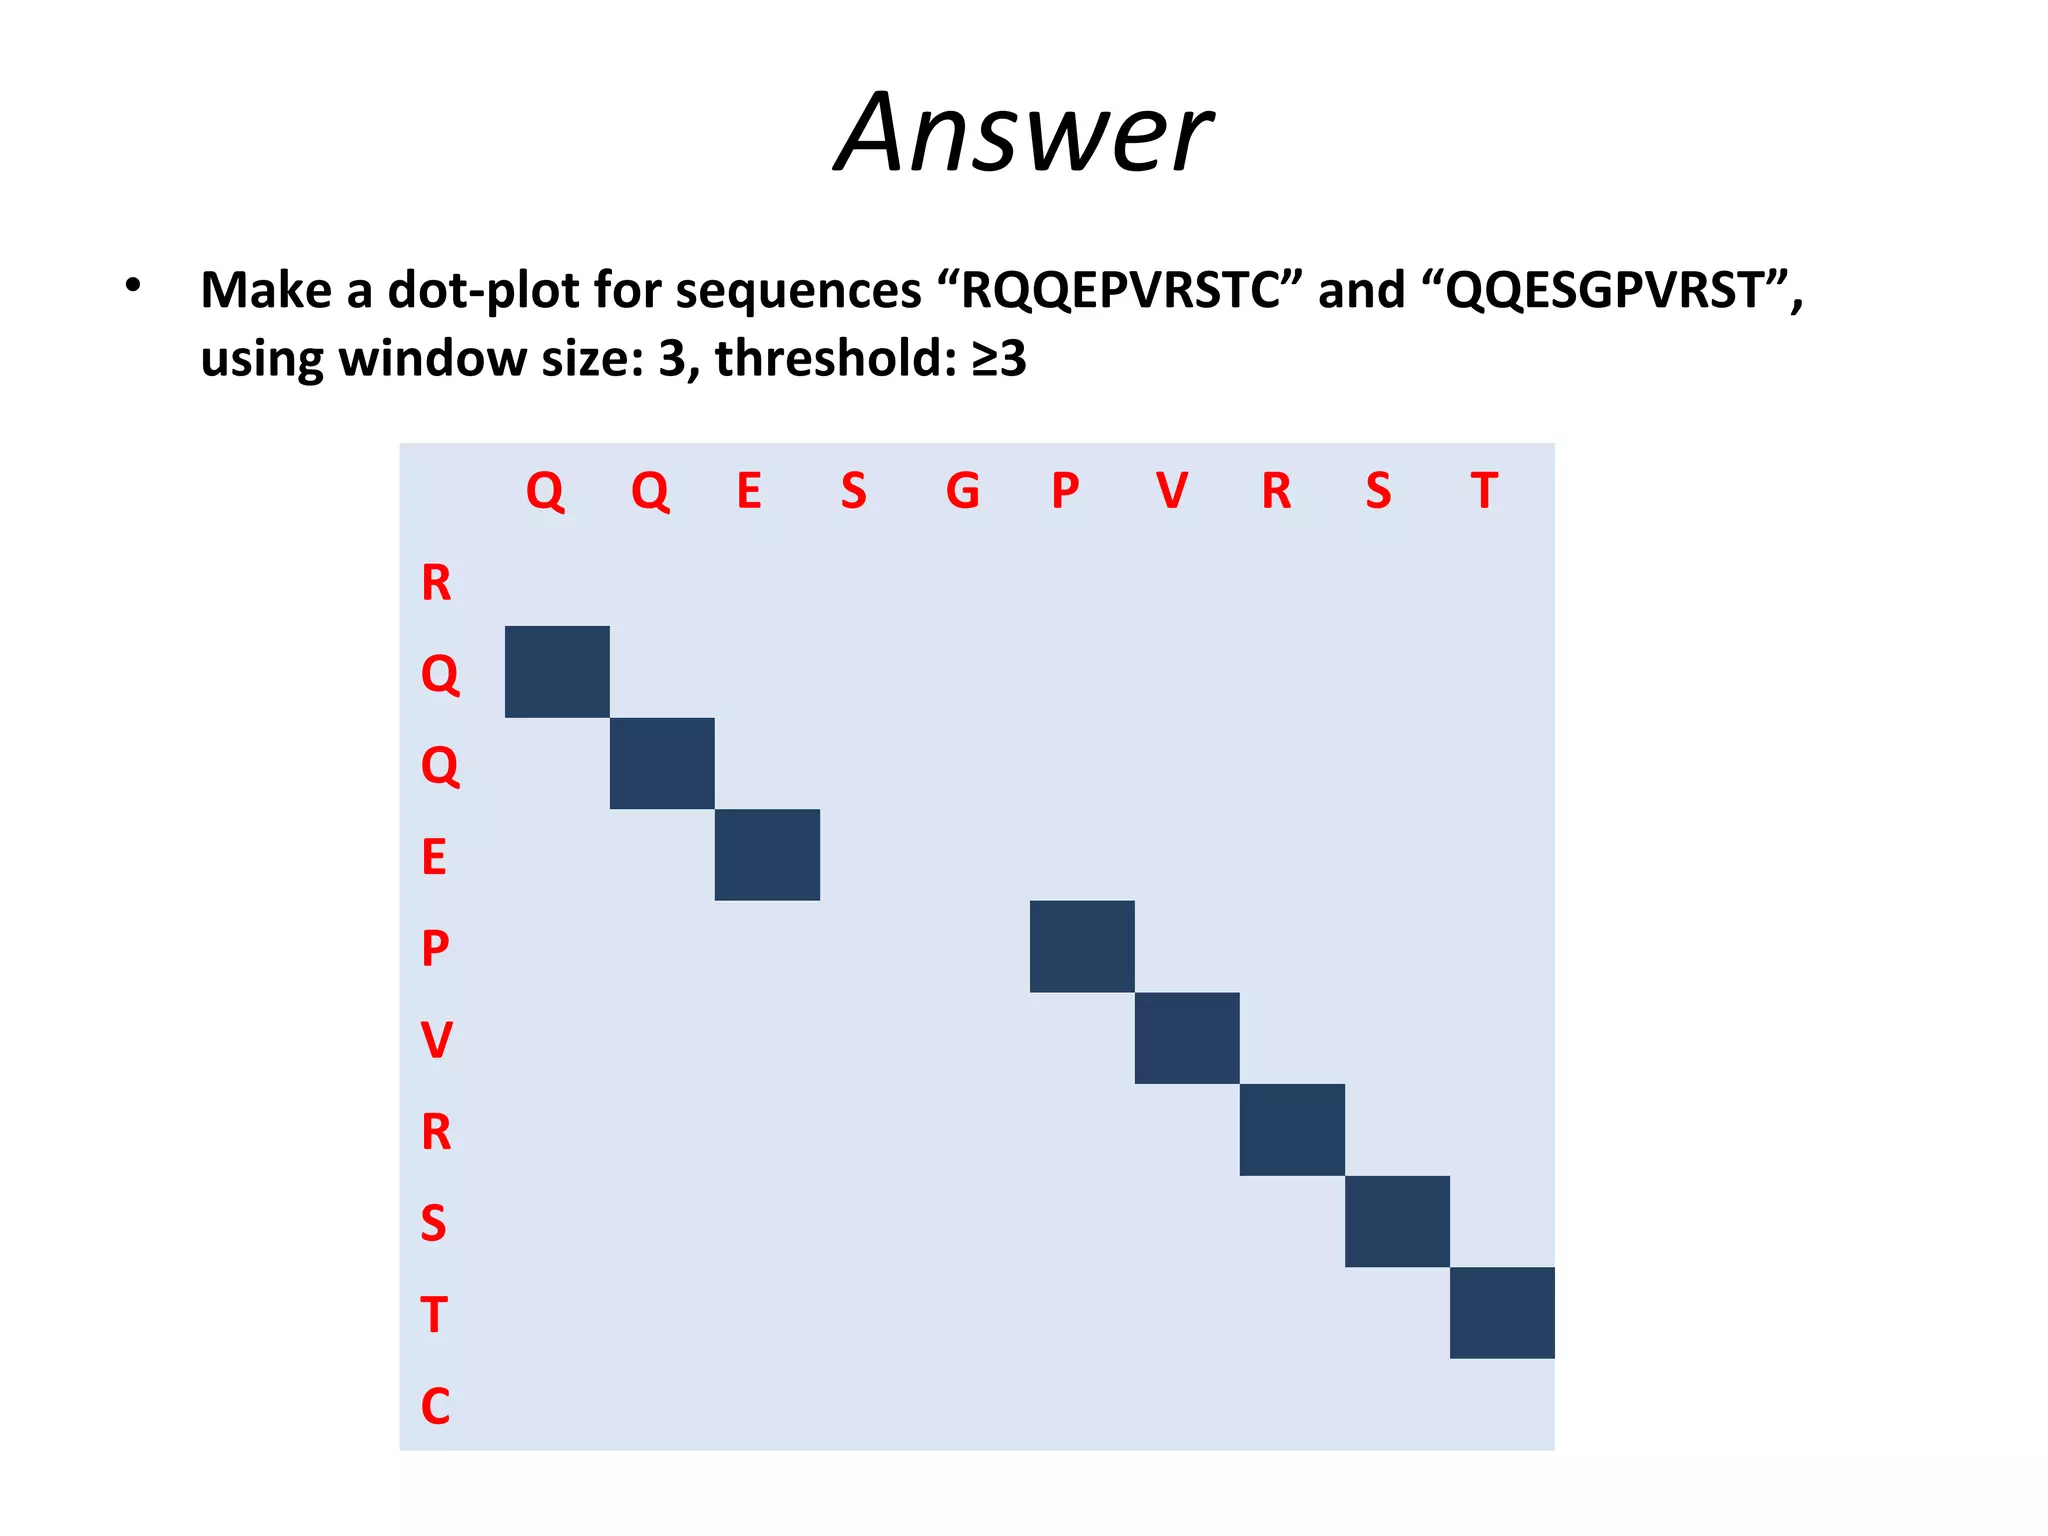
Answer
• Make a dot-plot for sequences “RQQEPVRSTC” and “QQESGPVRST”,
using window size: 3, threshold: ≥3
Q Q E S G P V R S T
R
Q
Q
E
P
V
R
S
T
C
14.
Further reading
• Chapter 3 in Introduction to Computational Genomics Cristianini & Hahn
• Practical on dotplots in R in the Little Book of R for Bioinformatics:
https://a-little-book-of-r-for-
bioinformatics.readthedocs.org/en/latest/src/chapter4.html