Sequence Alignment
• Sequencealignment is the procedure of comparing two
(pair‐wise alignment) or more multiple sequences by
searching for a series of individual characters or
patterns that are in the same order in the sequences.
• There are two types of alignment: local and global.
– In global alignment, an attempt is made to align the entire
sequence. If two sequences have approximately the same
length and are quite similar, they are suitable for the global
alignment.
– Local alignment concentrates on finding stretches of
sequences with high level of matches.
3.
Alignment algorithms
• Alignmentalgorithms, both global and local,
are based on one of the three methods:
• The dot matrix method
• The dynamic programming method
• The word method
Dot matrix Analysis
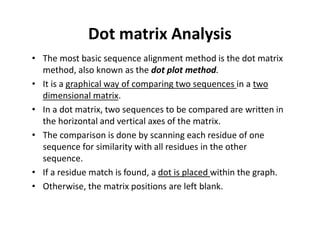
•The most basic sequence alignment method is the dot matrix
method, also known as the dot plot method.
• It is a graphical way of comparing two sequences in a two
dimensional matrix.
• In a dot matrix, two sequences to be compared are written in
the horizontal and vertical axes of the matrix.
• The comparison is done by scanning each residue of one
sequence for similarity with all residues in the other
sequence.
• If a residue match is found, a dot is placed within the graph.
• Otherwise, the matrix positions are left blank.
6.
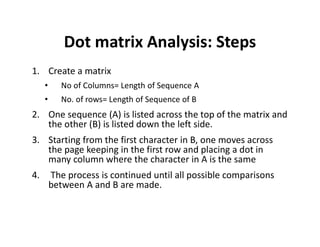
Dot matrix Analysis:Steps
1. Create a matrix
• No of Columns= Length of Sequence A
• No. of rows= Length of Sequence of B
2. One sequence (A) is listed across the top of the matrix and
the other (B) is listed down the left side.
3. Starting from the first character in B, one moves across
the page keeping in the first row and placing a dot in
many column where the character in A is the same
4. The process is continued until all possible comparisons
between A and B are made.
8
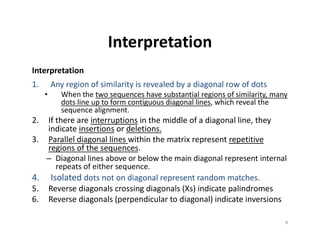
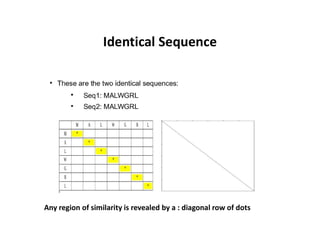
Interpretation
Interpretation
1. Any regionof similarity is revealed by a diagonal row of dots
• When the two sequences have substantial regions of similarity, many
dots line up to form contiguous diagonal lines, which reveal the
sequence alignment.
2. If there are interruptions in the middle of a diagonal line, they
indicate insertions or deletions.
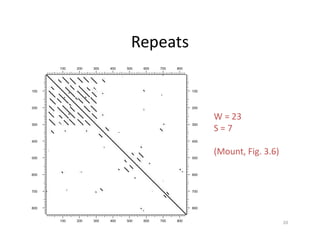
3. Parallel diagonal lines within the matrix represent repetitive
regions of the sequences.
– Diagonal lines above or below the main diagonal represent internal
repeats of either sequence.
4. Isolated dots not on diagonal represent random matches.
5. Reverse diagonals crossing diagonals (Xs) indicate palindromes
6. Reverse diagonals (perpendicular to diagonal) indicate inversions
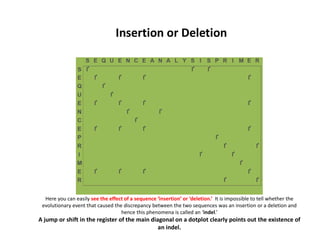
Here you caneasily see the effect of a sequence ‘insertion’ or ‘deletion.’ It is impossible to tell whether the
evolutionary event that caused the discrepancy between the two sequences was an insertion or a deletion and
hence this phenomena is called an ‘indel.’
A jump or shift in the register of the main diagonal on a dotplot clearly points out the existence of
an indel.
Insertion or Deletion
S E QU E N C E A N A L Y S I S P R I M E R
S • • •
E • • • •
Q •
U •
E • • • •
N • •
C •
E • • • •
S • • •
E • • • •
Q •
U •
E • • • •
N • •
C •
E • • • •
S • • •
E • • • •
Q •
U •
E • • • •
N • •
C •
E • • • •
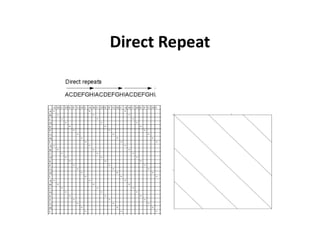
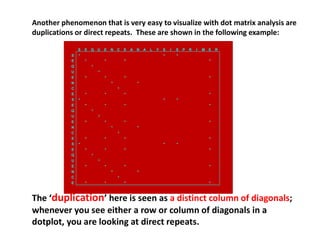
Another phenomenon that is very easy to visualize with dot matrix analysis are
duplications or direct repeats. These are shown in the following example:
The ‘duplication’ here is seen as a distinct column of diagonals;
whenever you see either a row or column of diagonals in a
dotplot, you are looking at direct repeats.
S E QU E N C E A N A L Y S I S P R I M E R
S • • •
E • • • •
Q •
U •
E • • • •
N • •
C •
E • • • •
A • •
N • •
A • •
L •
Y •
S • • •
I • •
S • • •
P •
R • •
I • •
M •
E • • • •
R • •
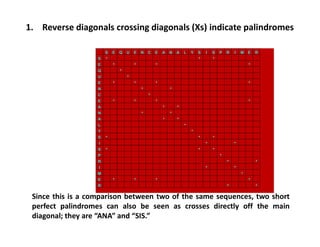
Since this is a comparison between two of the same sequences, two short
perfect palindromes can also be seen as crosses directly off the main
diagonal; they are “ANA” and “SIS.”
1. Reverse diagonals crossing diagonals (Xs) indicate palindromes
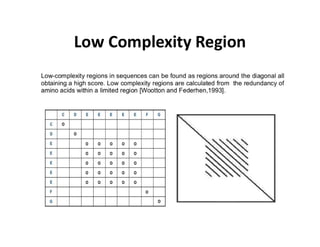
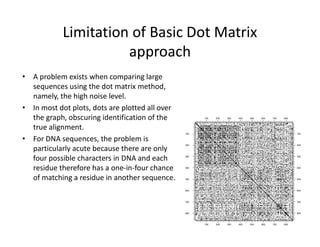
Limitation of BasicDot Matrix
approach
• A problem exists when comparing large
sequences using the dot matrix method,
namely, the high noise level.
• In most dot plots, dots are plotted all over
the graph, obscuring identification of the
true alignment.
• For DNA sequences, the problem is
particularly acute because there are only
four possible characters in DNA and each
residue therefore has a one‐in‐four chance
of matching a residue in another sequence.
100
100
200
200
300
300
400
400
500
500
600
600
700
700
800
800
100 100
200 200
300 300
400 400
500 500
600 600
700 700
800 800
18.
Filtering to remove‘noise’
• To reduce noise, instead of using a single residue to scan for
similarity, a filtering technique has to be applied, which uses a
“window” of fixed length covering a stretch of residue pairs.
• When applying filtering, windows slide across the two sequences to
compare all possible stretches.
• Dots are only placed when a stretch of residues equal to the
window size from one sequence matches completely with a stretch
of another sequence.
• This method has been shown to be effective in reducing the noise
level.
• The window is also called a tuple, the size of which can be
manipulated so that a clear pattern of sequence match can be
plotted.
• However, if the selected window size is too long, sensitivity of the
alignment is lost.
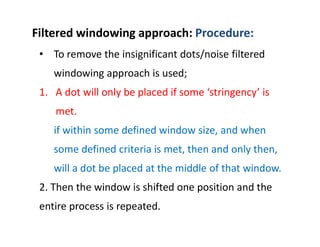
• To removethe insignificant dots/noise filtered
windowing approach is used;
1. A dot will only be placed if some ‘stringency’ is
met.
if within some defined window size, and when
some defined criteria is met, then and only then,
will a dot be placed at the middle of that window.
2. Then the window is shifted one position and the
entire process is repeated.
Filtered windowing approach: Procedure:
22.
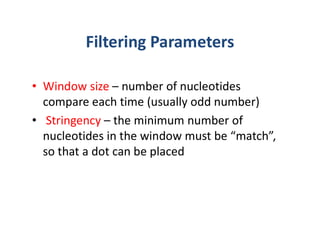
Filtering Parameters
• Windowsize – number of nucleotides
compare each time (usually odd number)
• Stringency – the minimum number of
nucleotides in the window must be “match”,
so that a dot can be placed
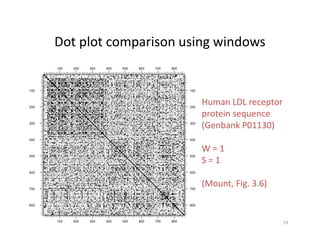
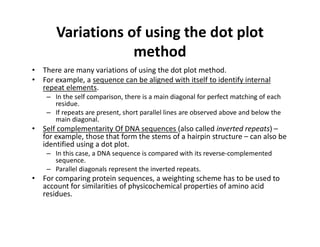
Variations of usingthe dot plot
method
• There are many variations of using the dot plot method.
• For example, a sequence can be aligned with itself to identify internal
repeat elements.
– In the self comparison, there is a main diagonal for perfect matching of each
residue.
– If repeats are present, short parallel lines are observed above and below the
main diagonal.
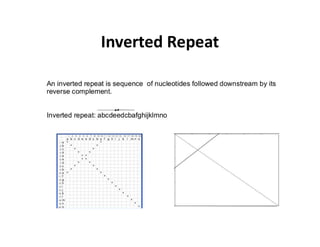
• Self complementarity Of DNA sequences (also called inverted repeats) –
for example, those that form the stems of a hairpin structure – can also be
identified using a dot plot.
– In this case, a DNA sequence is compared with its reverse‐complemented
sequence.
– Parallel diagonals represent the inverted repeats.
• For comparing protein sequences, a weighting scheme has to be used to
account for similarities of physicochemical properties of amino acid
residues.
26.
Advantages of DotMatrix Analysis
• The dot matrix method gives a direct visual statement of the
relationship between two sequences and helps easy identification
of the regions of greatest similarities.
• Since your own mind and eyes are still better than computers at
discerning complex visual patterns, especially when more than one
pattern is being considered, and then you can ‘zoom‐in’ on those
regions of interest using more detailed procedures.
• One particular advantage of this method is in identification of
sequence repeat regions based on the presence of parallel
diagonals of the same size vertically or horizontally in the matrix.
The method thus has some applications in genomics.
• It is useful in identifying chromosomal repeats and in comparing
gene order conservation between two closely related genomes.
• It can also be used in identifying nucleic acid secondary structures
through detecting self‐complementarity of a sequence.
27.
Weakness of thisApproach
• The actual alignment is not normally produced
– The dot matrix method displays all possible sequence
matches. However, it is often up to the user to
construct a full alignment with insertions and
deletions by linking nearby diagonals.
• Another limitation of this visual analysis method
is that it lacks statistical rigor (accuracy) in
assessing the quality of the alignment.
• The method is also restricted to pairwise
alignment. It is difficult for the method to scale
up to multiple alignment.
28.
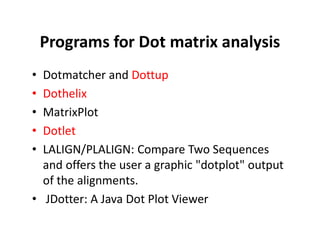
Programs for Dotmatrix analysis
• Dotmatcher and Dottup
• Dothelix
• MatrixPlot
• Dotlet
• LALIGN/PLALIGN: Compare Two Sequences
and offers the user a graphic "dotplot" output
of the alignments.
• JDotter: A Java Dot Plot Viewer
29.
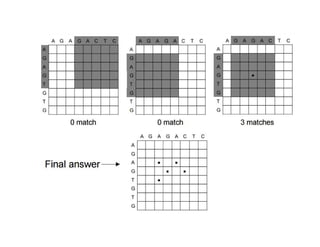
Assignment
• Draw aDot Matrix for following sequences
• Sequence 1: AAGACGTTTA
• Sequence 2: GACGTACT


![Polymer [ बहुलक ] Chemistry Notes PDF - Irfanullah Mehar - JJ Sir Chemistry.pdf](https://cdn.slidesharecdn.com/ss_thumbnails/polymerchemistrynotespdf-irfanullahmehar-jjsirchemistry-260210172118-3f9b37f7-thumbnail.jpg?width=640&height=640&fit=bounds)