Download to read offline


![MIT –Biology Science Outreach
8
D. Interactive Class Exercise on DNA Microarray and Medicine
Note to teachers.
The exercise does not require students to know the details of the DNA microarray technology but
rather to understand what type of data one gets from DNA microarray experiments and how this
data can be useful in the diagnosis and treatment of human diseases.
Goal of this exercise:
To make students realize that the power of DNA microarray technology in medical applications
relies principally on observing a common change in gene expression pattern in patients with the
same type of diseases. Students will have to recognize common patterns of gene expression and
realize the usefulness of such observation. To simplify the exercise you can decrease the number of
genes studied.
You can also provide additional guidance to the students and ask them to reorder the genes in a
specific pattern to facilitate the observation.
More advanced students may think about the function of some of the genes whose activity are
required to prevent cancer or whose activity are required to develop cancer.
Brief overview:
Students will mimic individual genes on DNA chips. The number of genes on a chip will depend on
the class size. Each DNA chip will be used to test the gene expression profile for one cancer
patient, and should contain at least 10 genes to make it significant.
• If the gene is ON (or increased gene activity) the student will stand up (or raise their hand).
• If the gene is OFF (or decreased gene activity) the student will sit down.
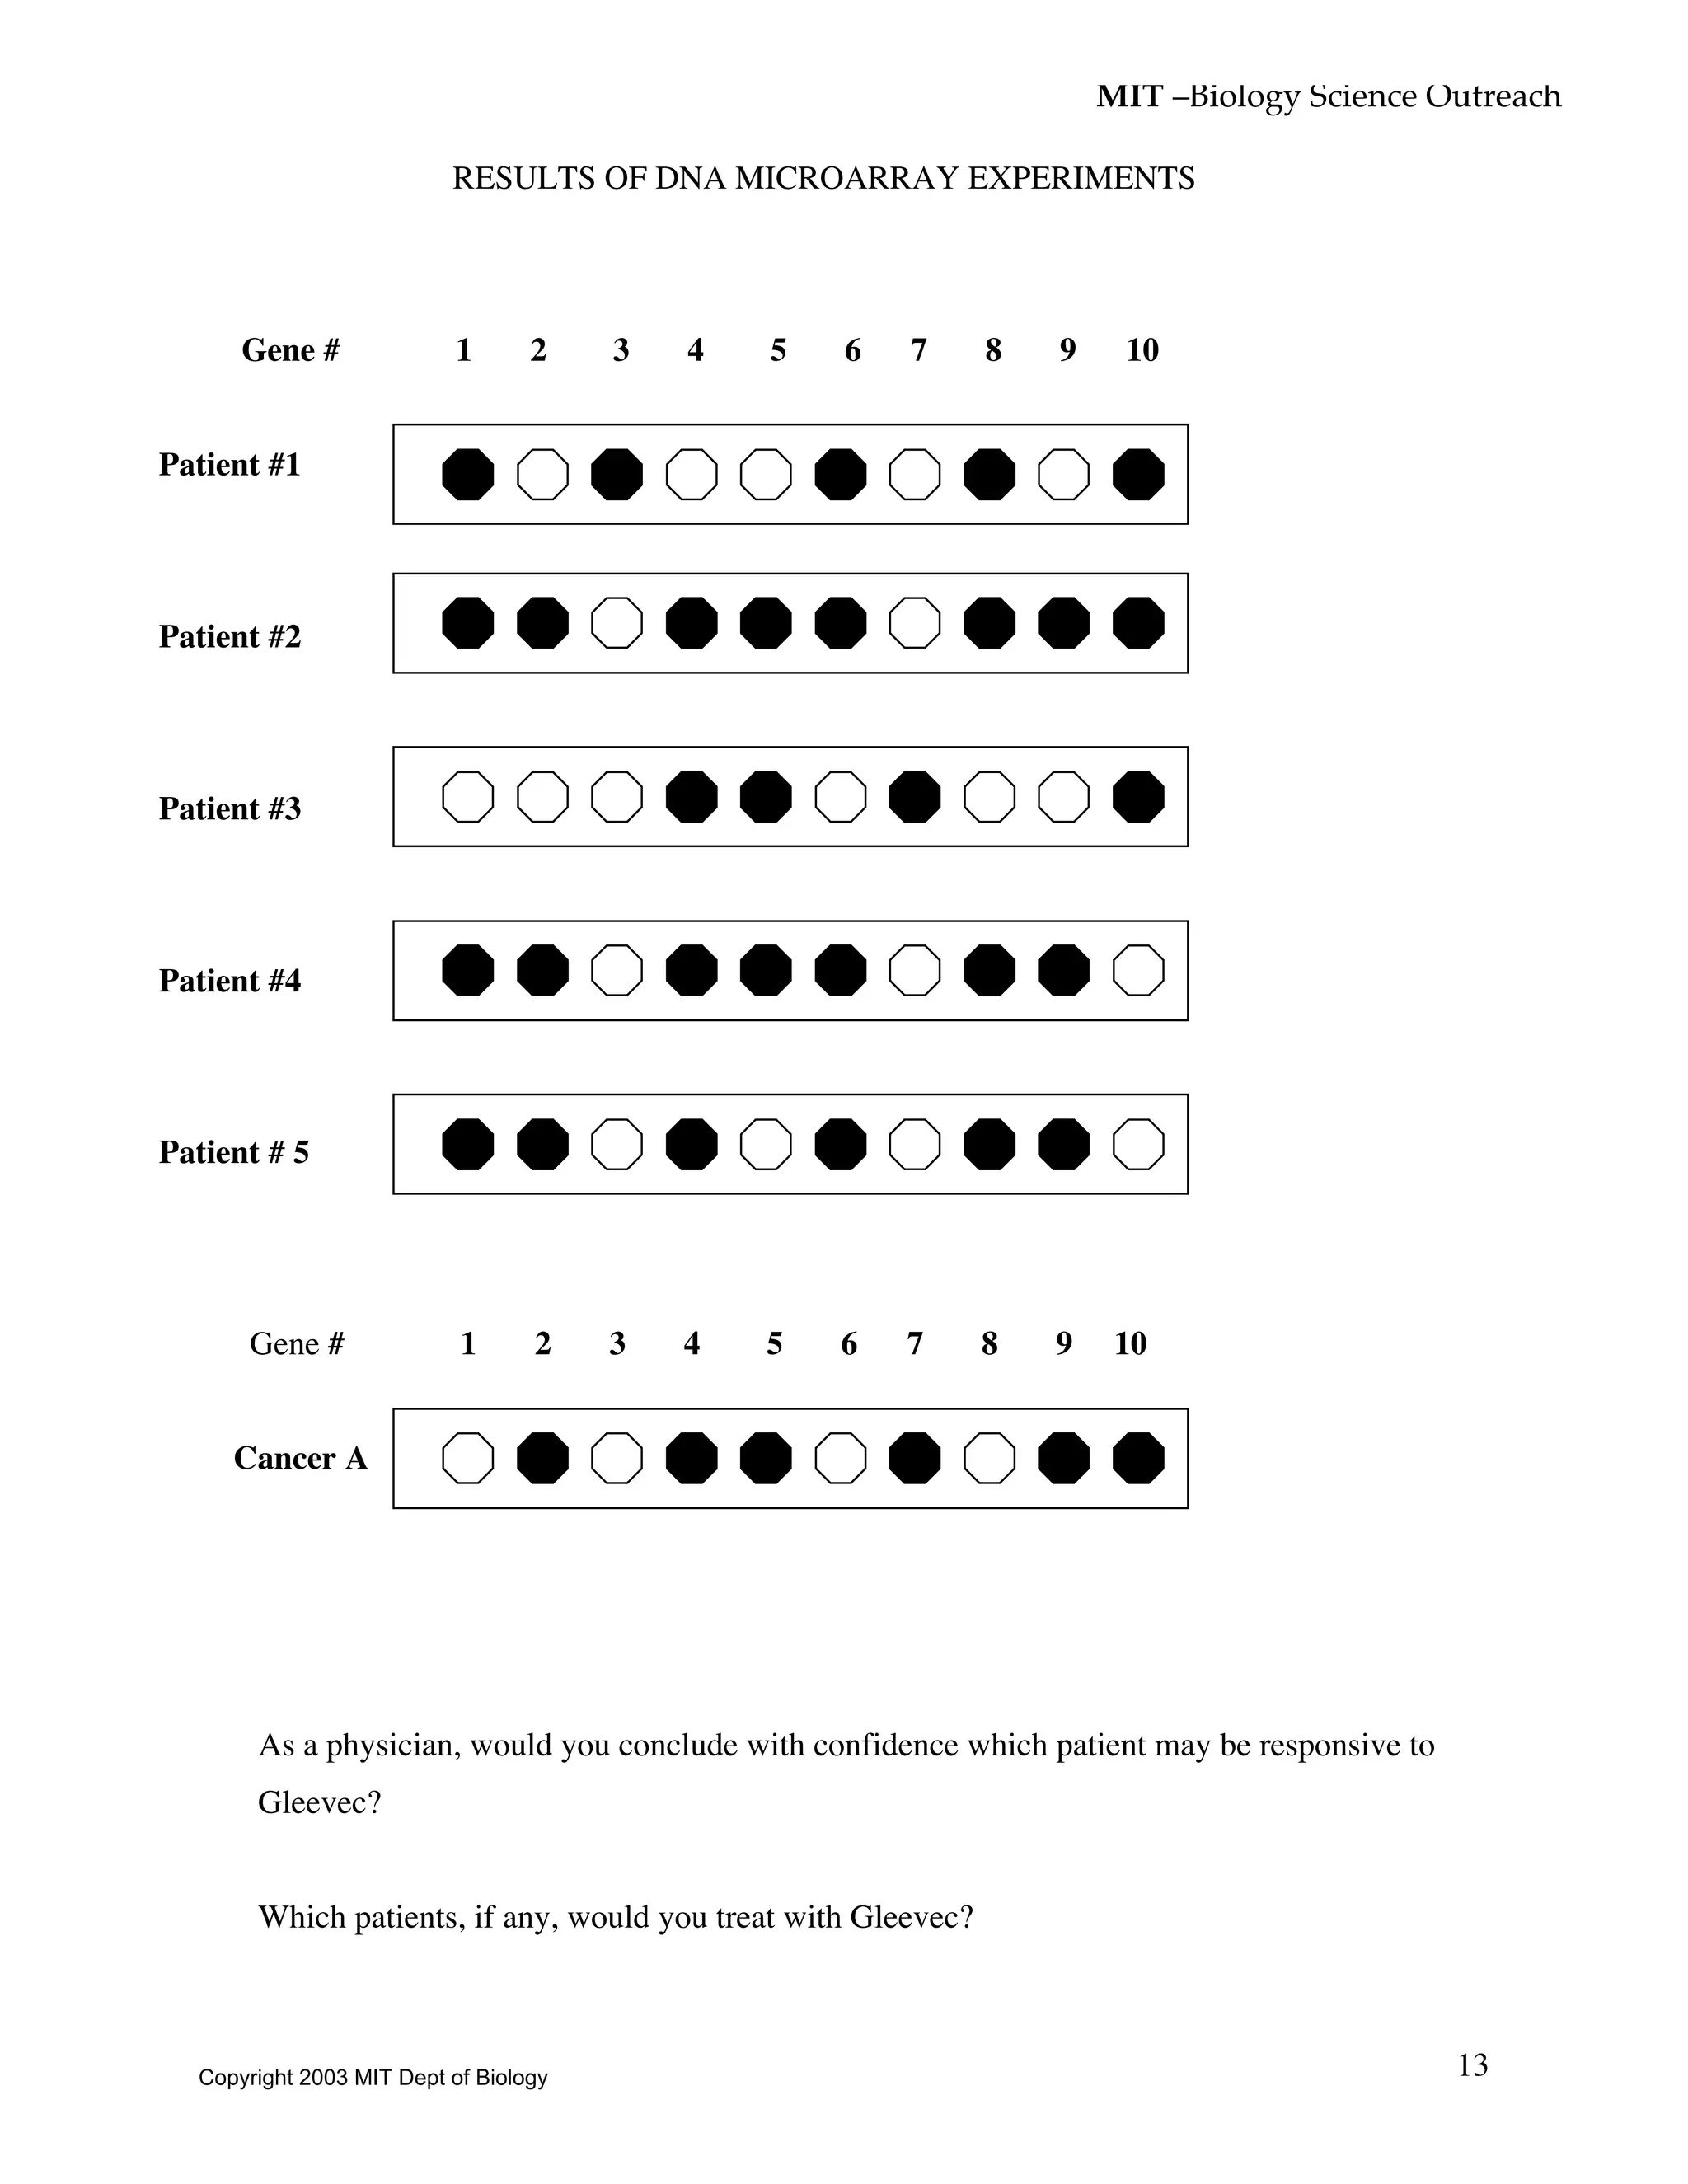
In order for students to observe a specific pattern of gene expression associated with a disease, there
need to be at least 4 DNA chips, one for each cancer patient. Students representing genes on a
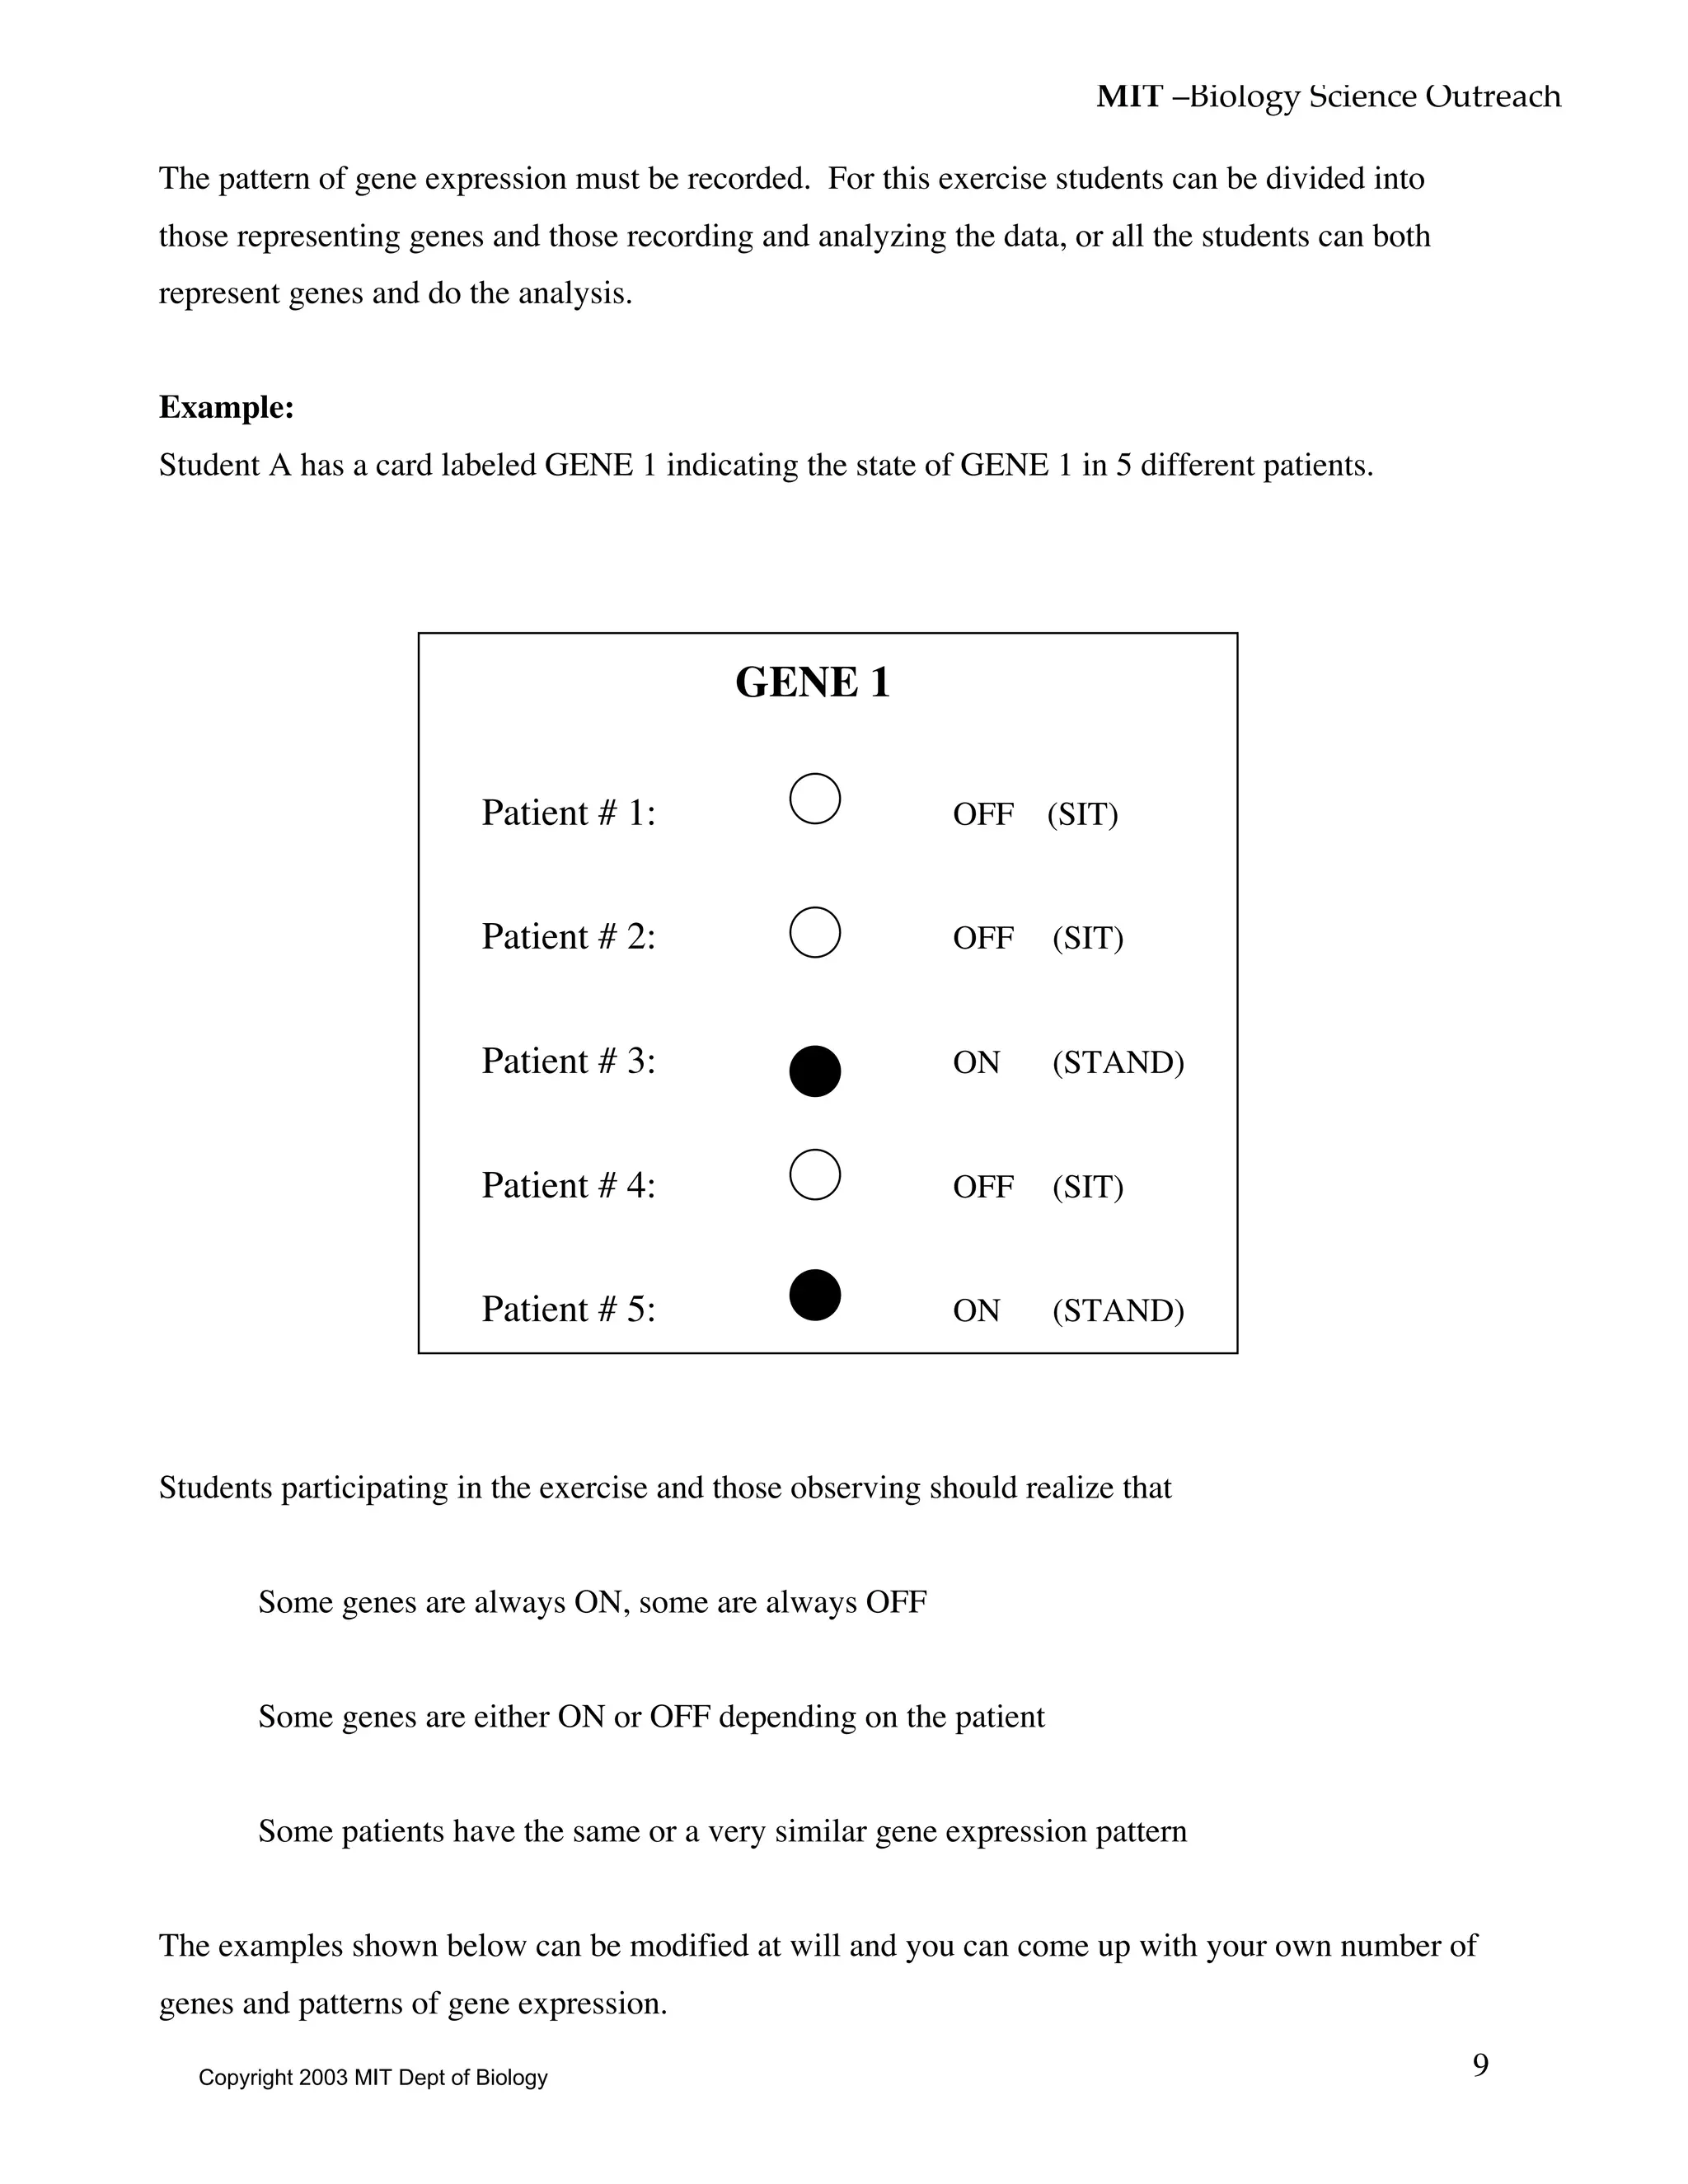
DNA chip will each receive a card that indicates the state of their gene (ON [black circle] or OFF
[white circle]) for individual patients. Students representing genes will line up (with a chair behind
them). The students will act out gene expression for the first patient, then the next and so on.
Copyright 2003 MIT Dept of Biology](https://image.slidesharecdn.com/dnamicroarray-150320025444-conversion-gate01/75/Dn-amicroarray-8-2048.jpg)


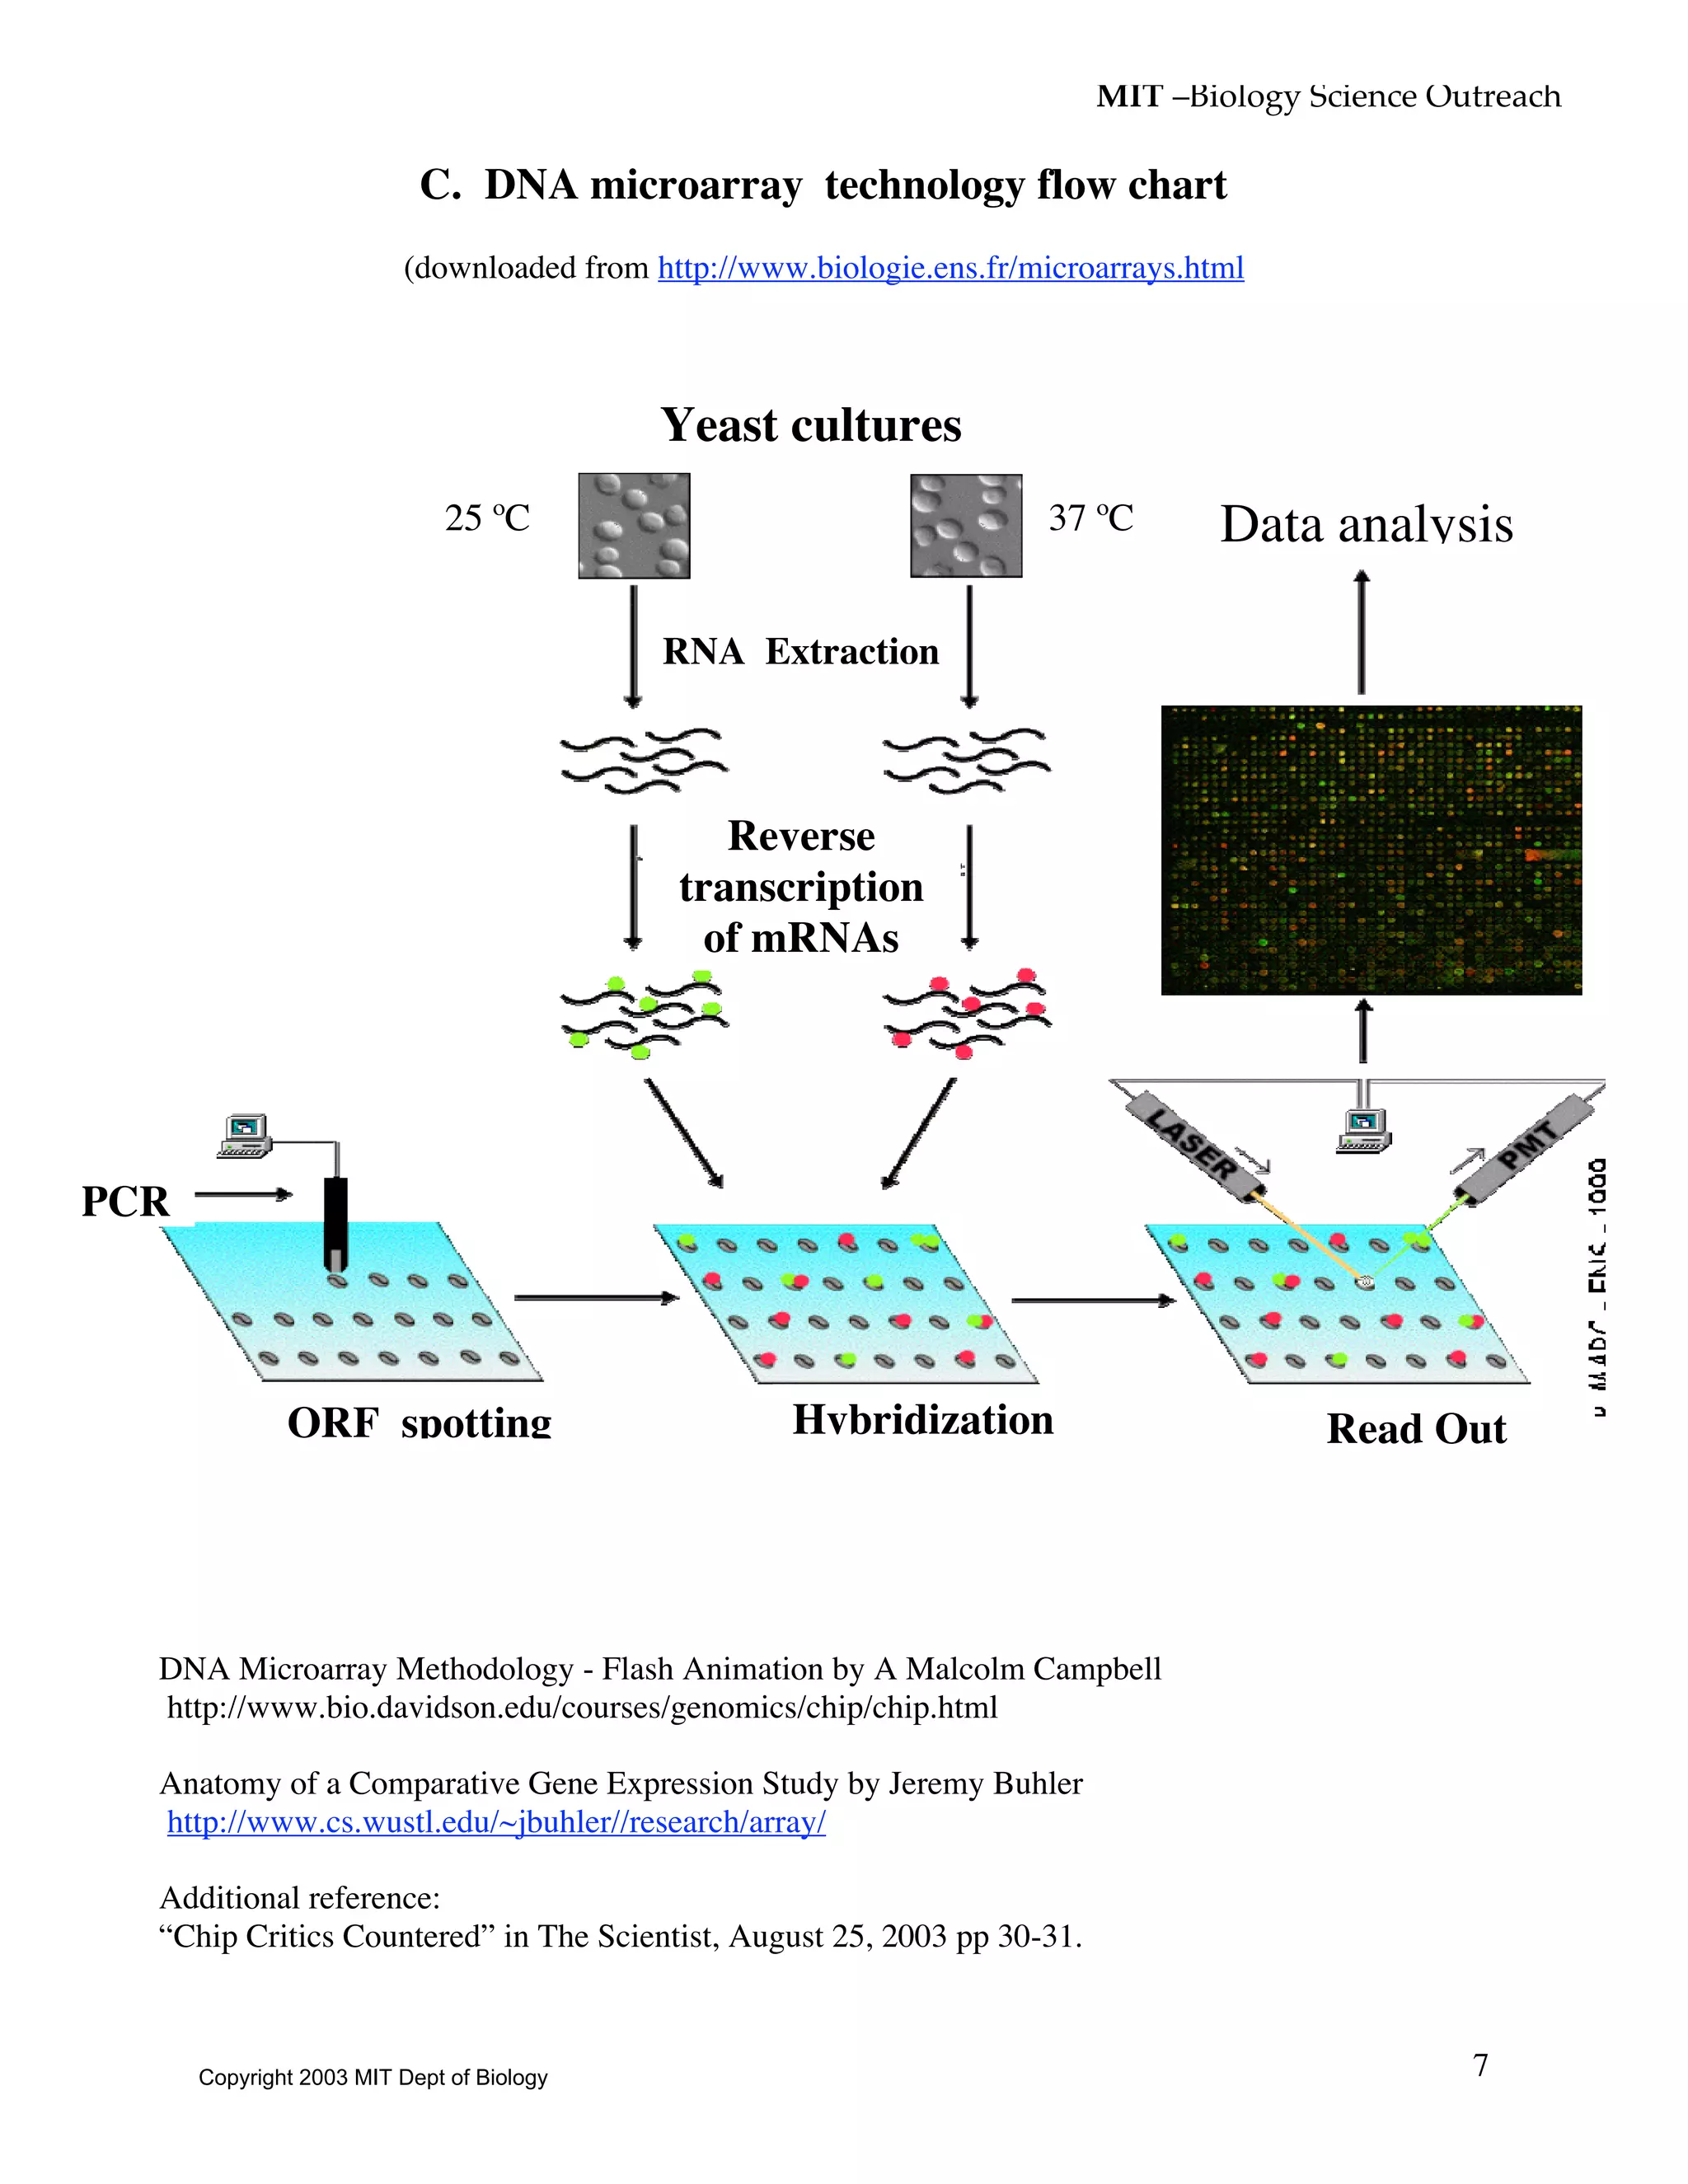
DNA microarrays allow researchers to analyze the expression levels of many genes simultaneously. They work by attaching DNA fragments from thousands of genes to a microchip, then measuring how much cDNA from a cell binds to each fragment. This reveals which genes are more or less active. The document describes how microarrays are prepared and used, and how the resulting gene expression data can help classify diseases and guide treatment. It proposes an interactive class exercise where students mimic genes on a microarray to recognize patterns in cancer patients' gene expression that could predict drug responses.