Download as PDF, PPTX
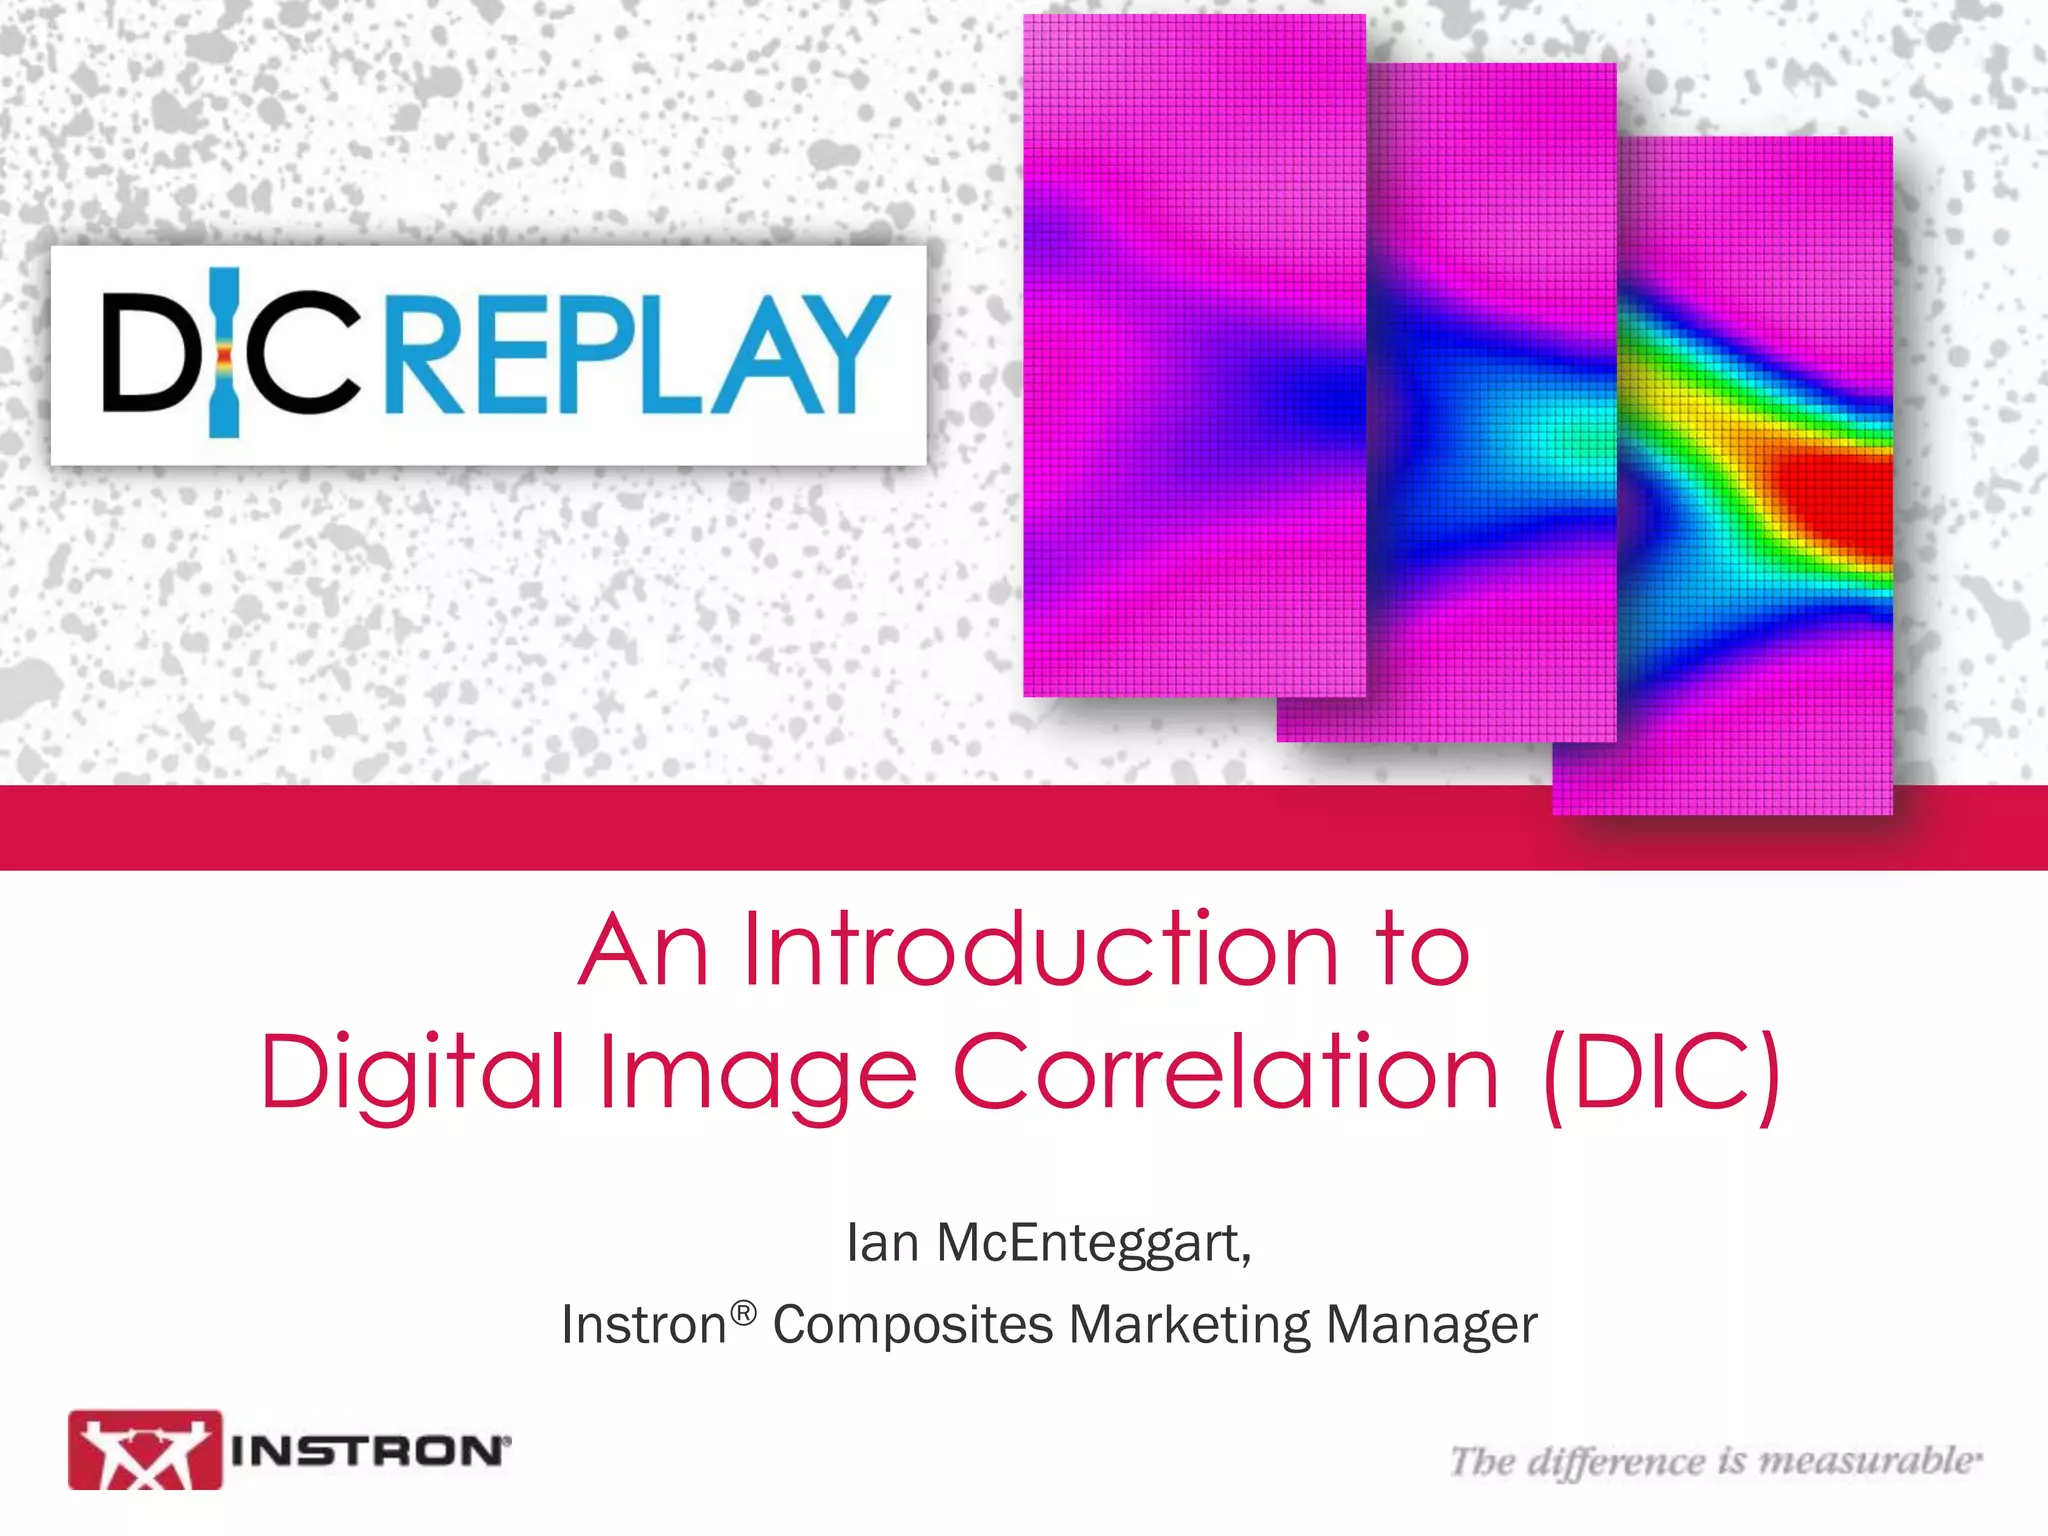

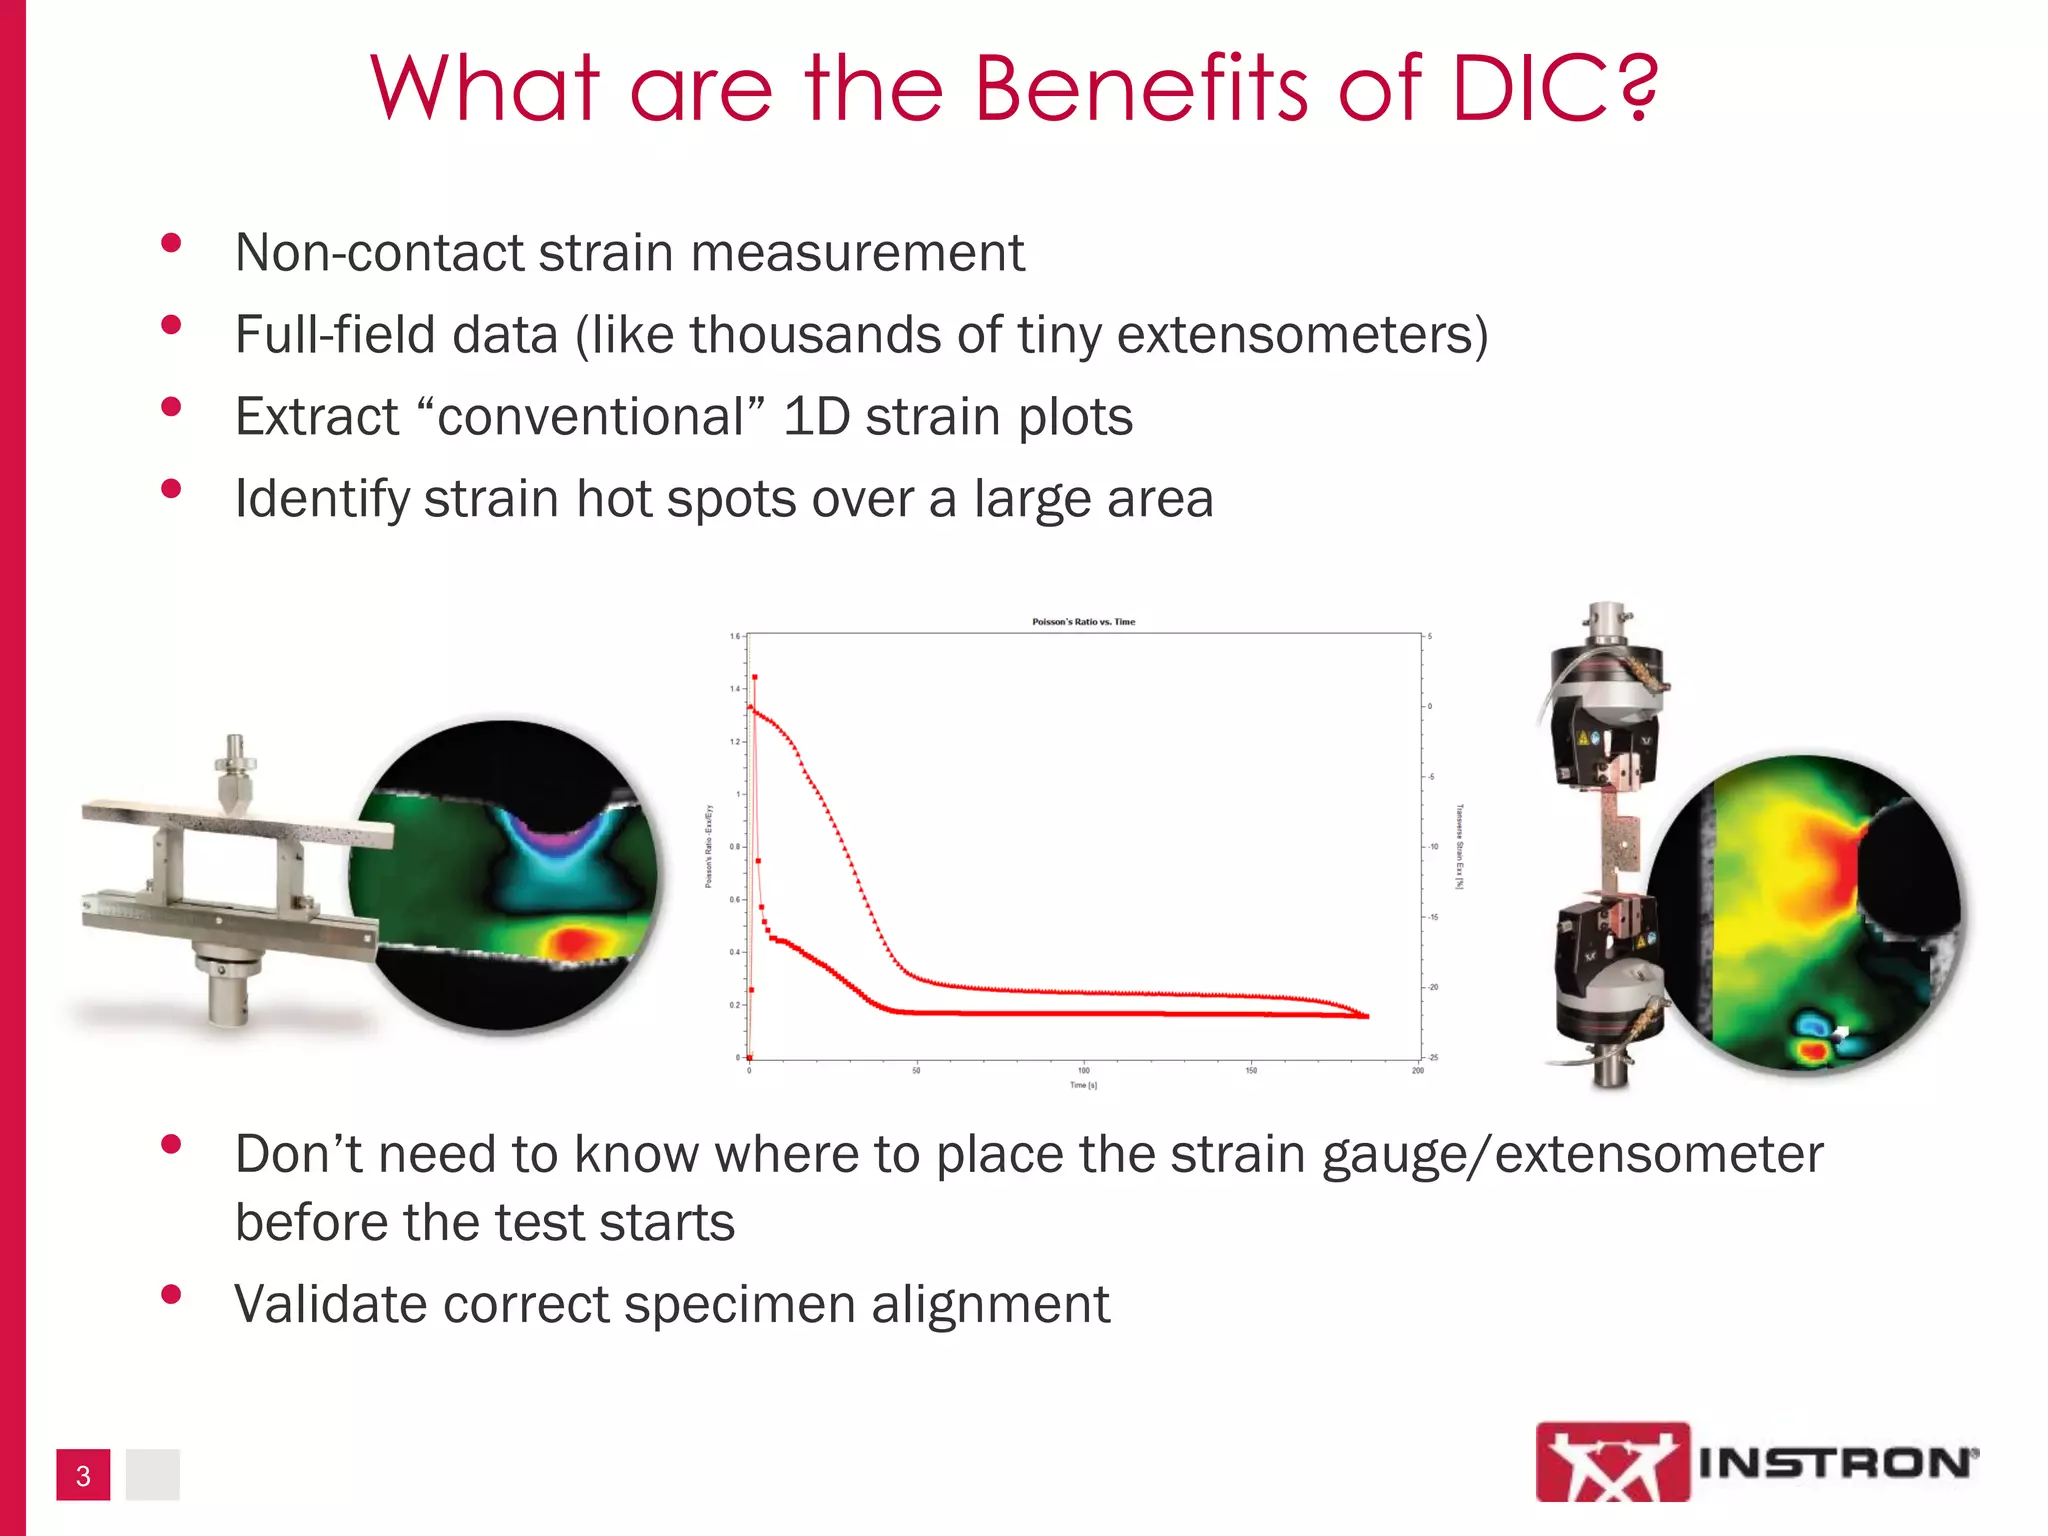
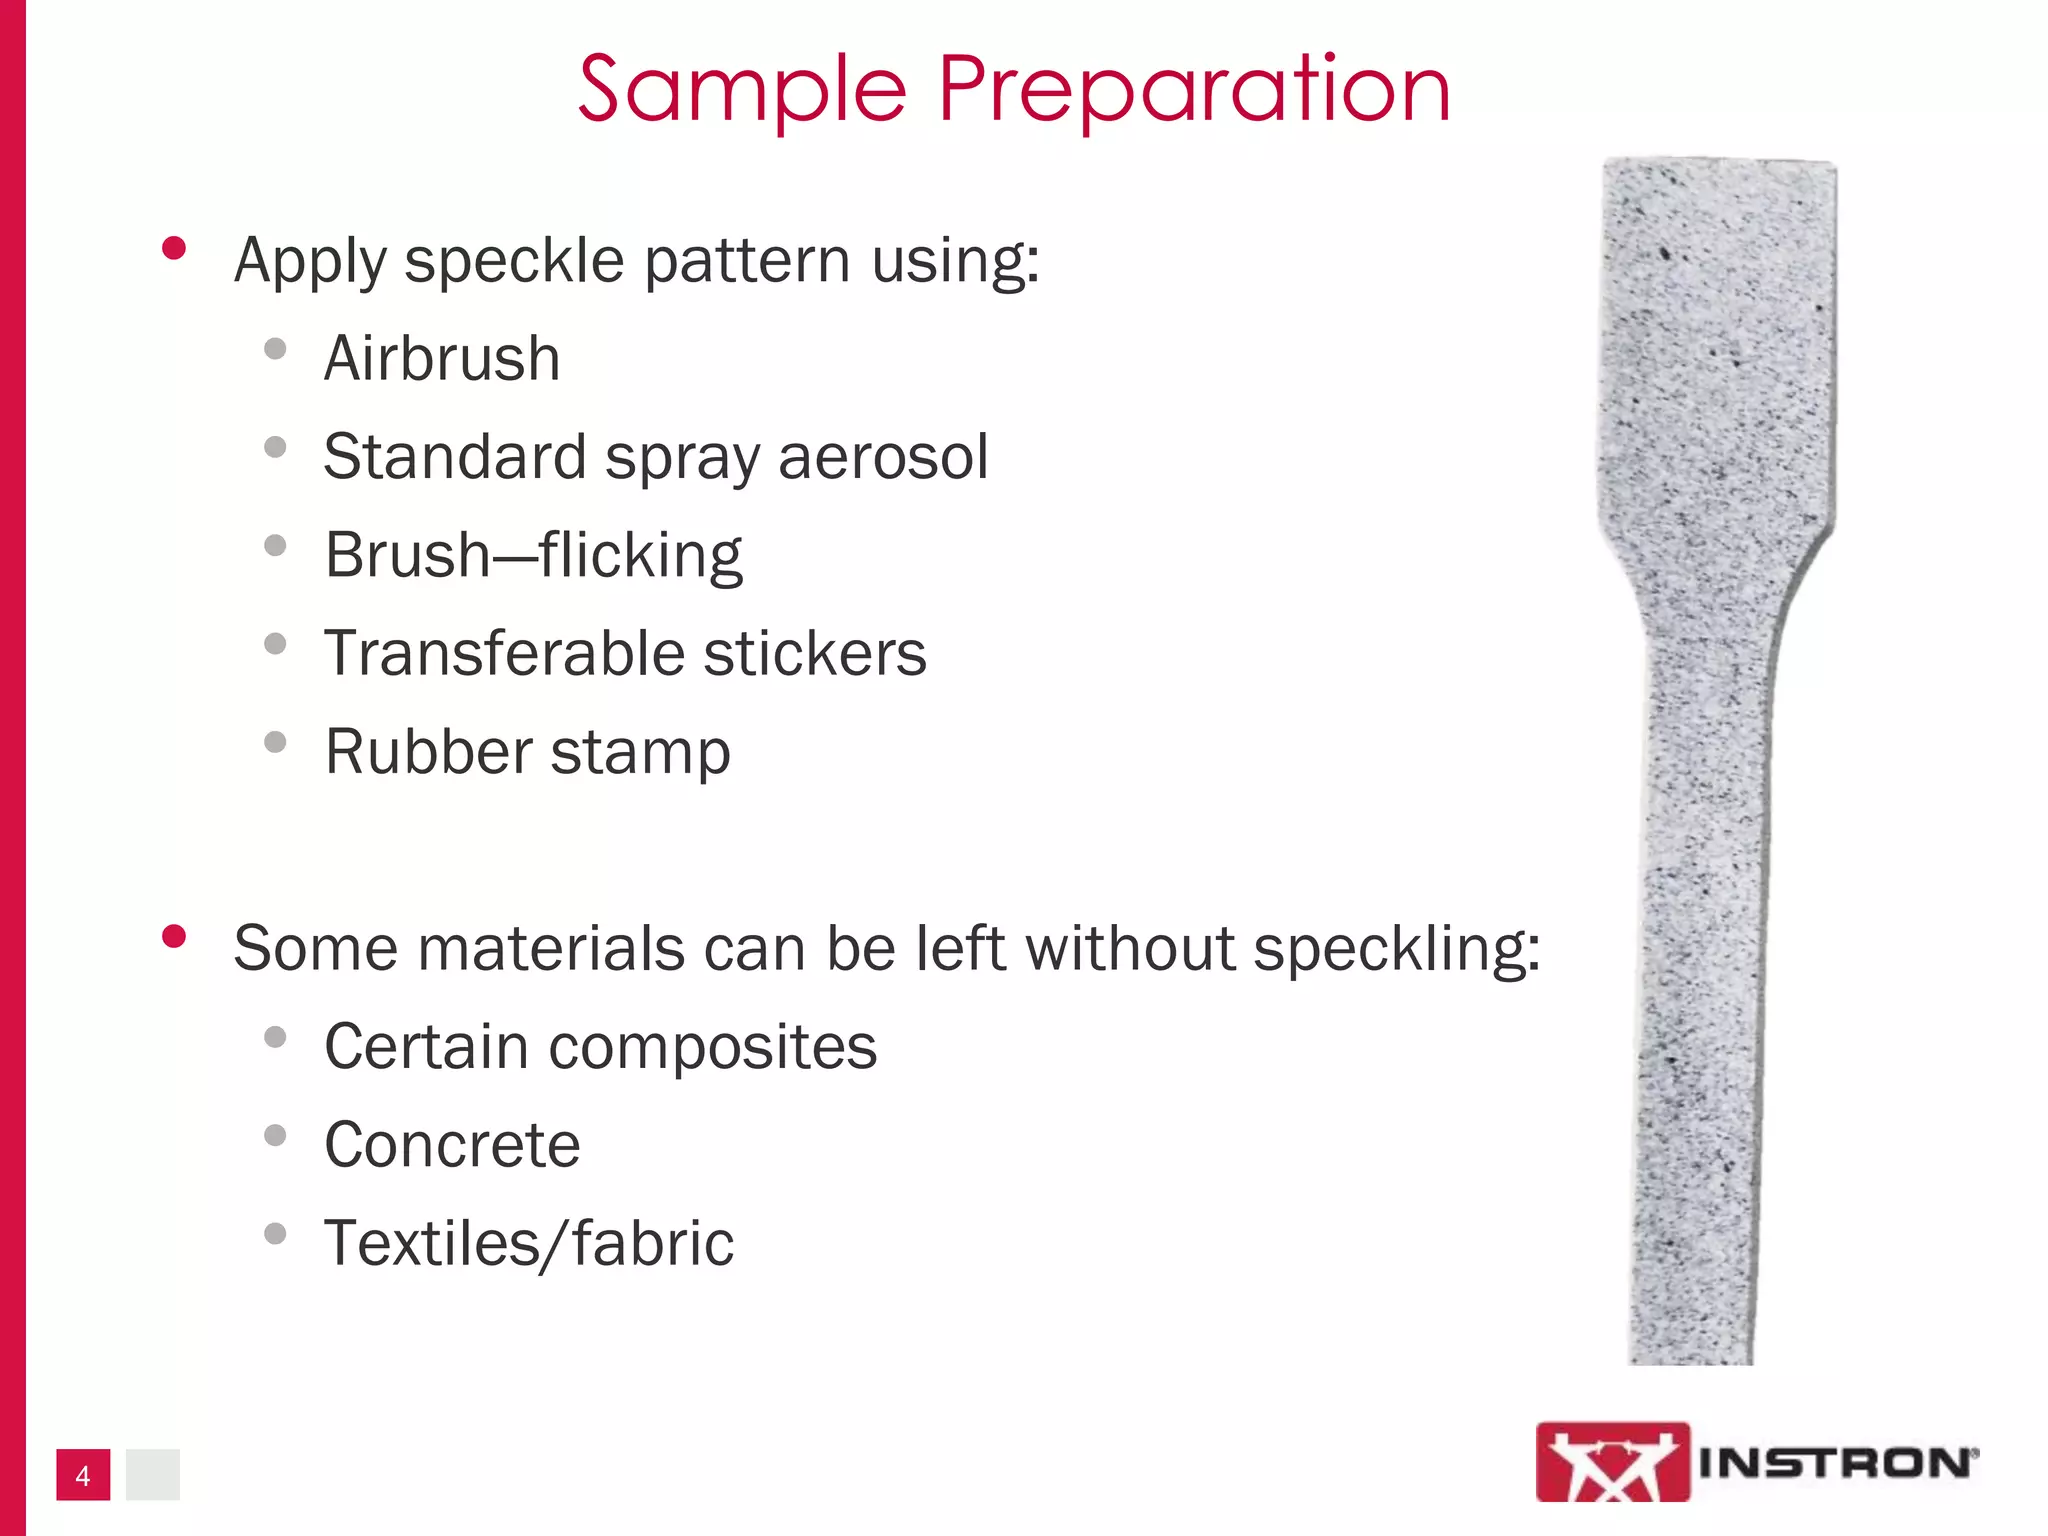
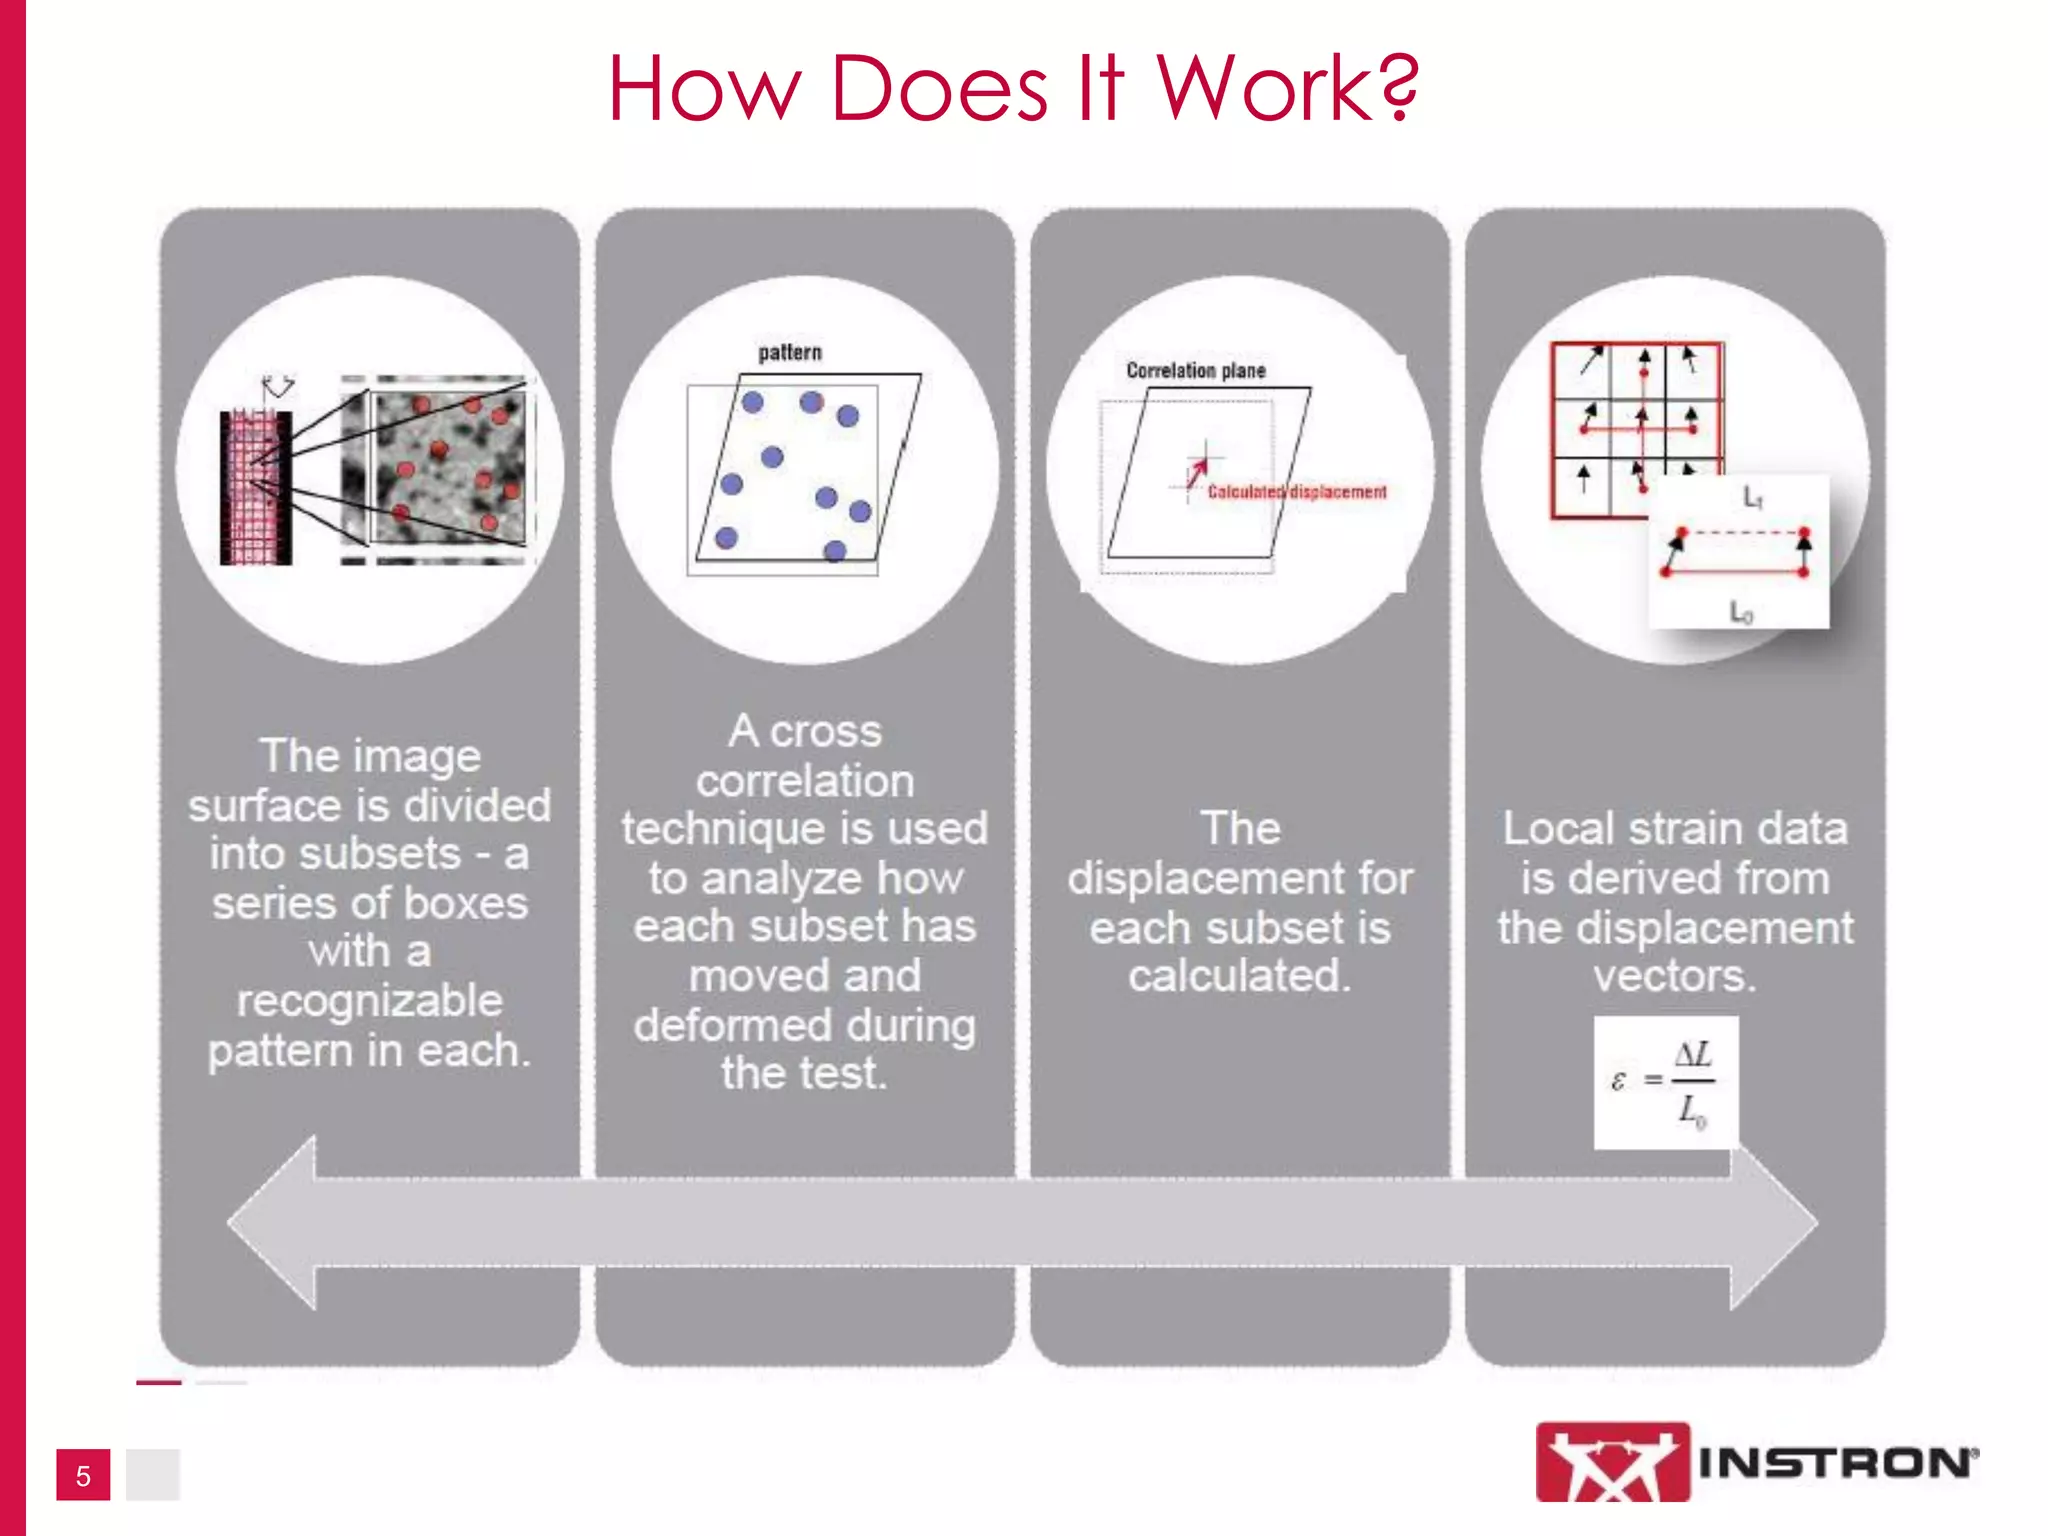
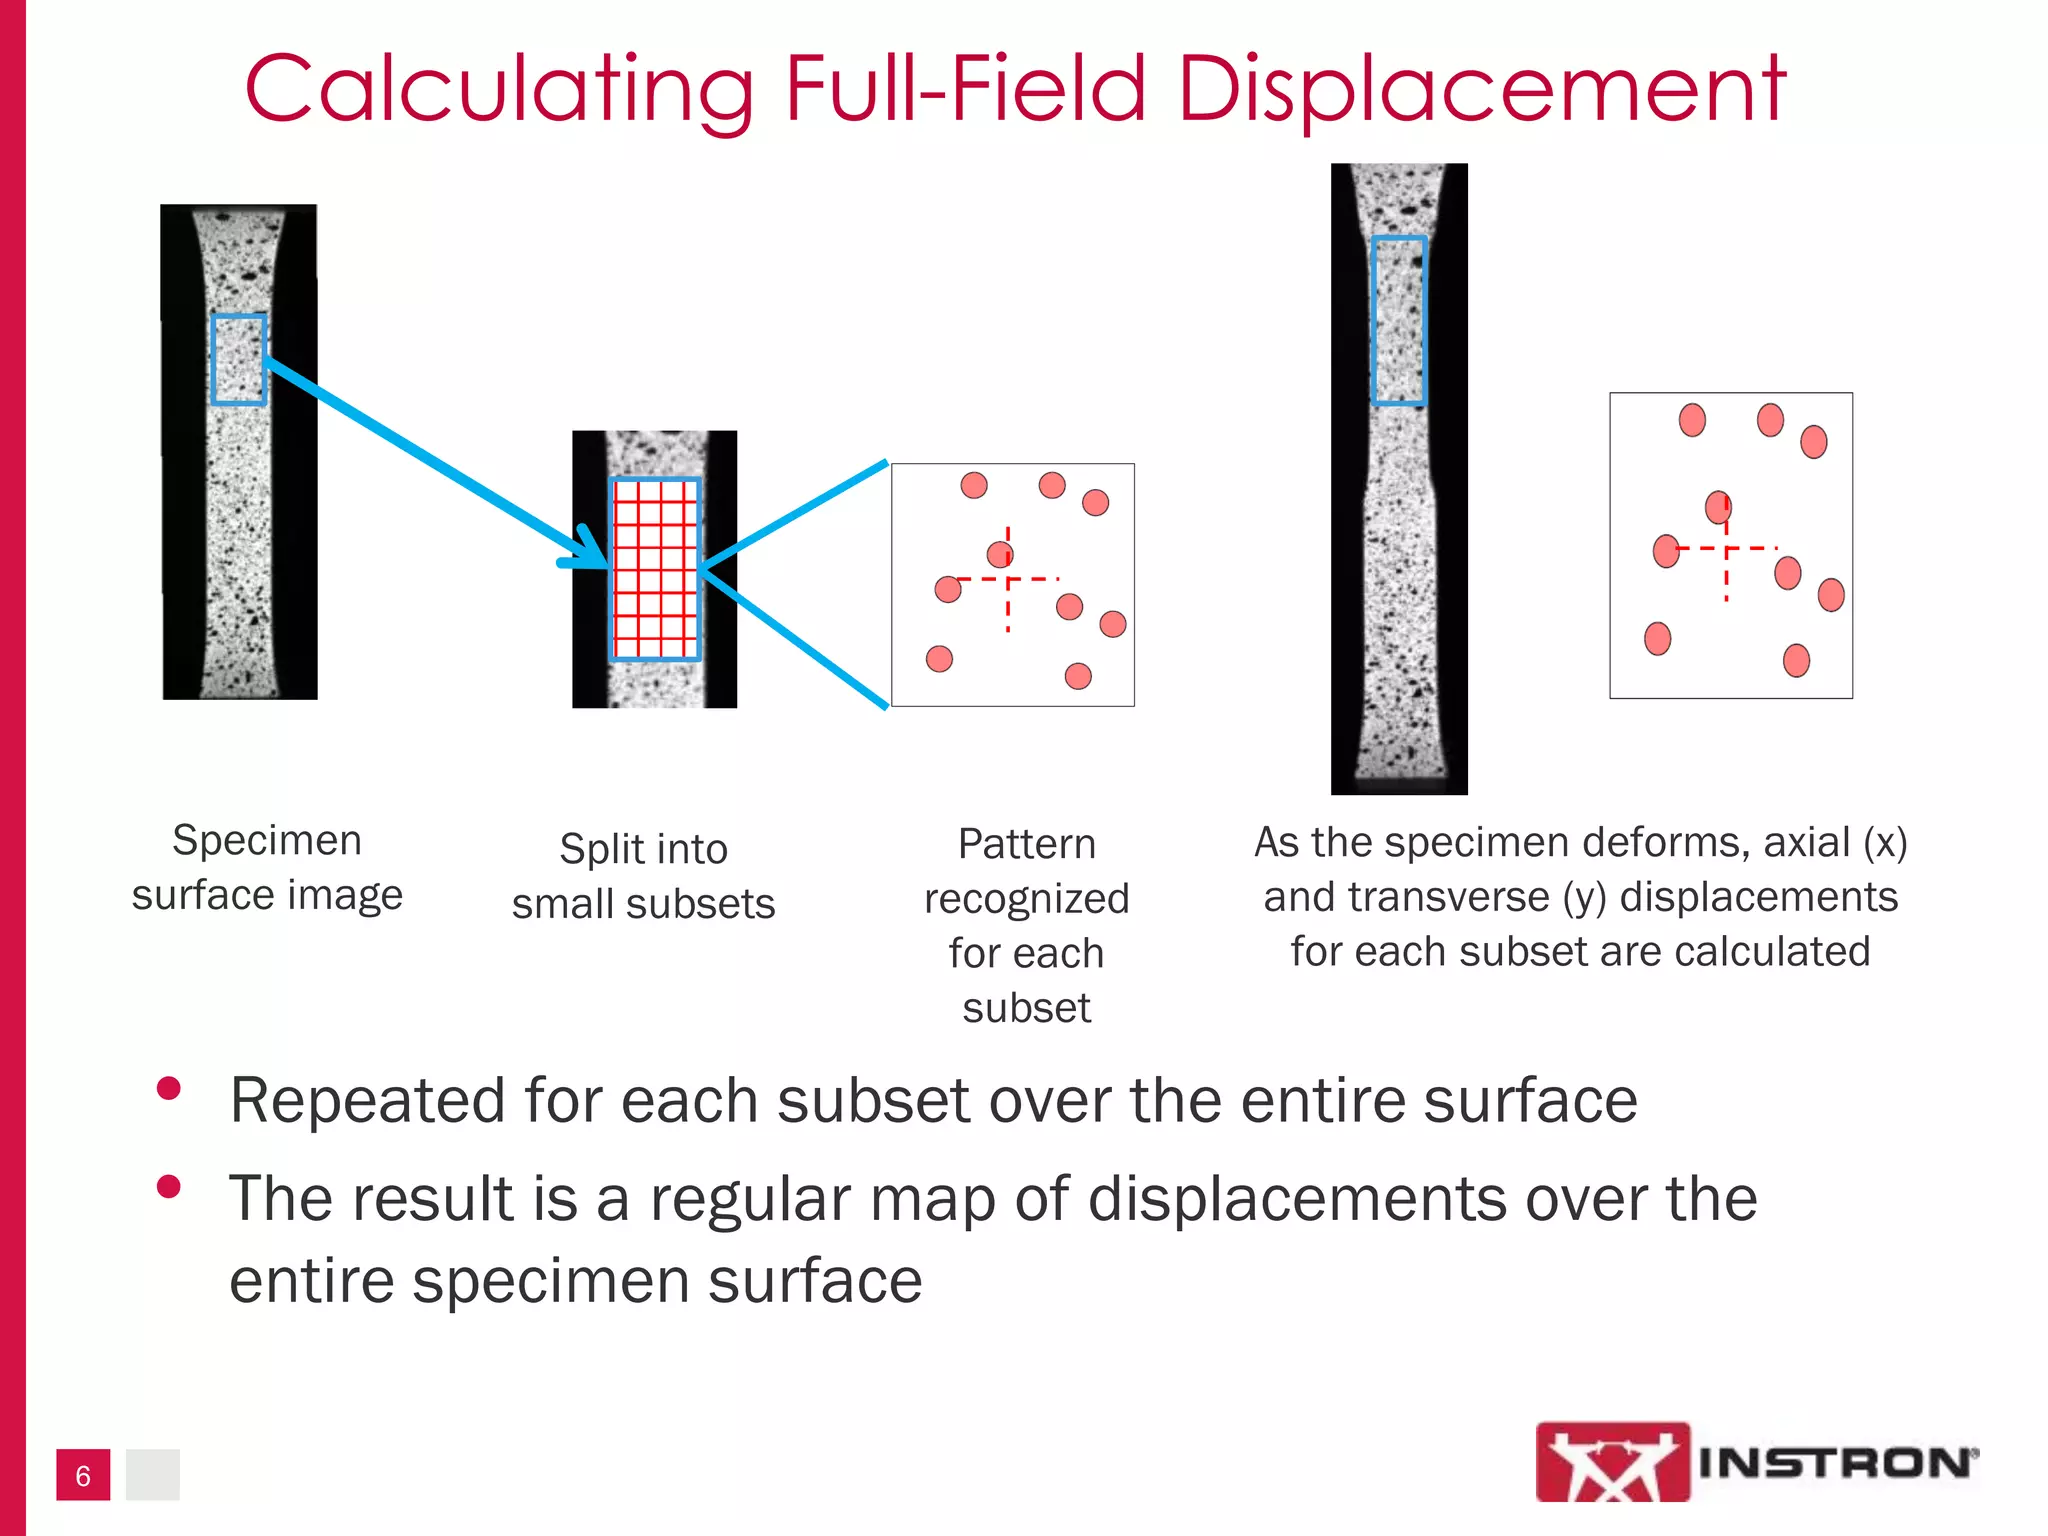
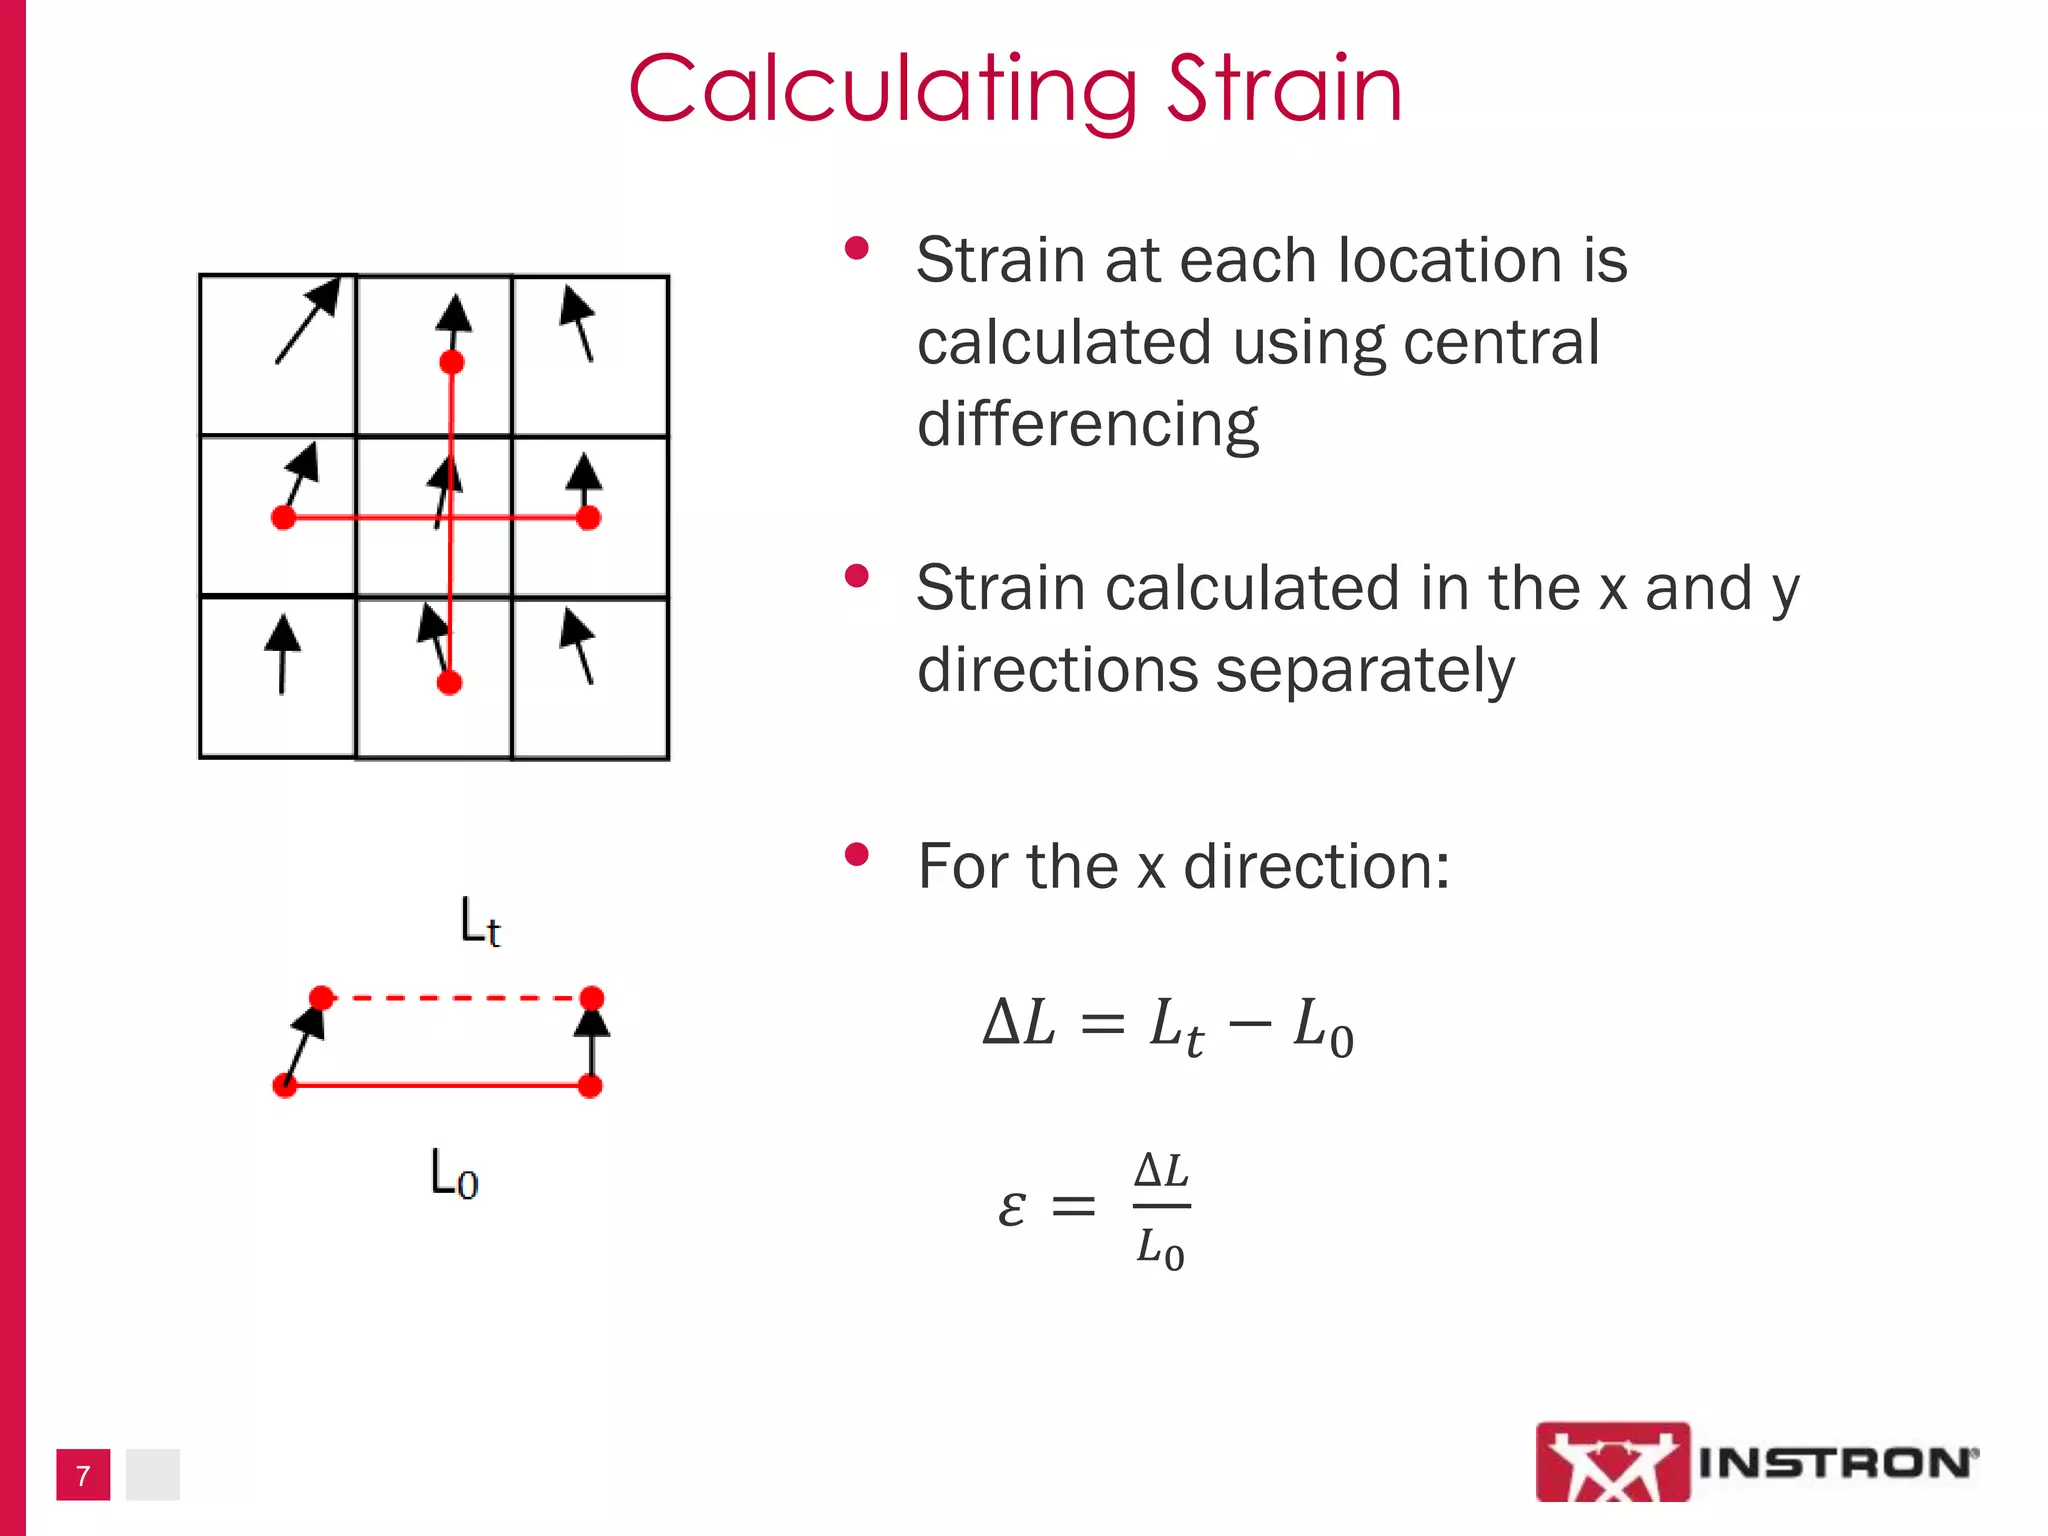
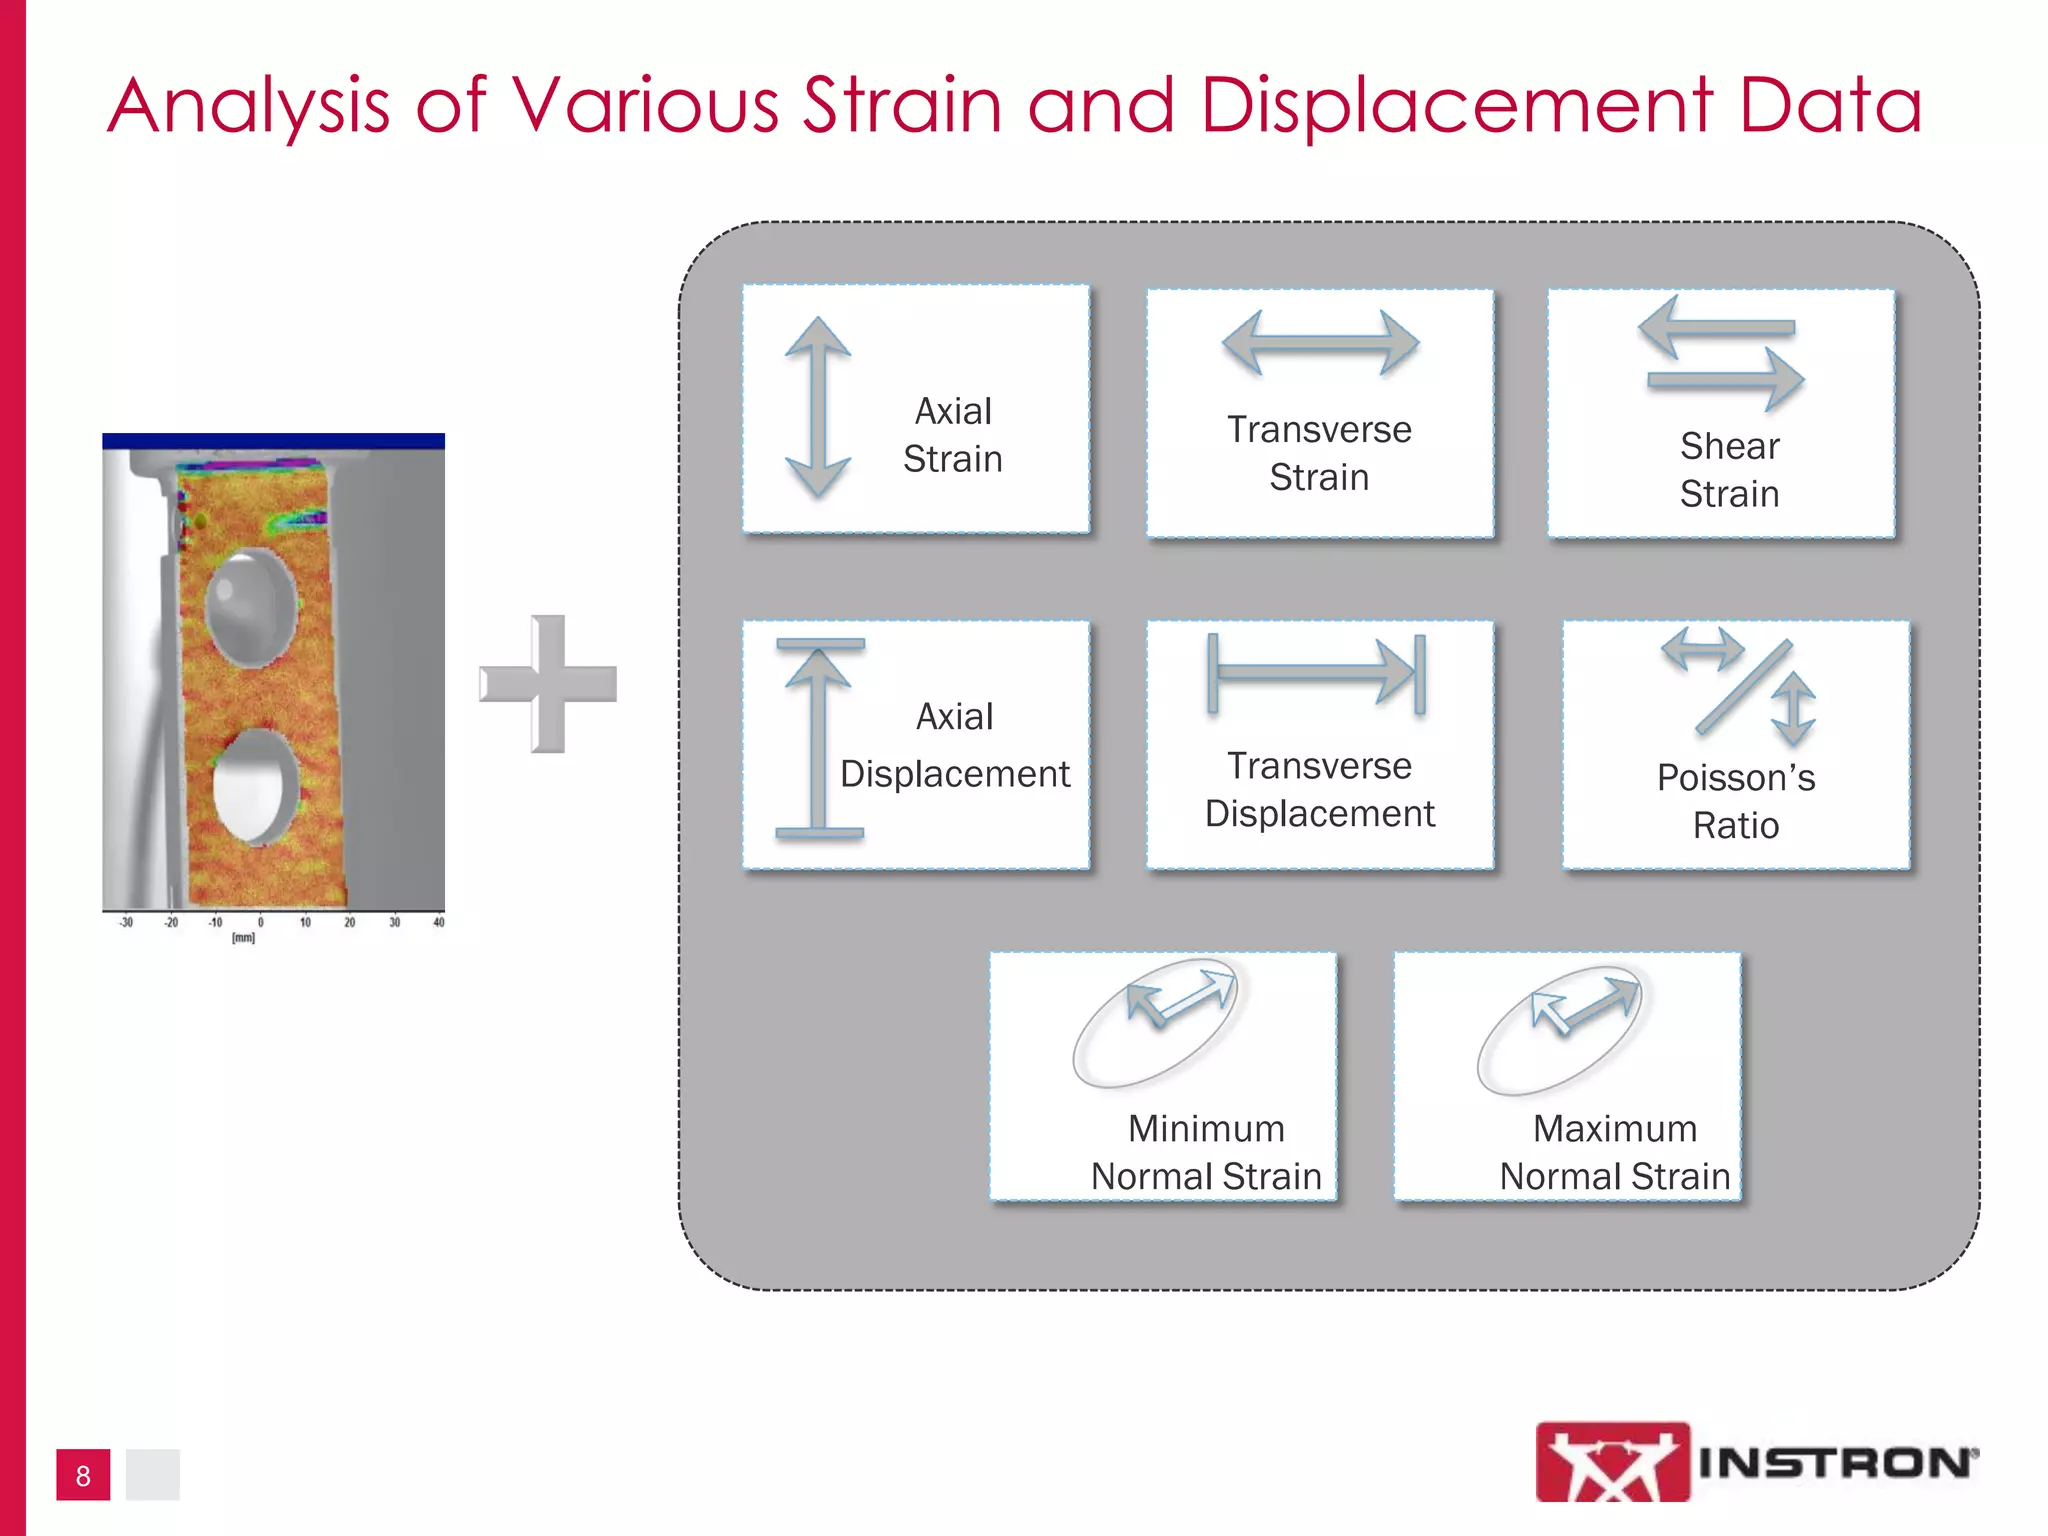
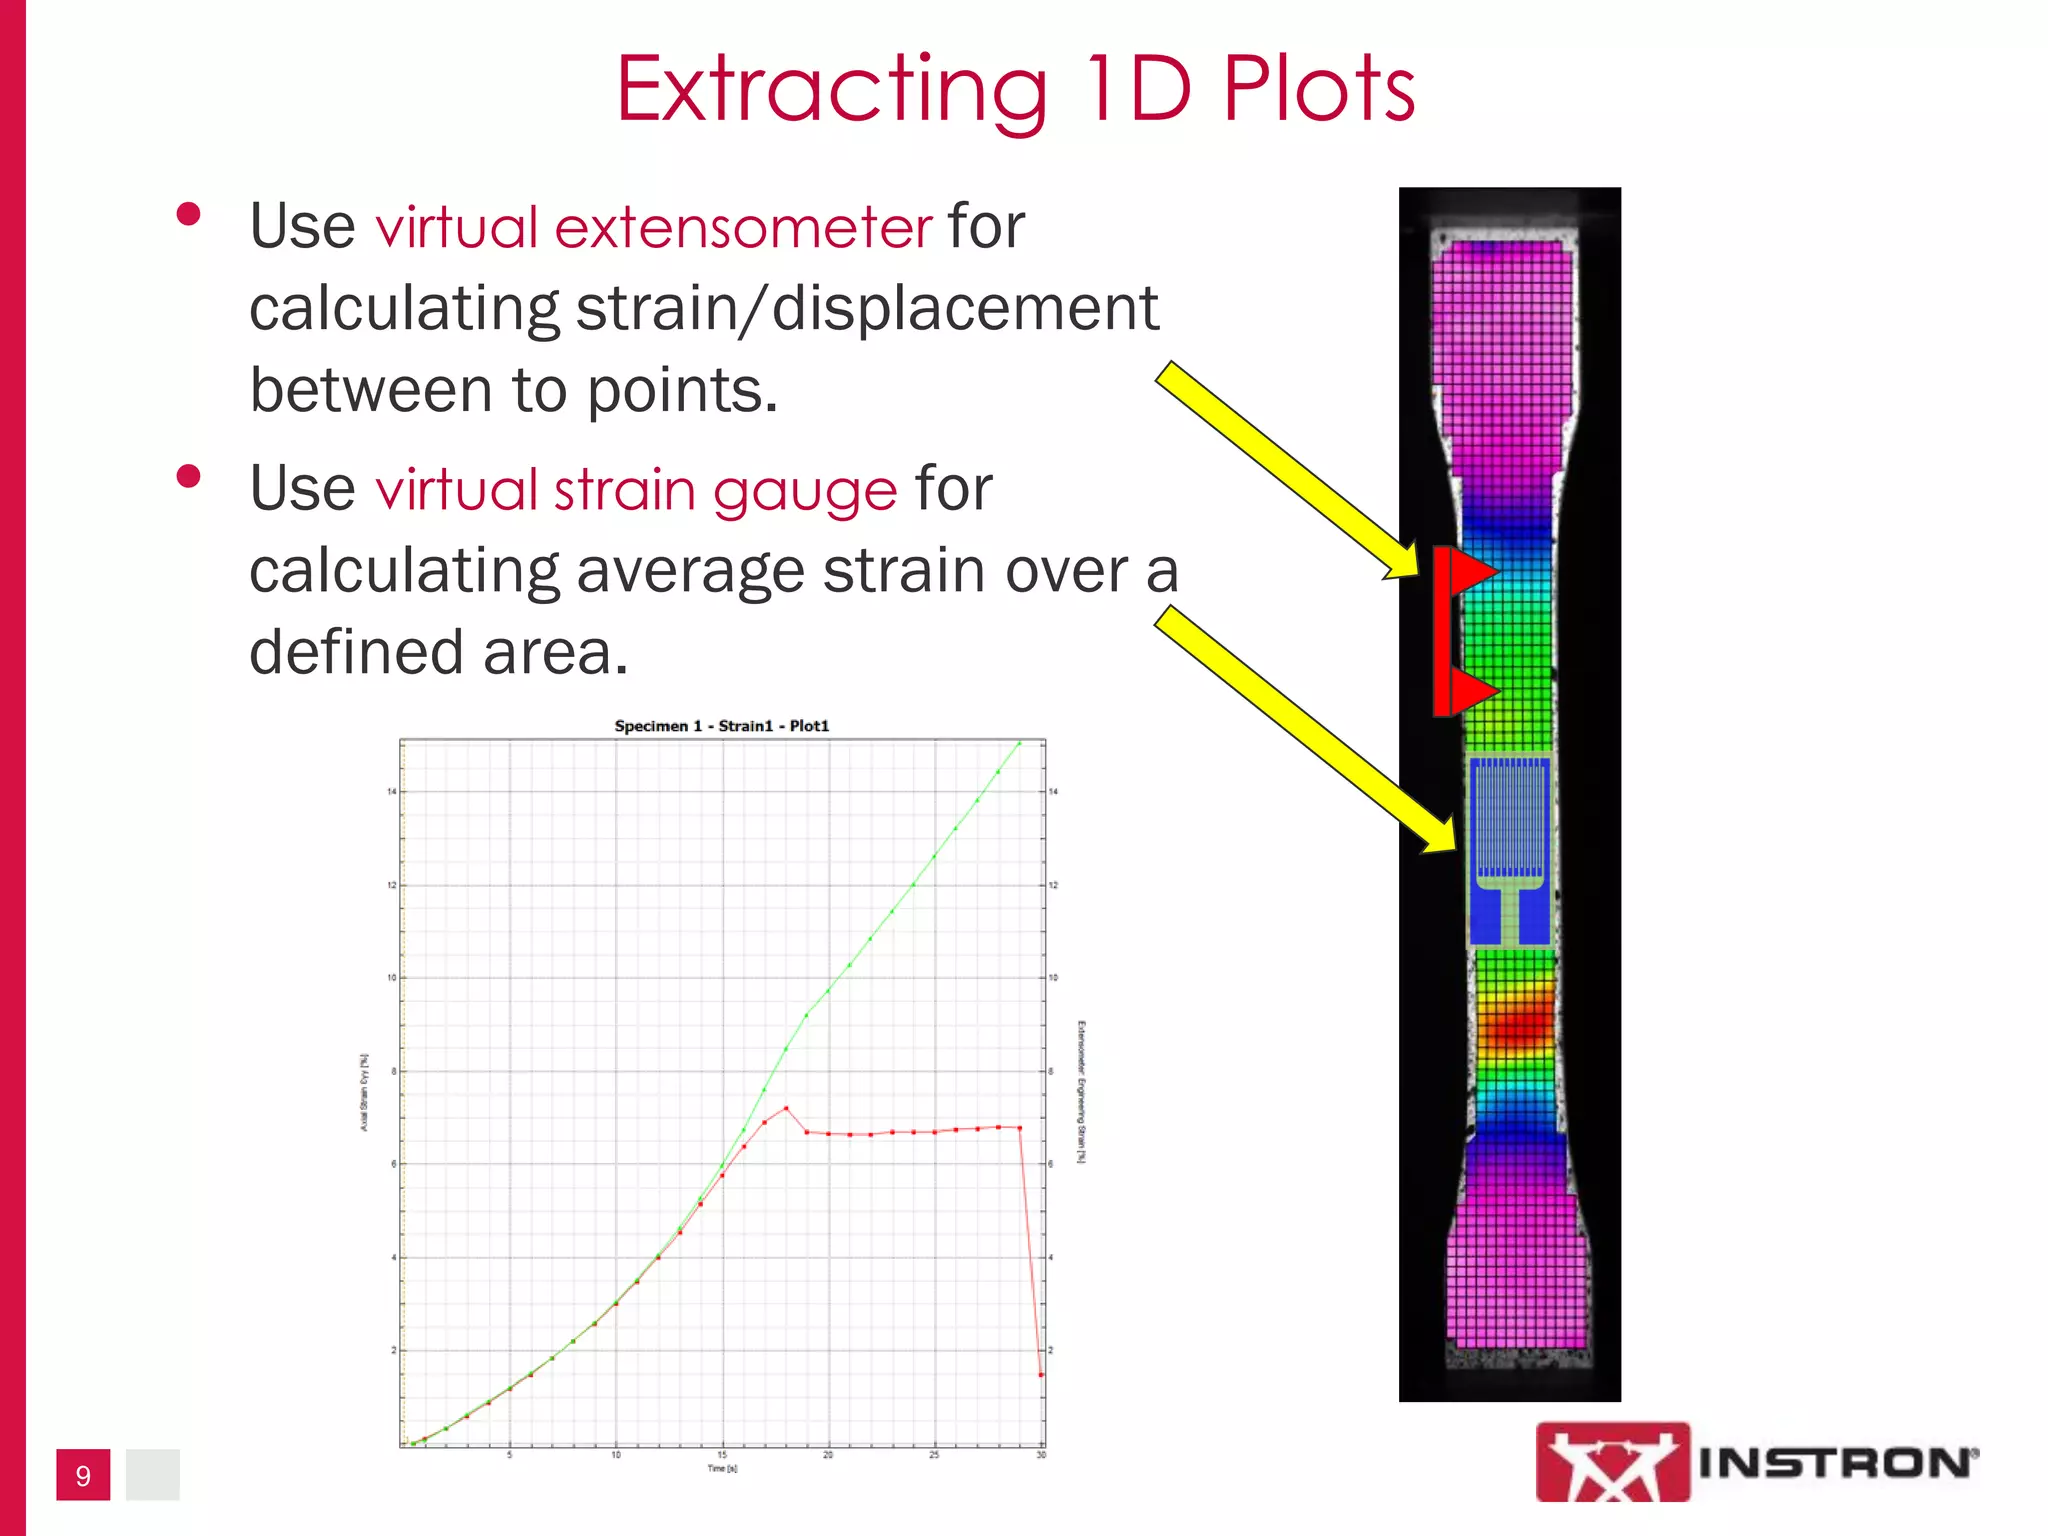

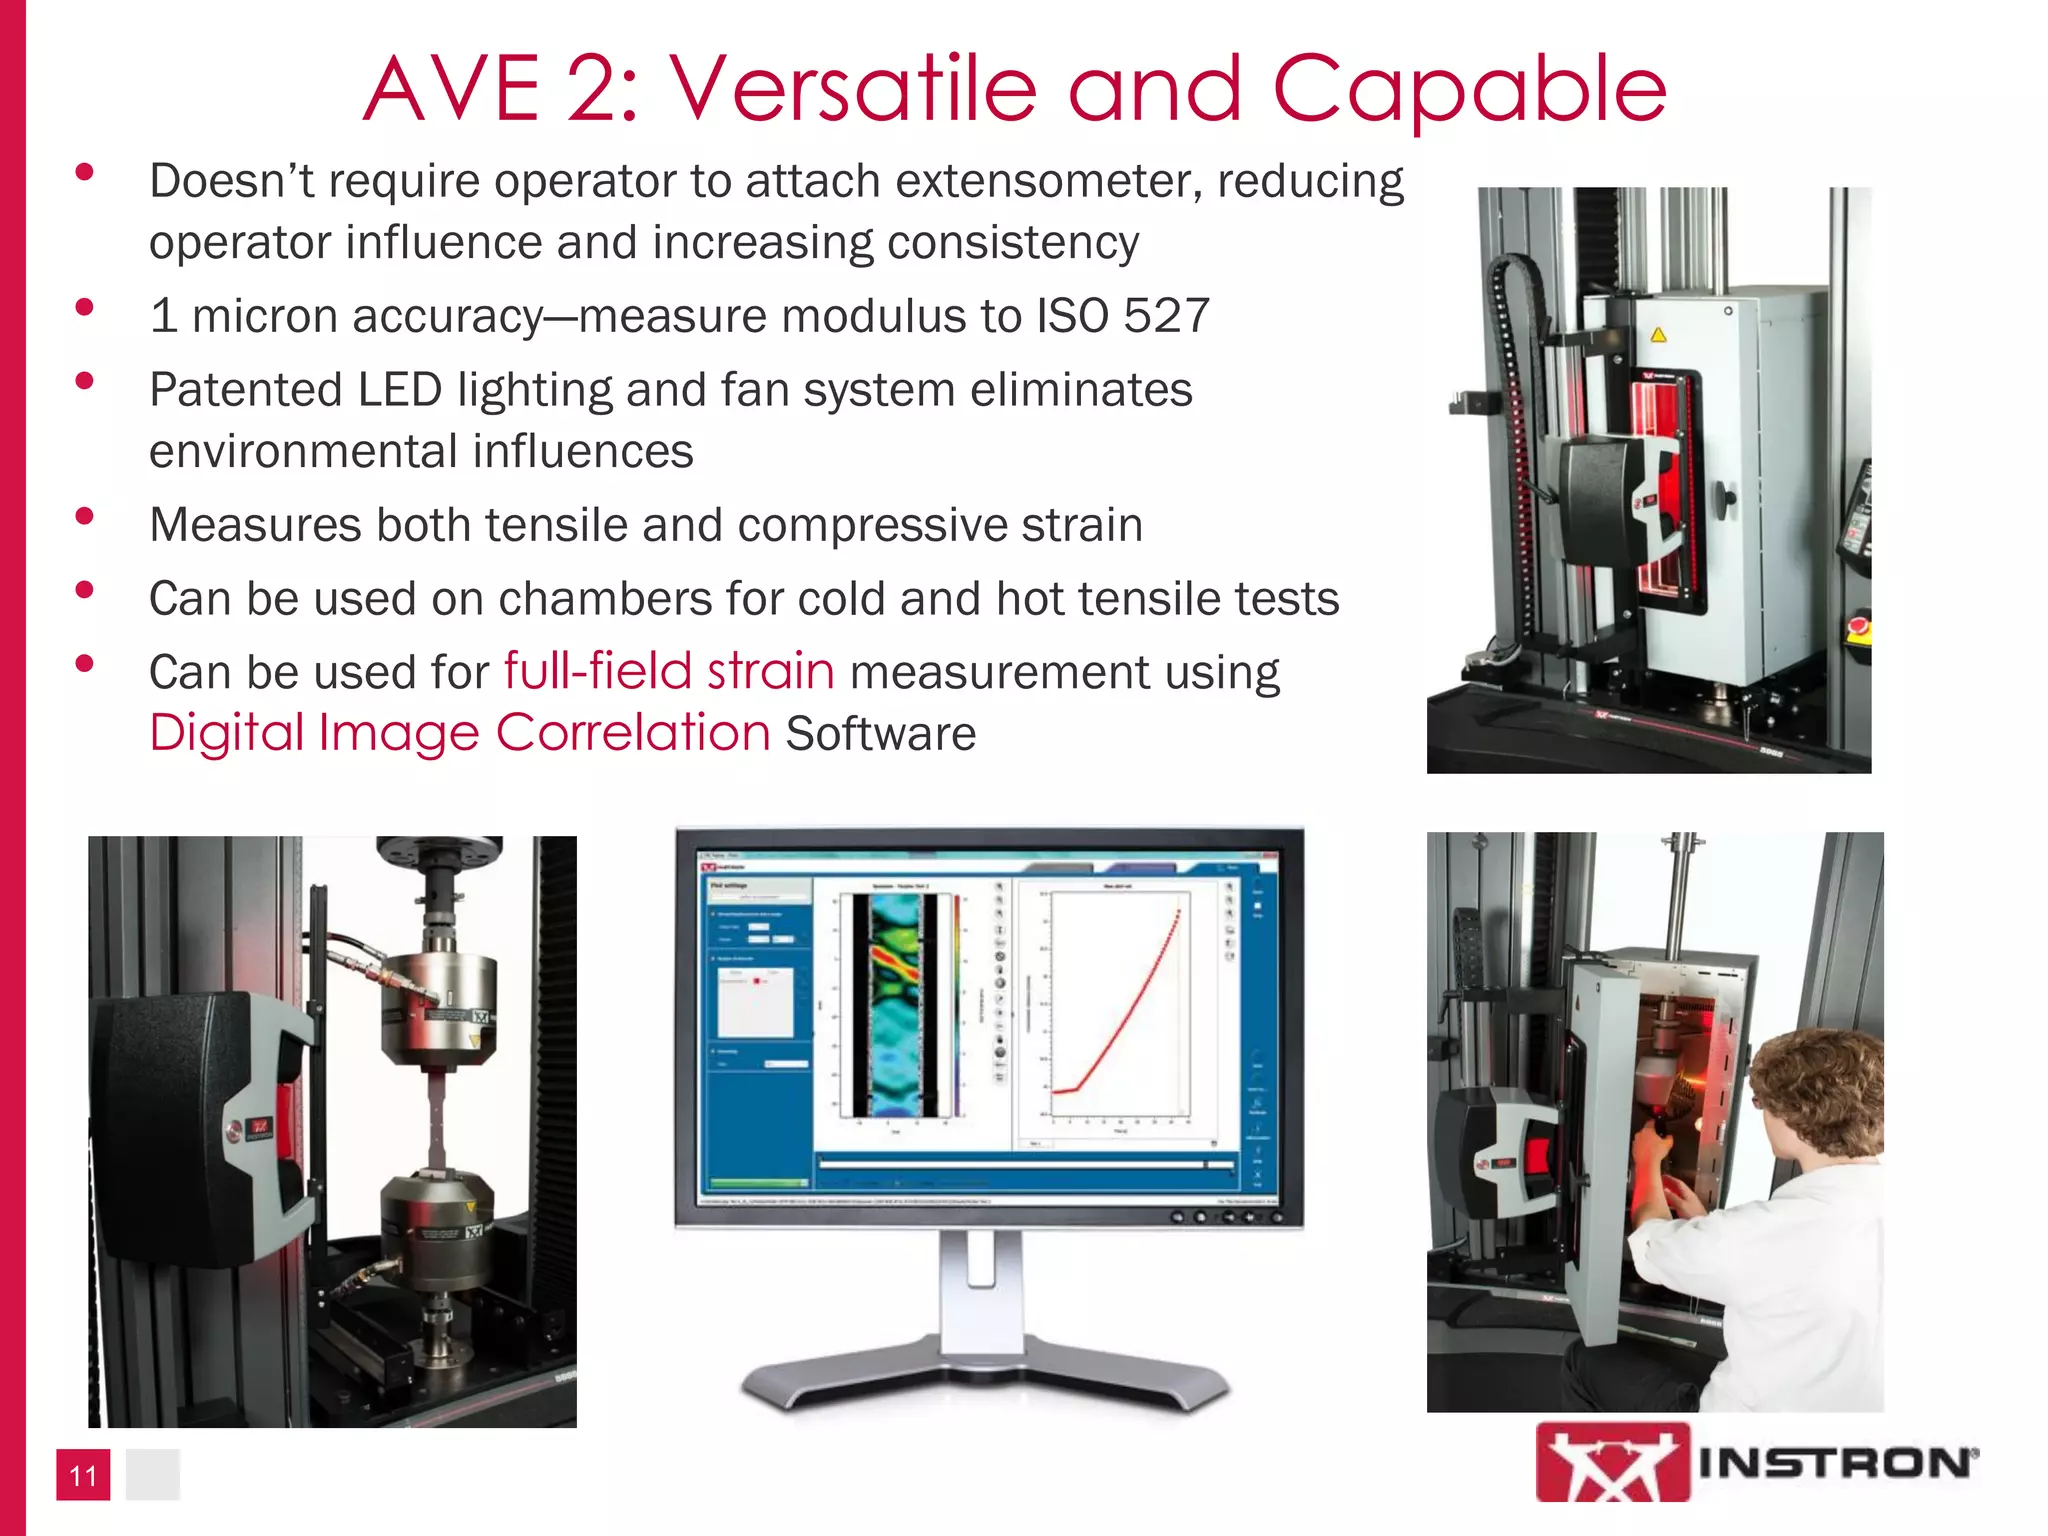
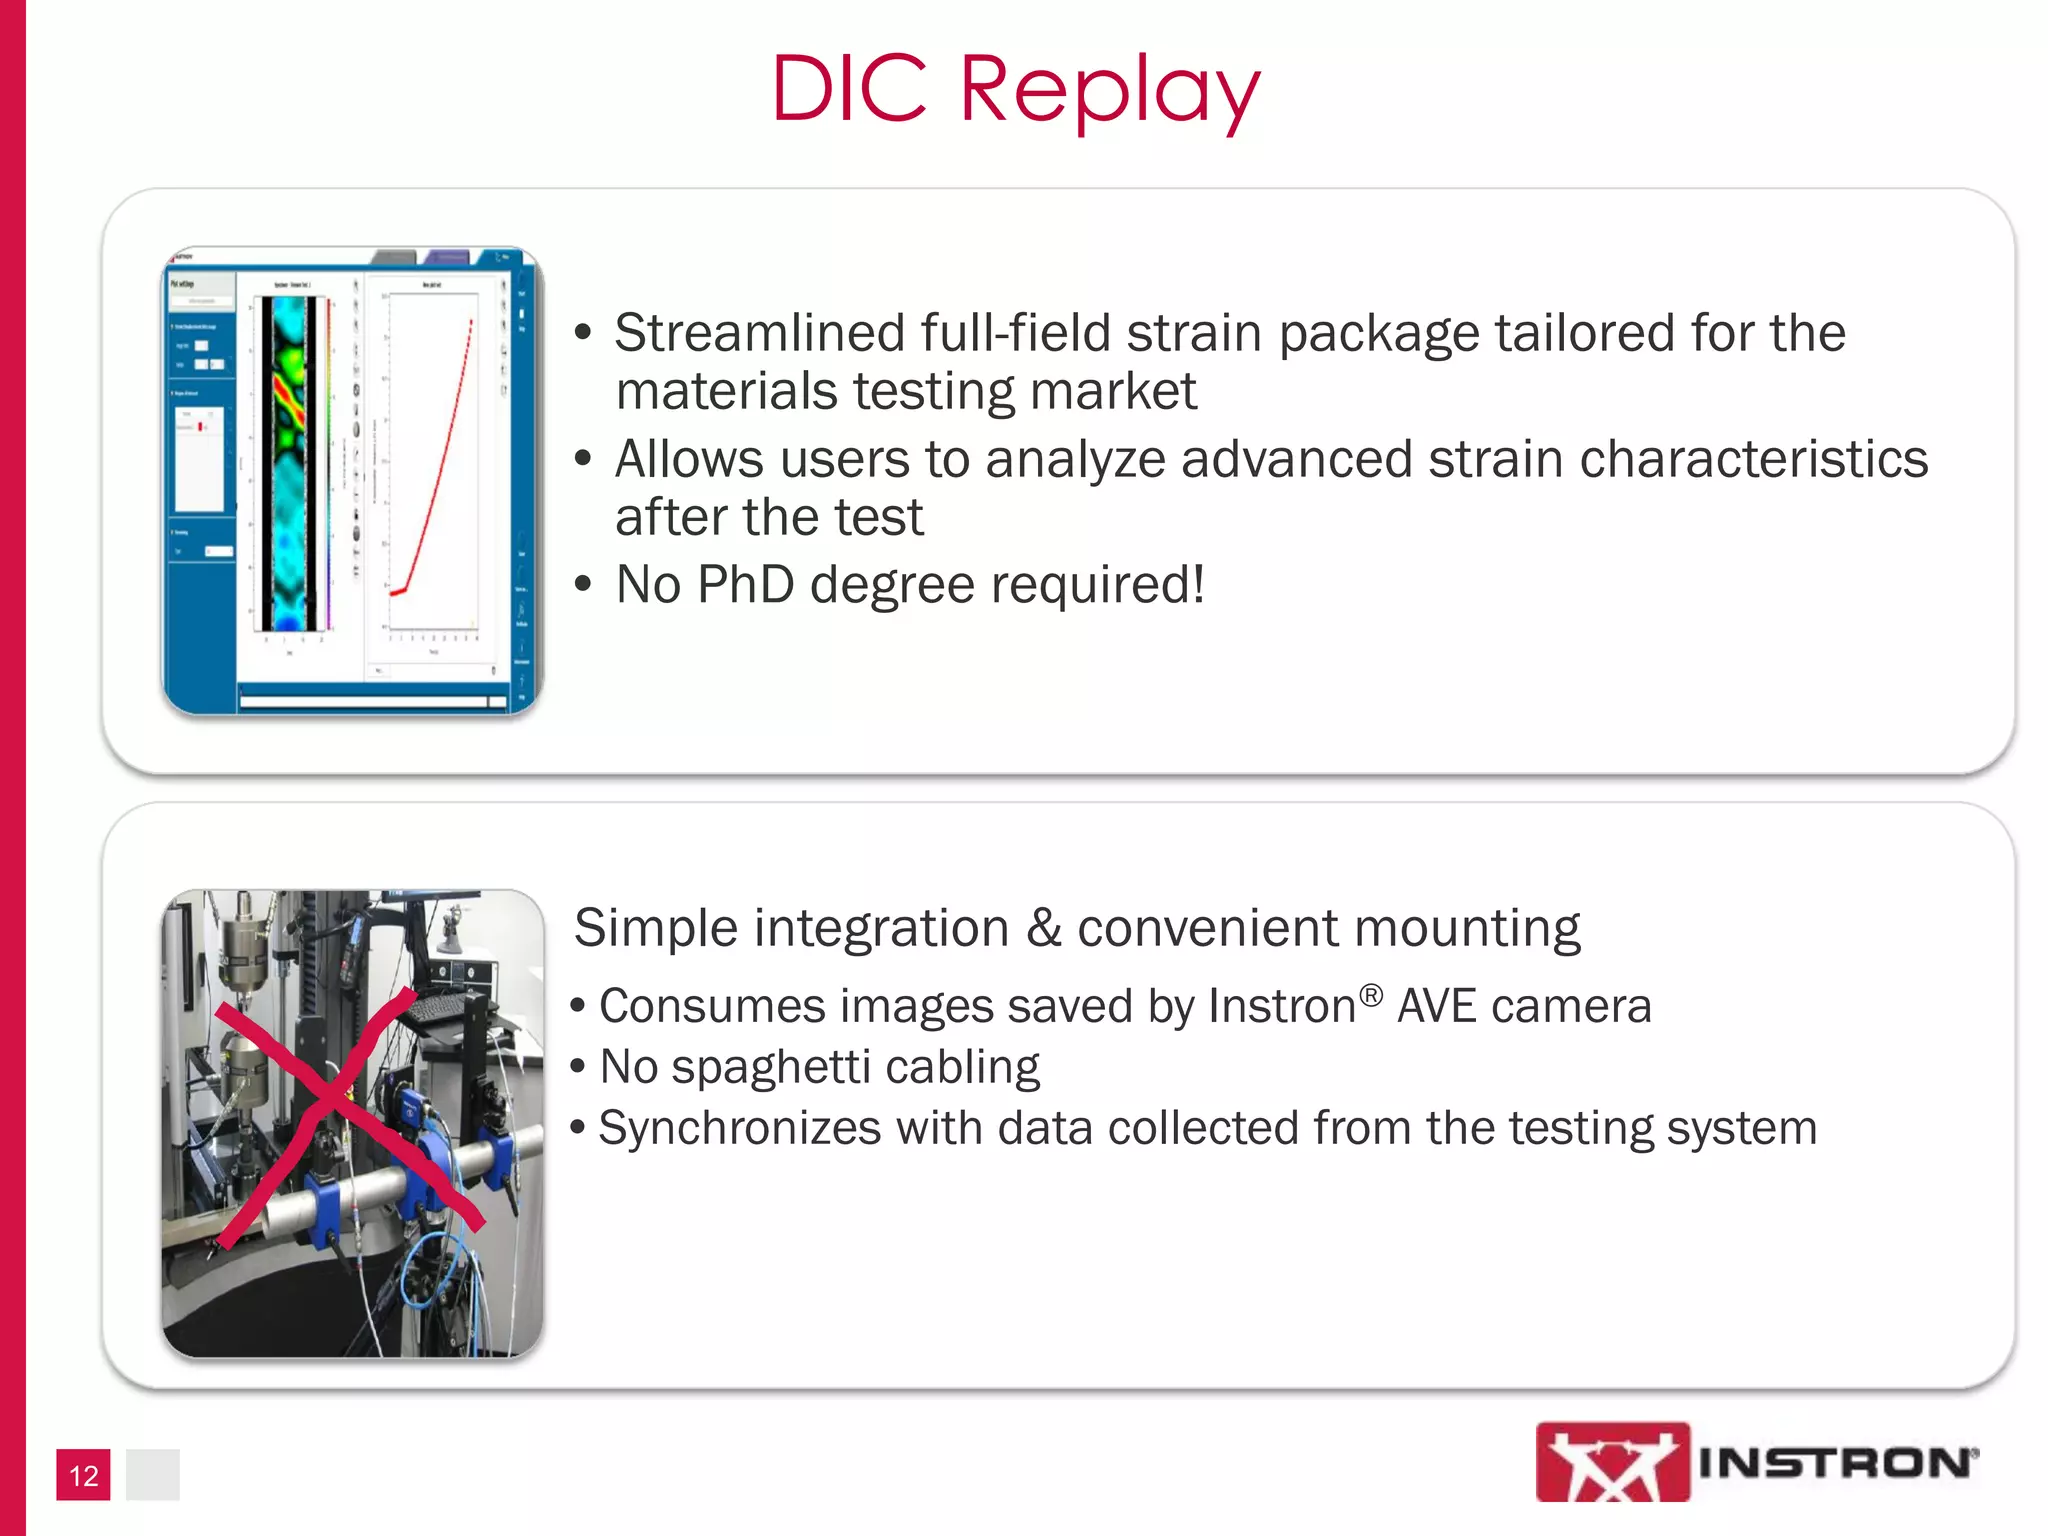
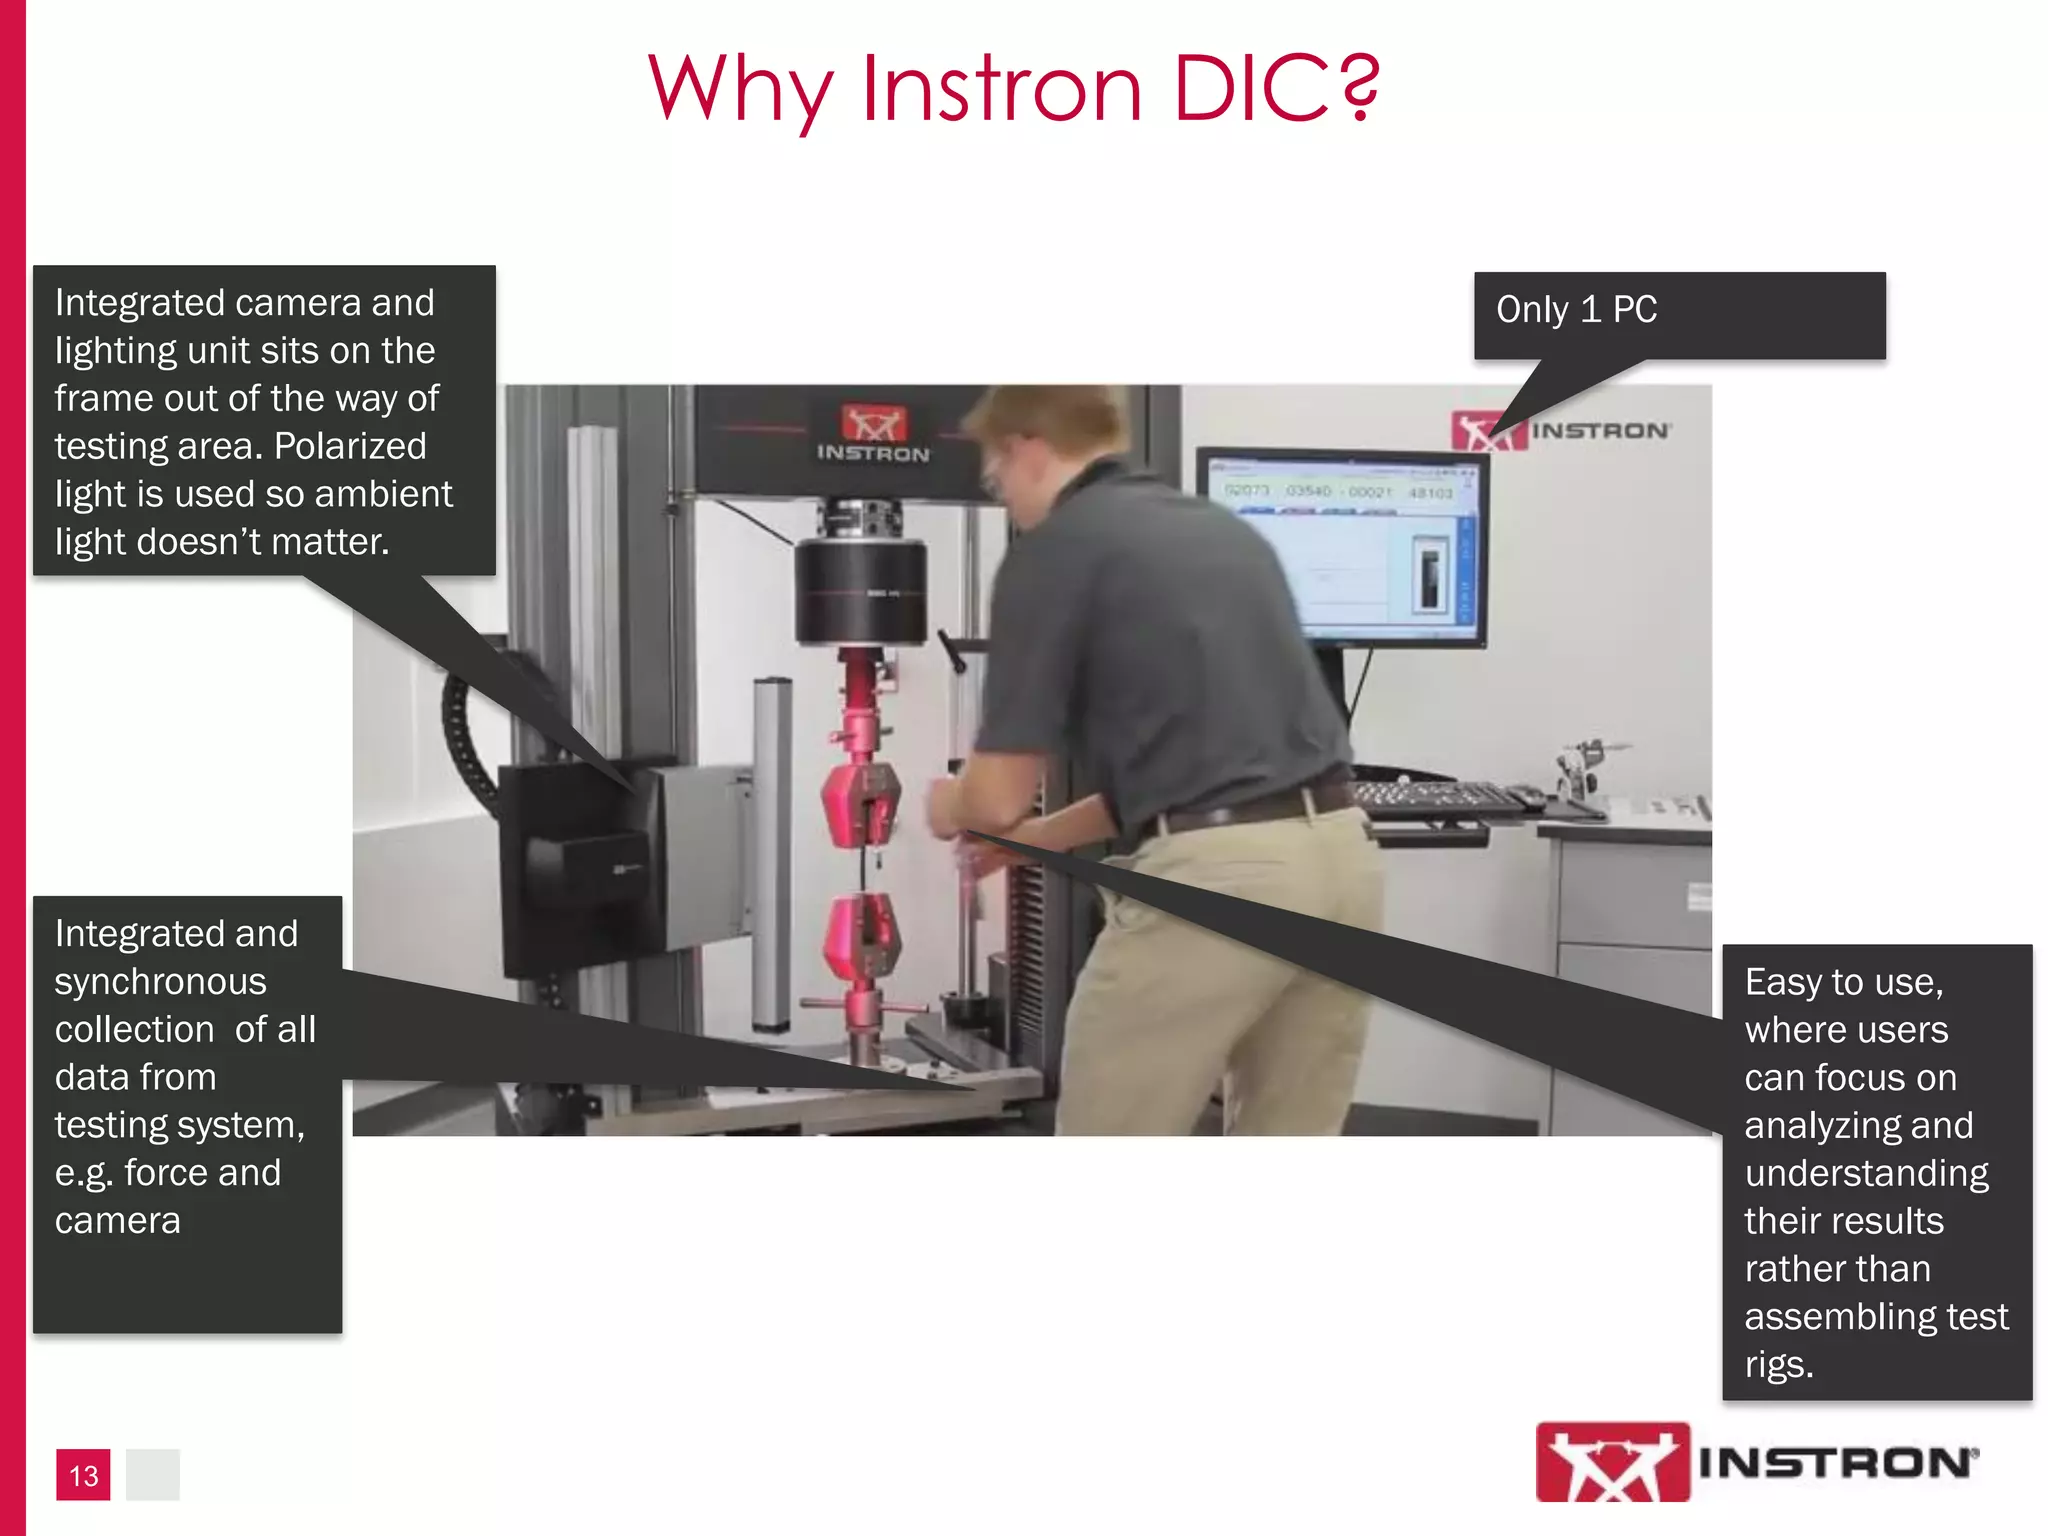
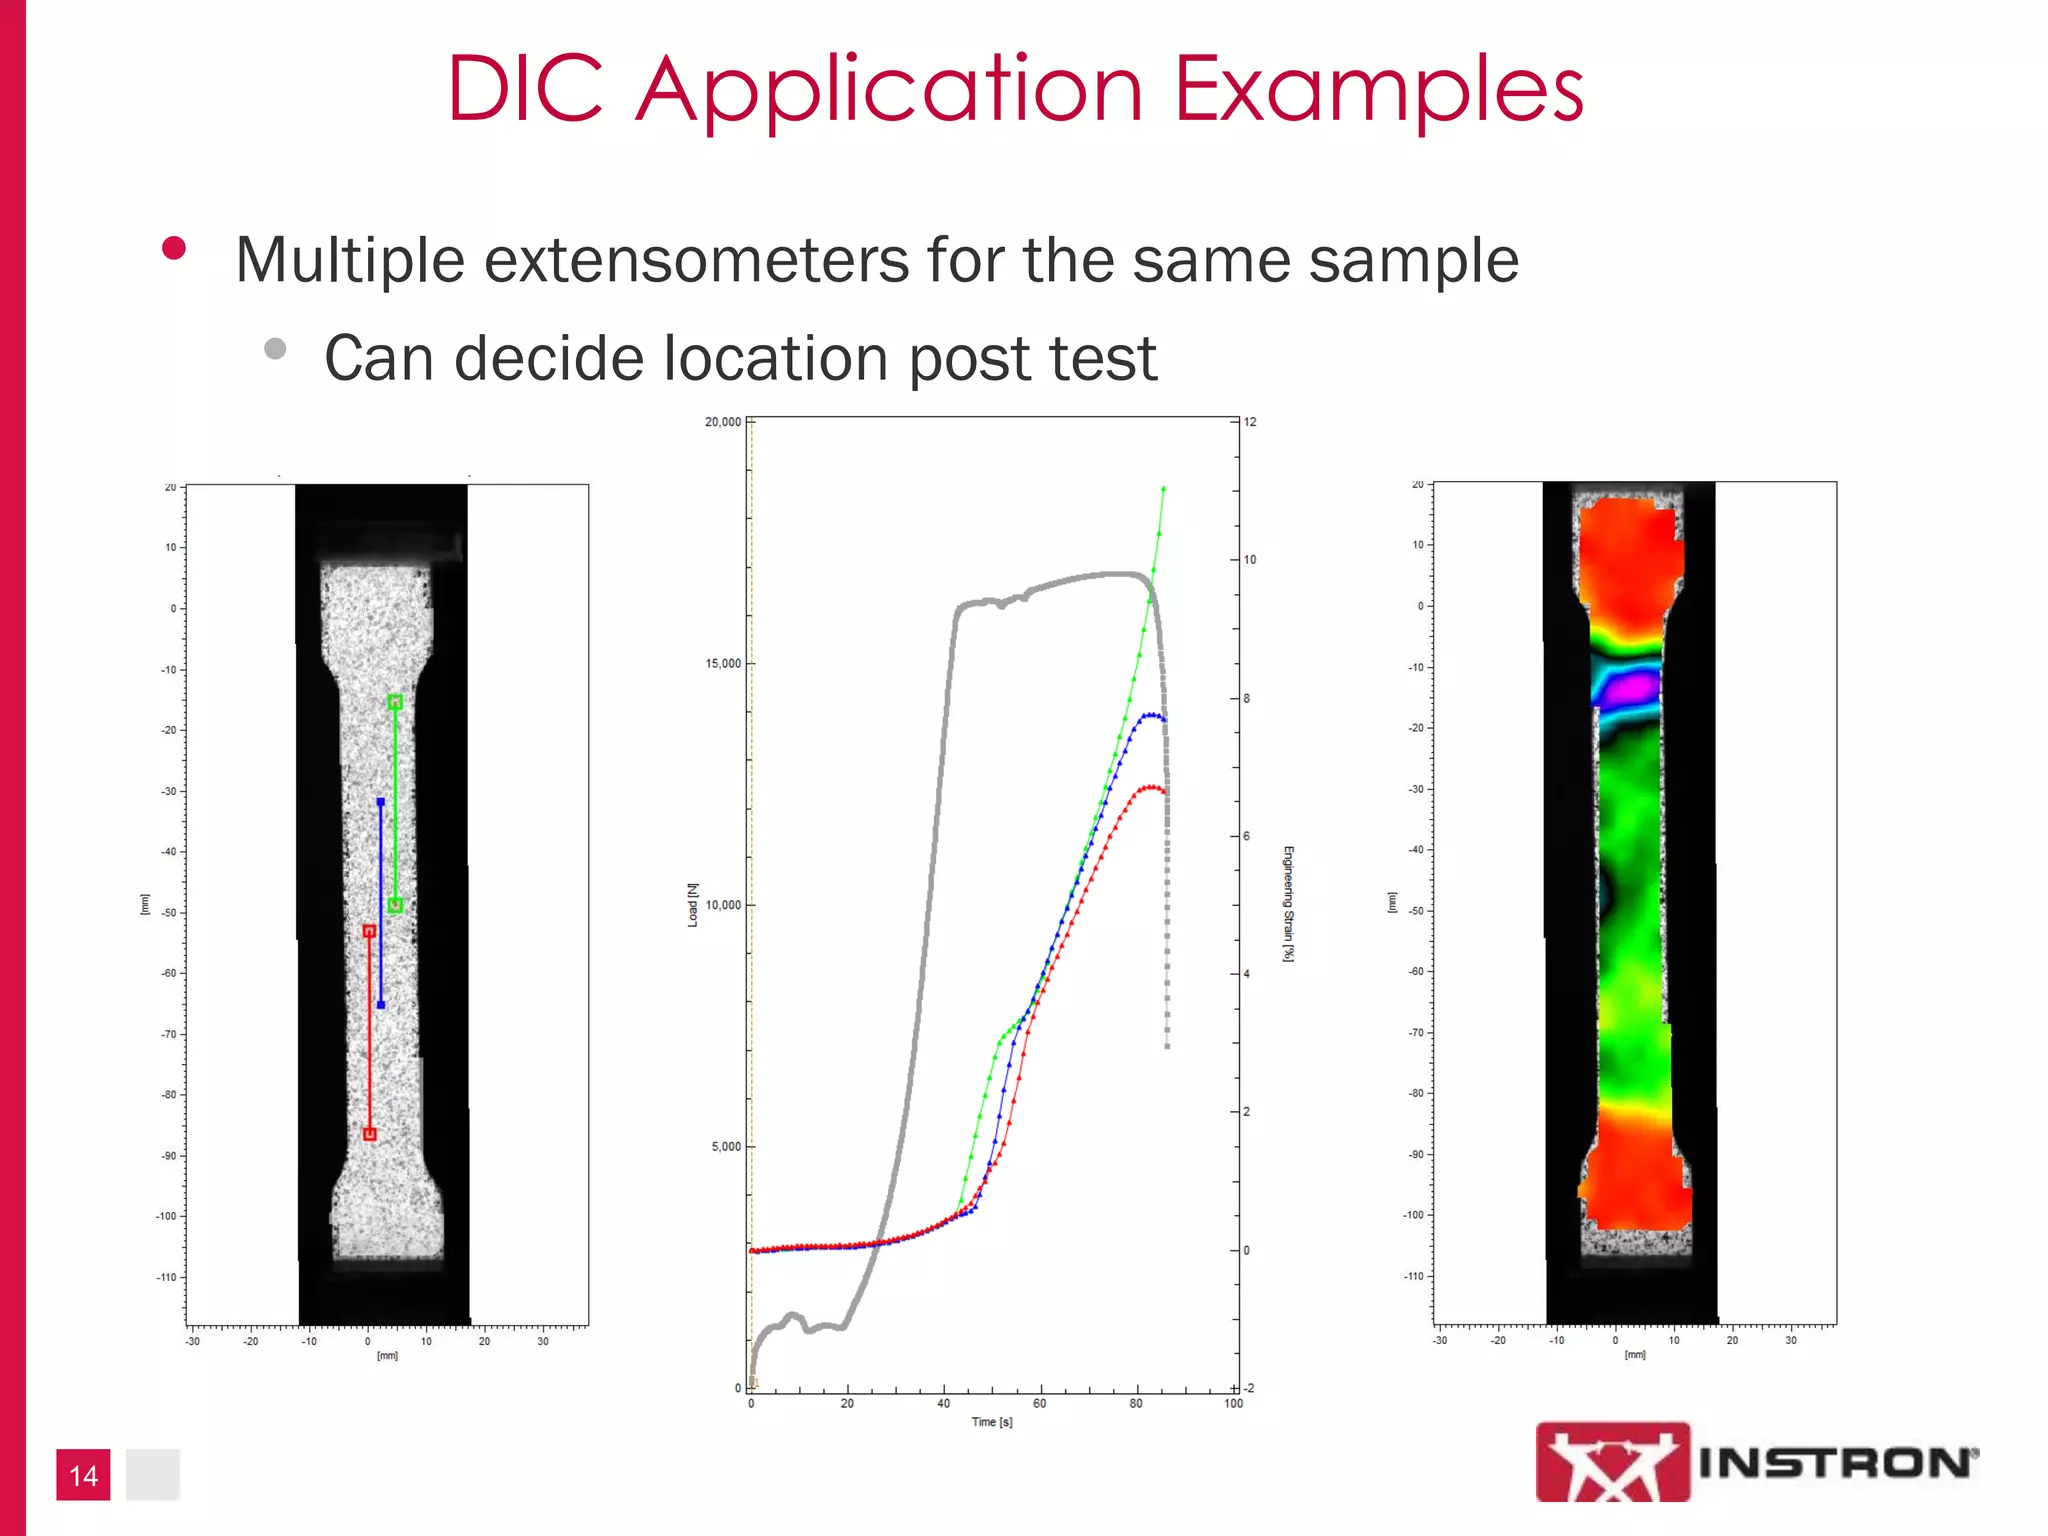
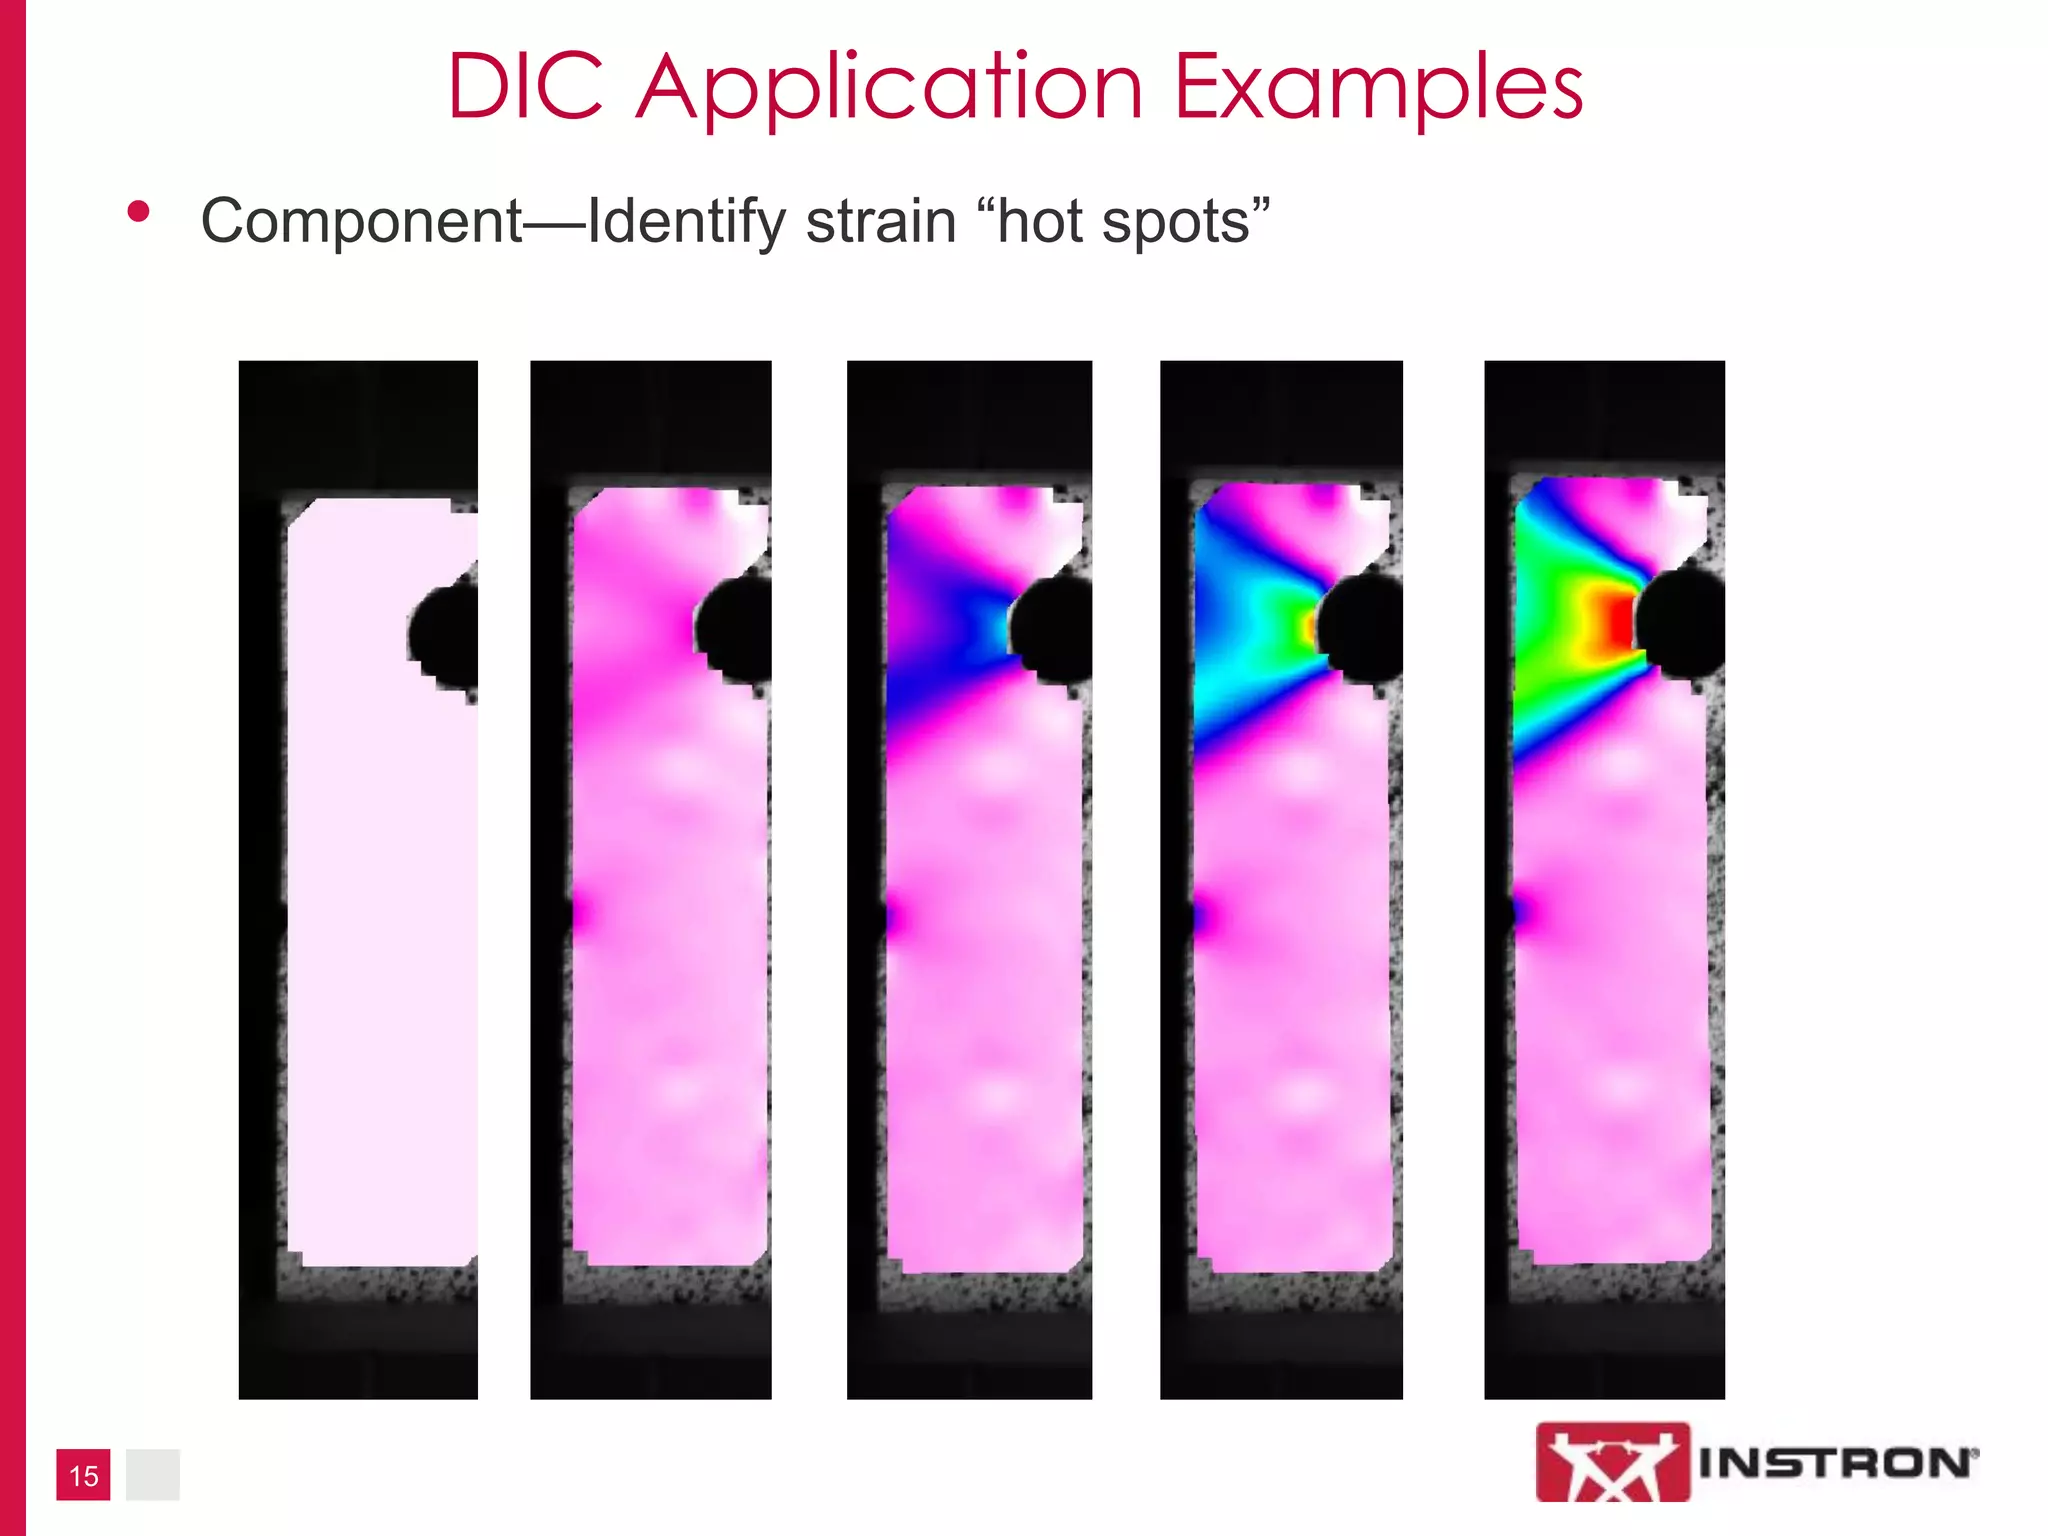
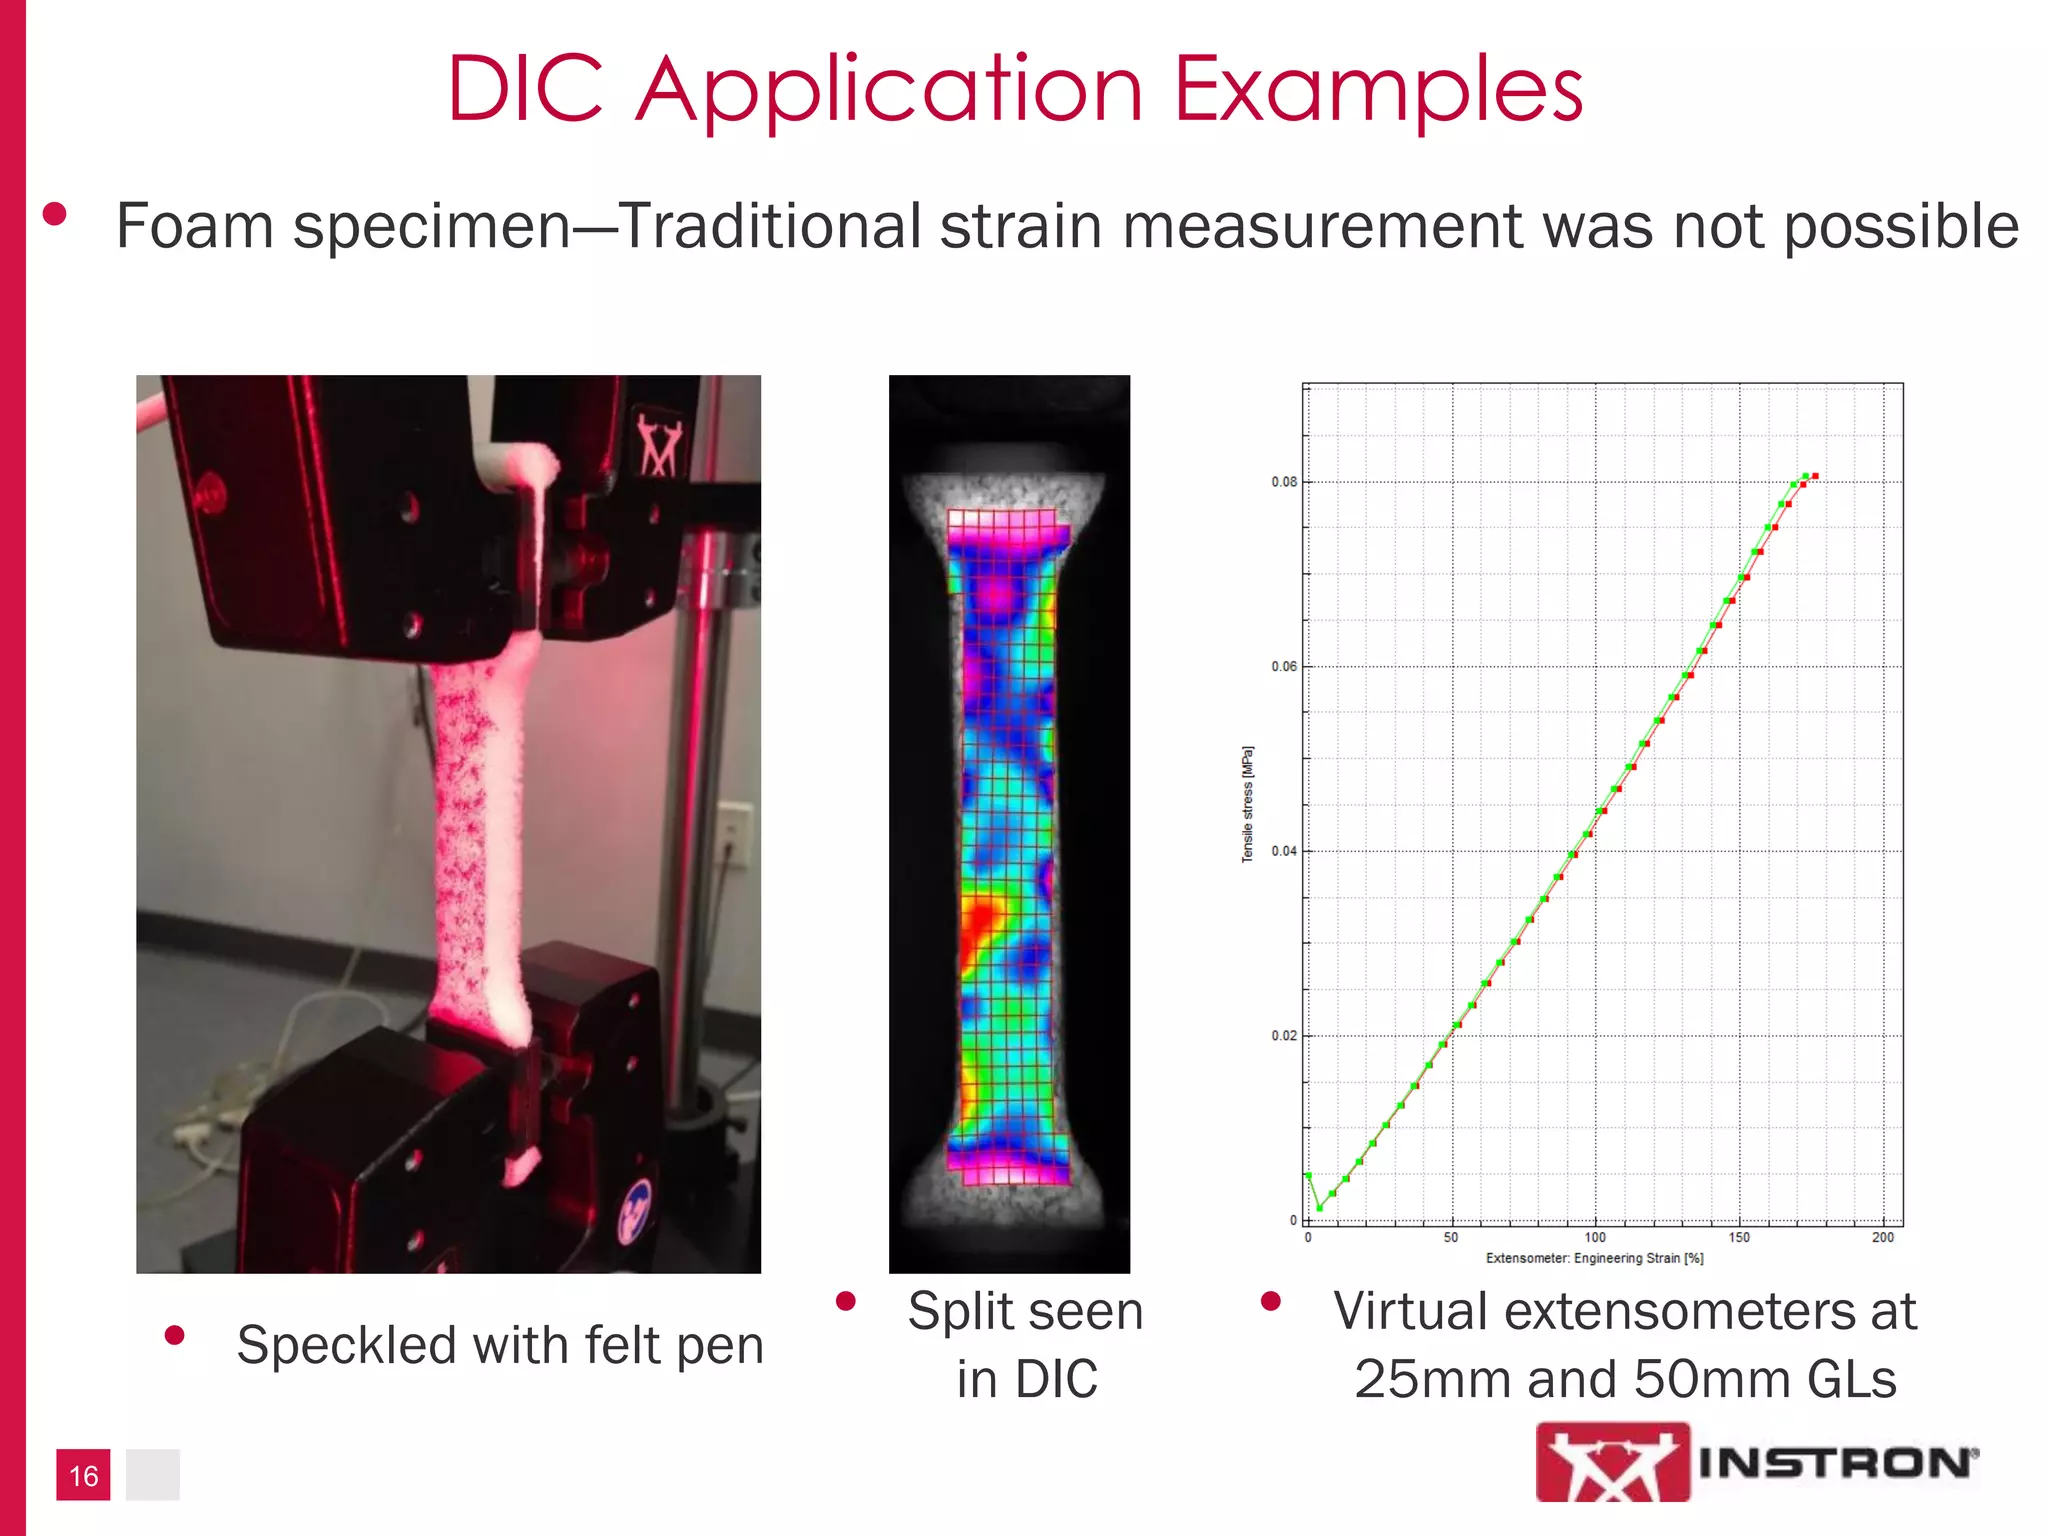
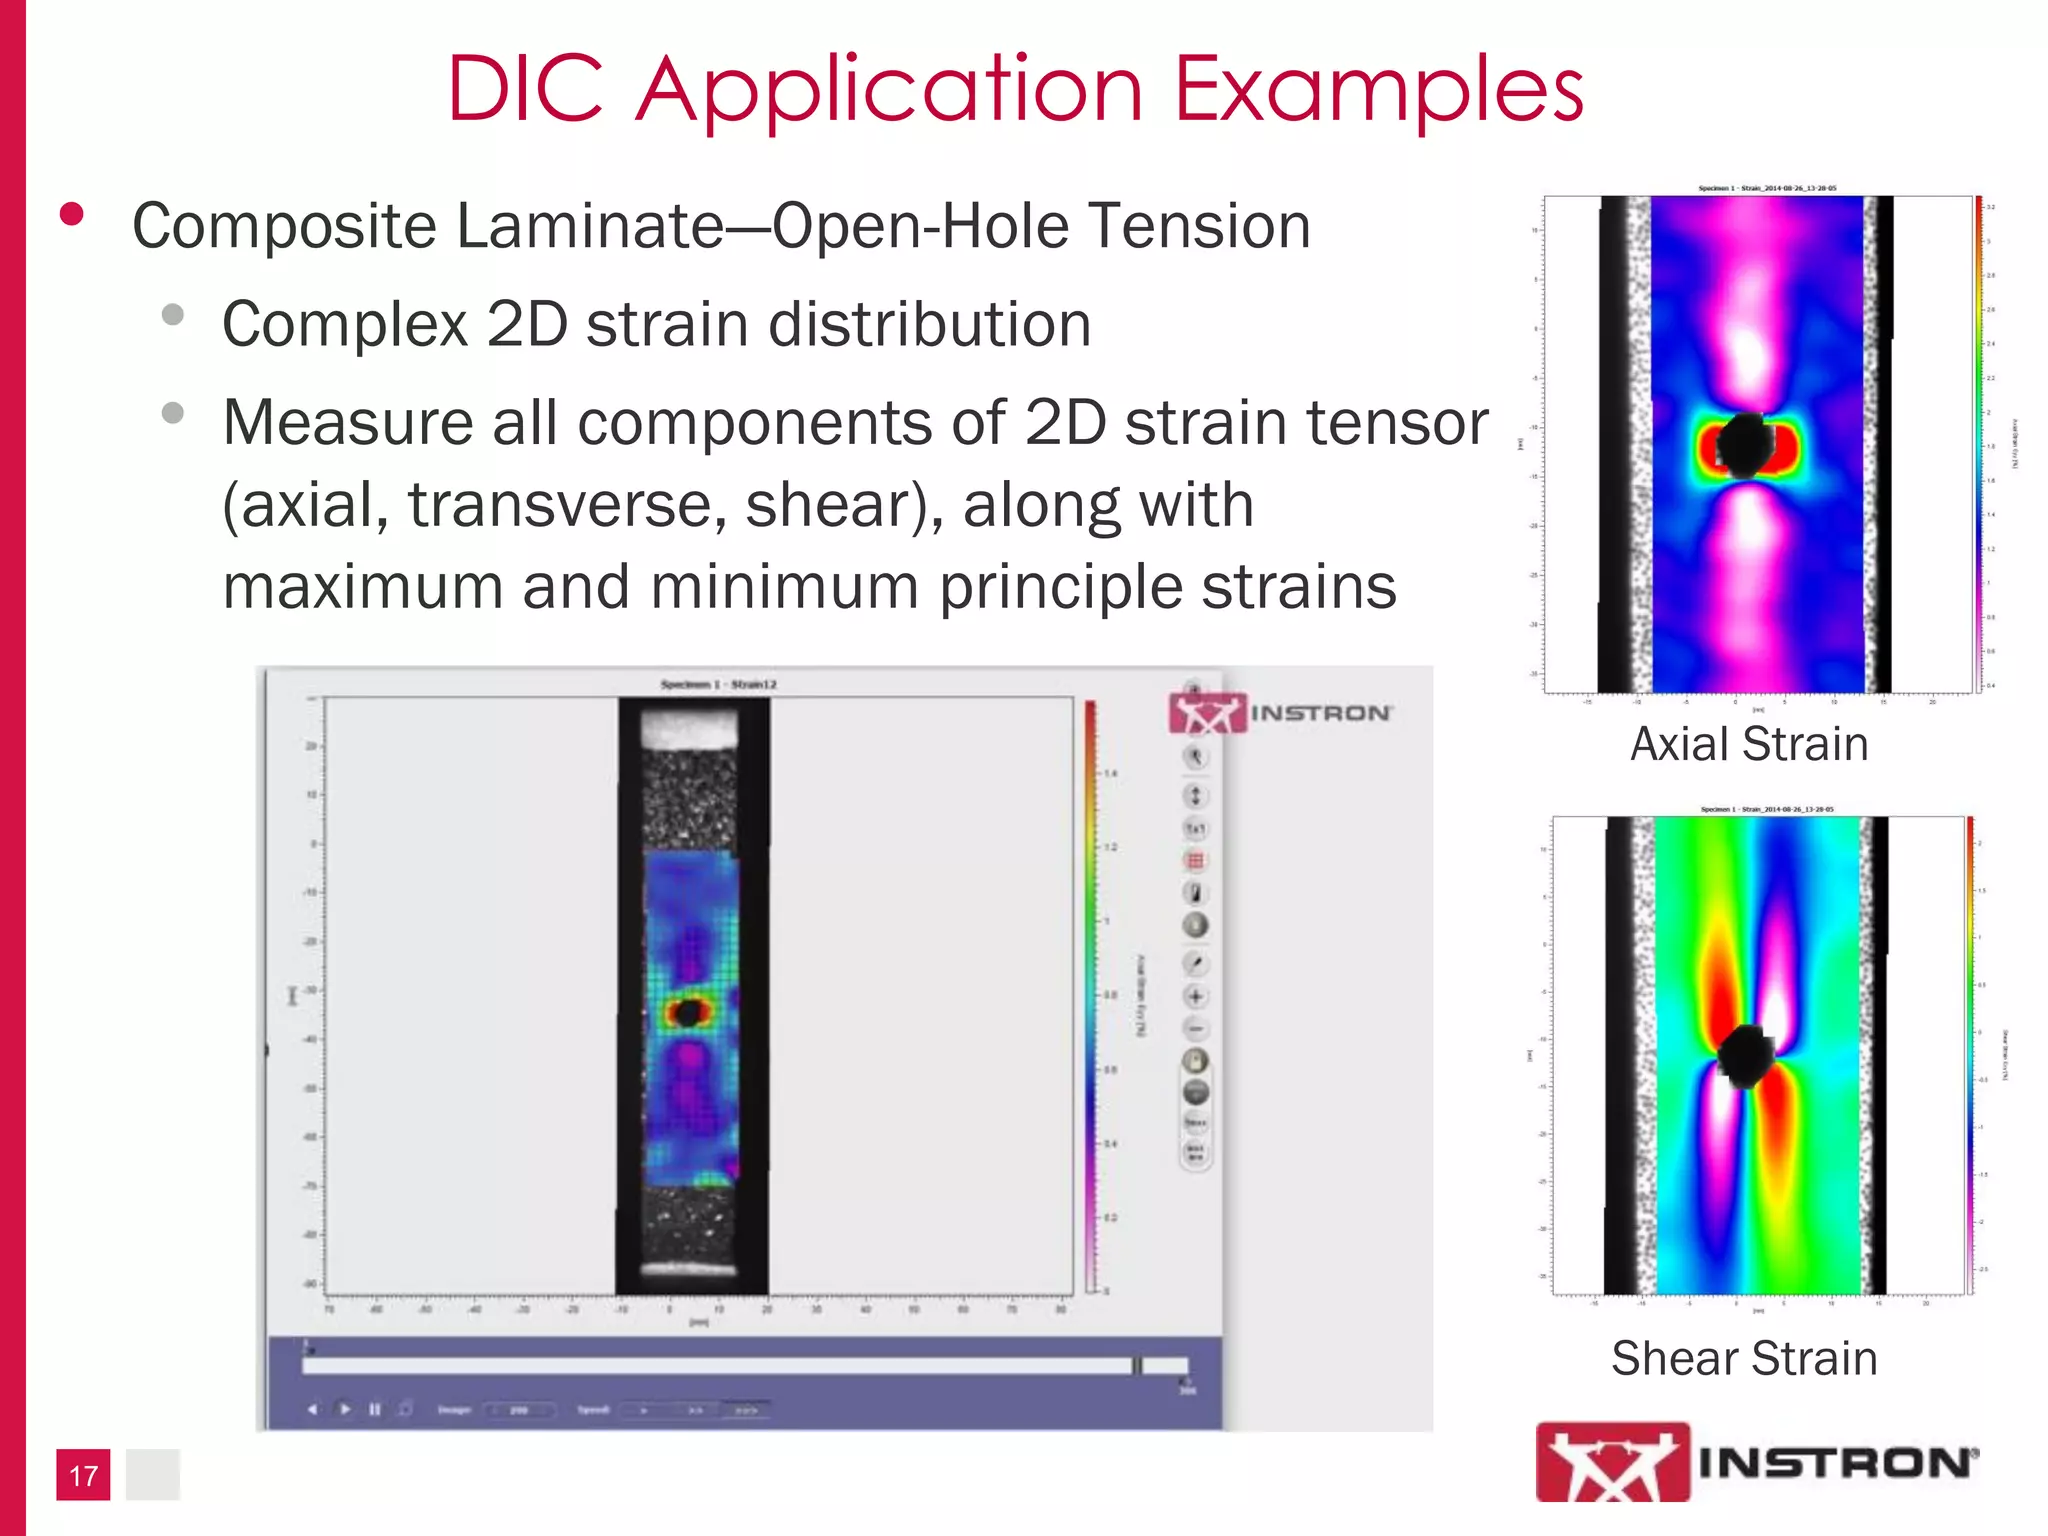

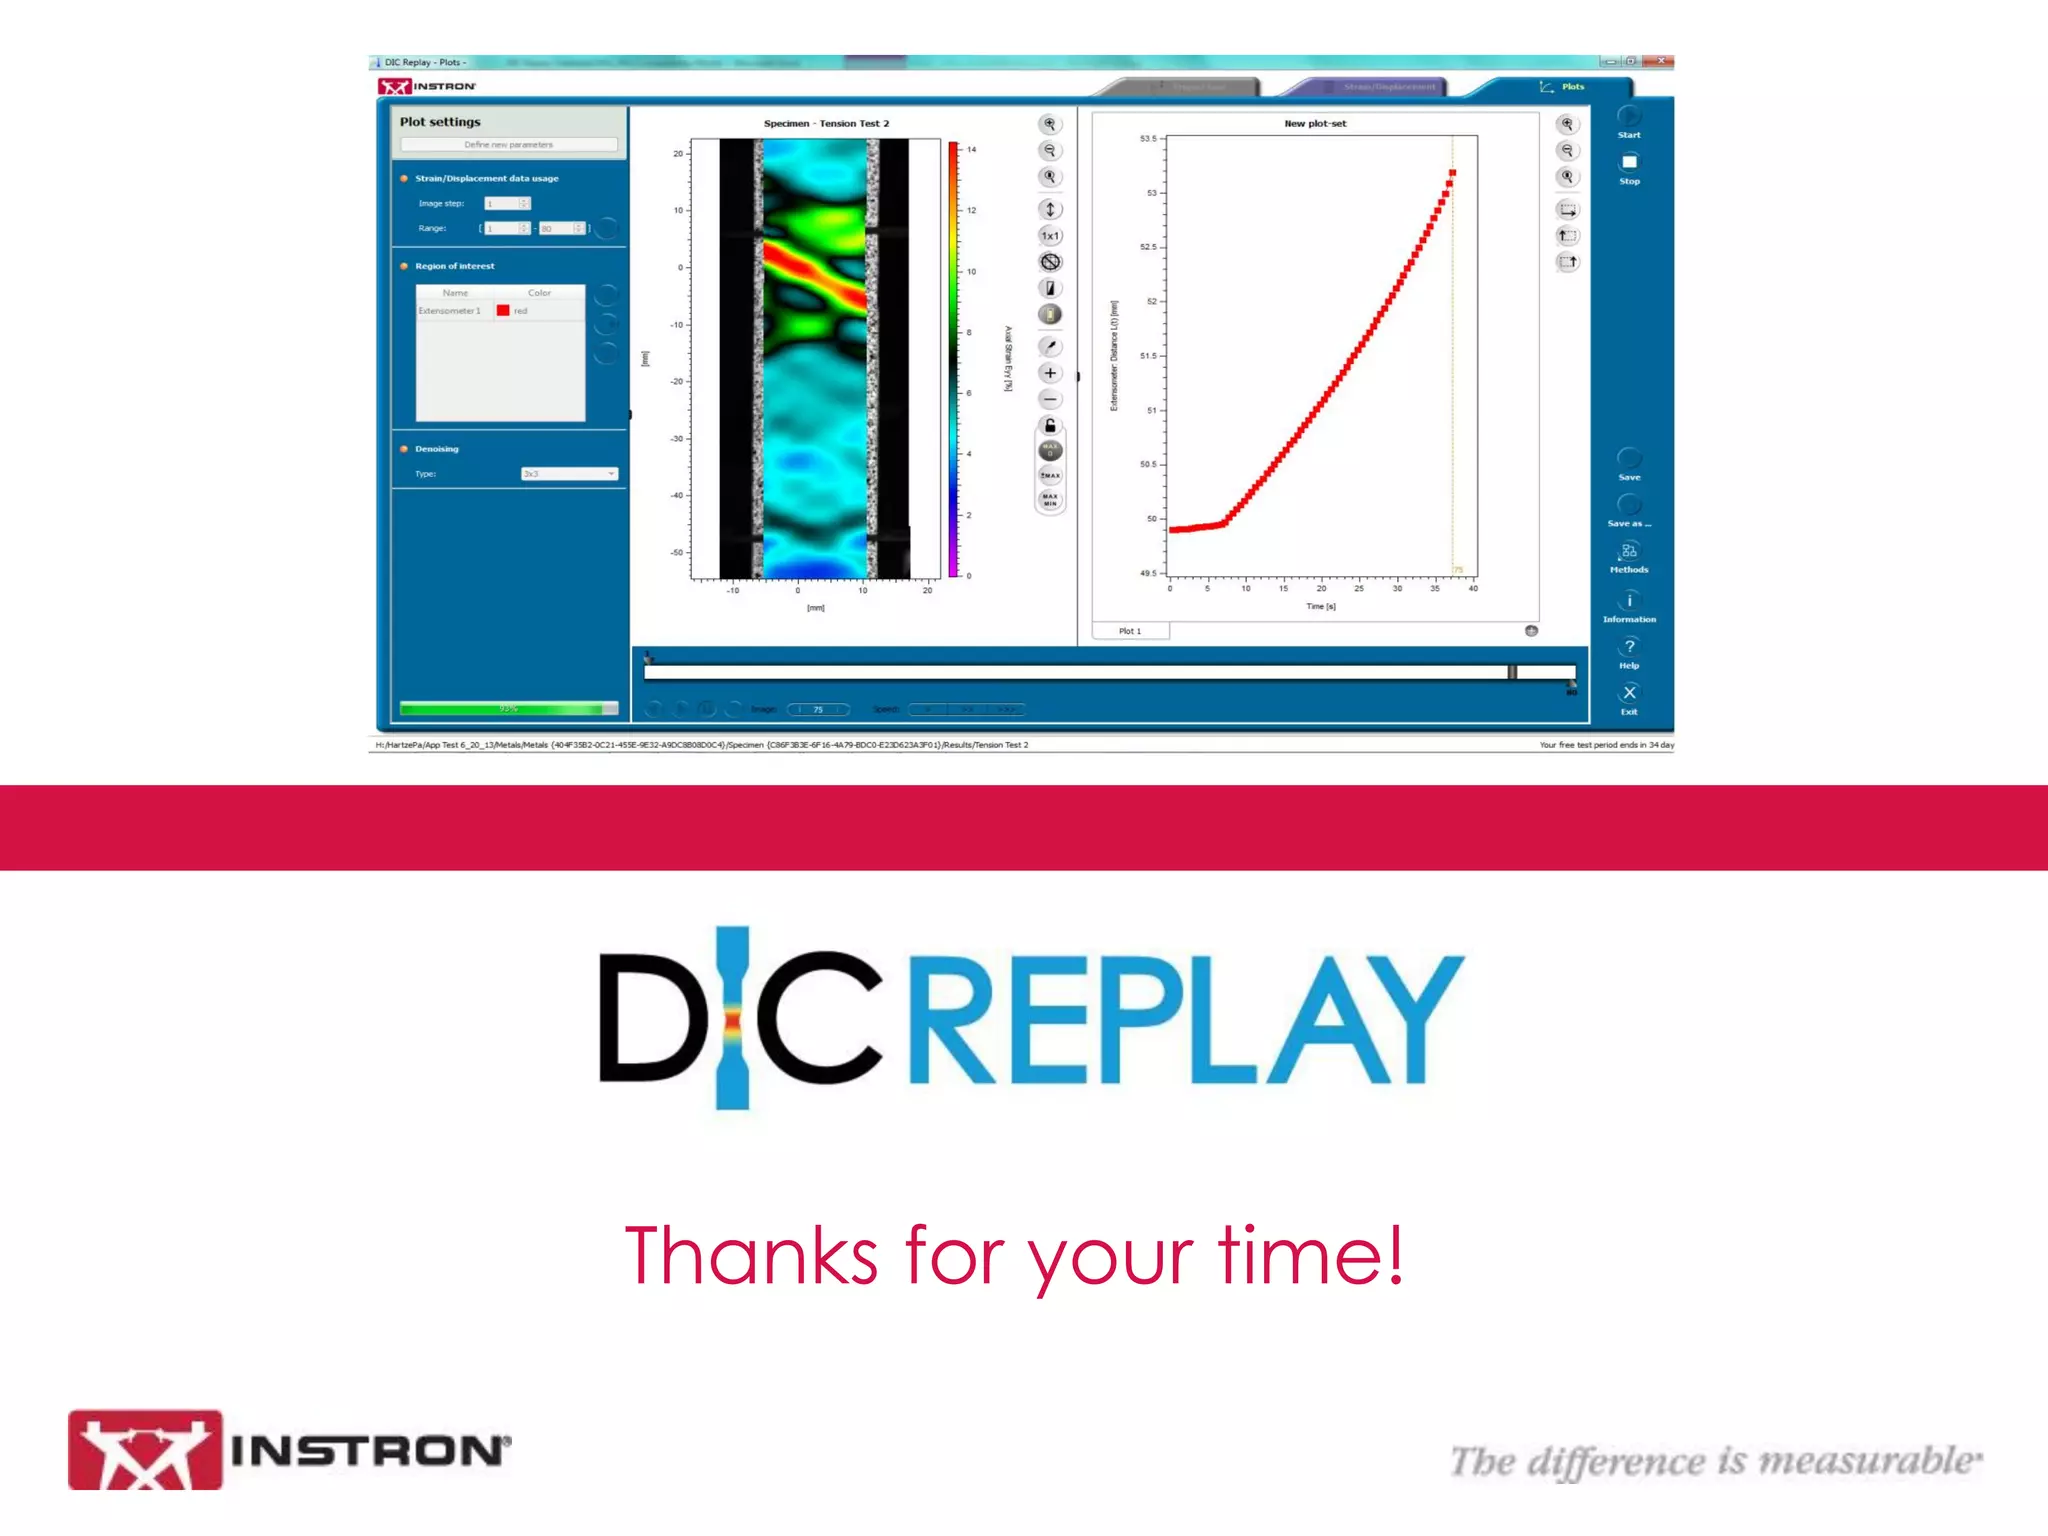

Digital Image Correlation (DIC) is a non-contact optical method for analyzing the displacement and strain of an object's surface over time. It provides full-field data and identifies strain hot spots, allowing for accurate measurement without prior knowledge of gauge placement. DIC has applications across various materials, including composites and textiles, and integrates data collection for enhanced testing efficiency.