Download to read offline
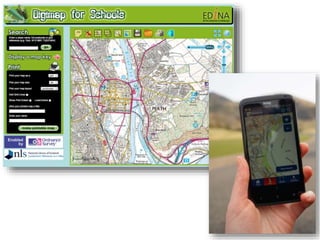
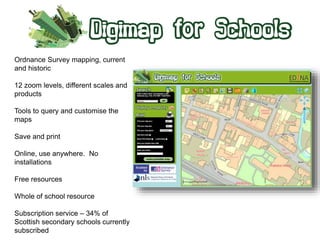
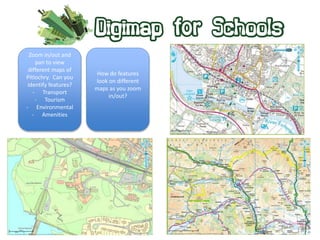
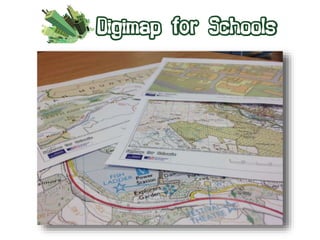
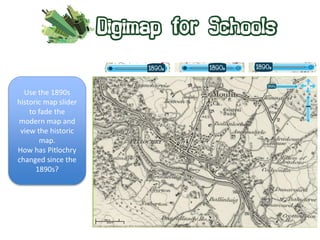

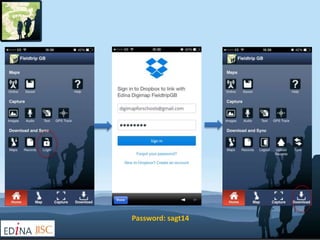
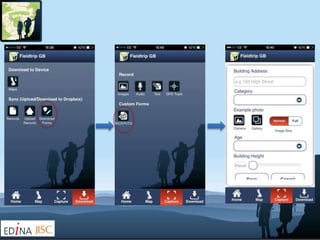
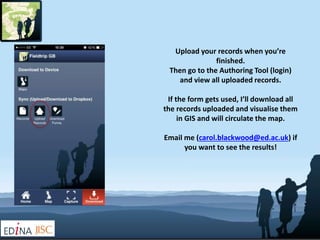

The document outlines the use of digital maps for educational purposes, detailing tools for customization, annotation, and data collection in both historic and modern contexts. It highlights resources available for schools, such as various mapping services, and guides on creating and exporting maps. Additionally, it provides instructions for using mobile applications to gather data during field trips and manage that data effectively.