Chapter Objectives
• Describedata and process modeling concepts
and tools, including data flow diagrams, a data
dictionary, and process descriptions
• Describe the symbols used in data flow
diagrams and explain the rules for their use
• Draw data flow diagrams in a sequence, from
general to specific
• Explain how to level and balance a set of data
flow diagrams
2
3.
Chapter Objectives
• Describehow a data dictionary is used and
what it contains
• Use process description tools, including
structured English, decision tables, and
decision trees
• Describe the relationship between logical
and physical models
3
4.
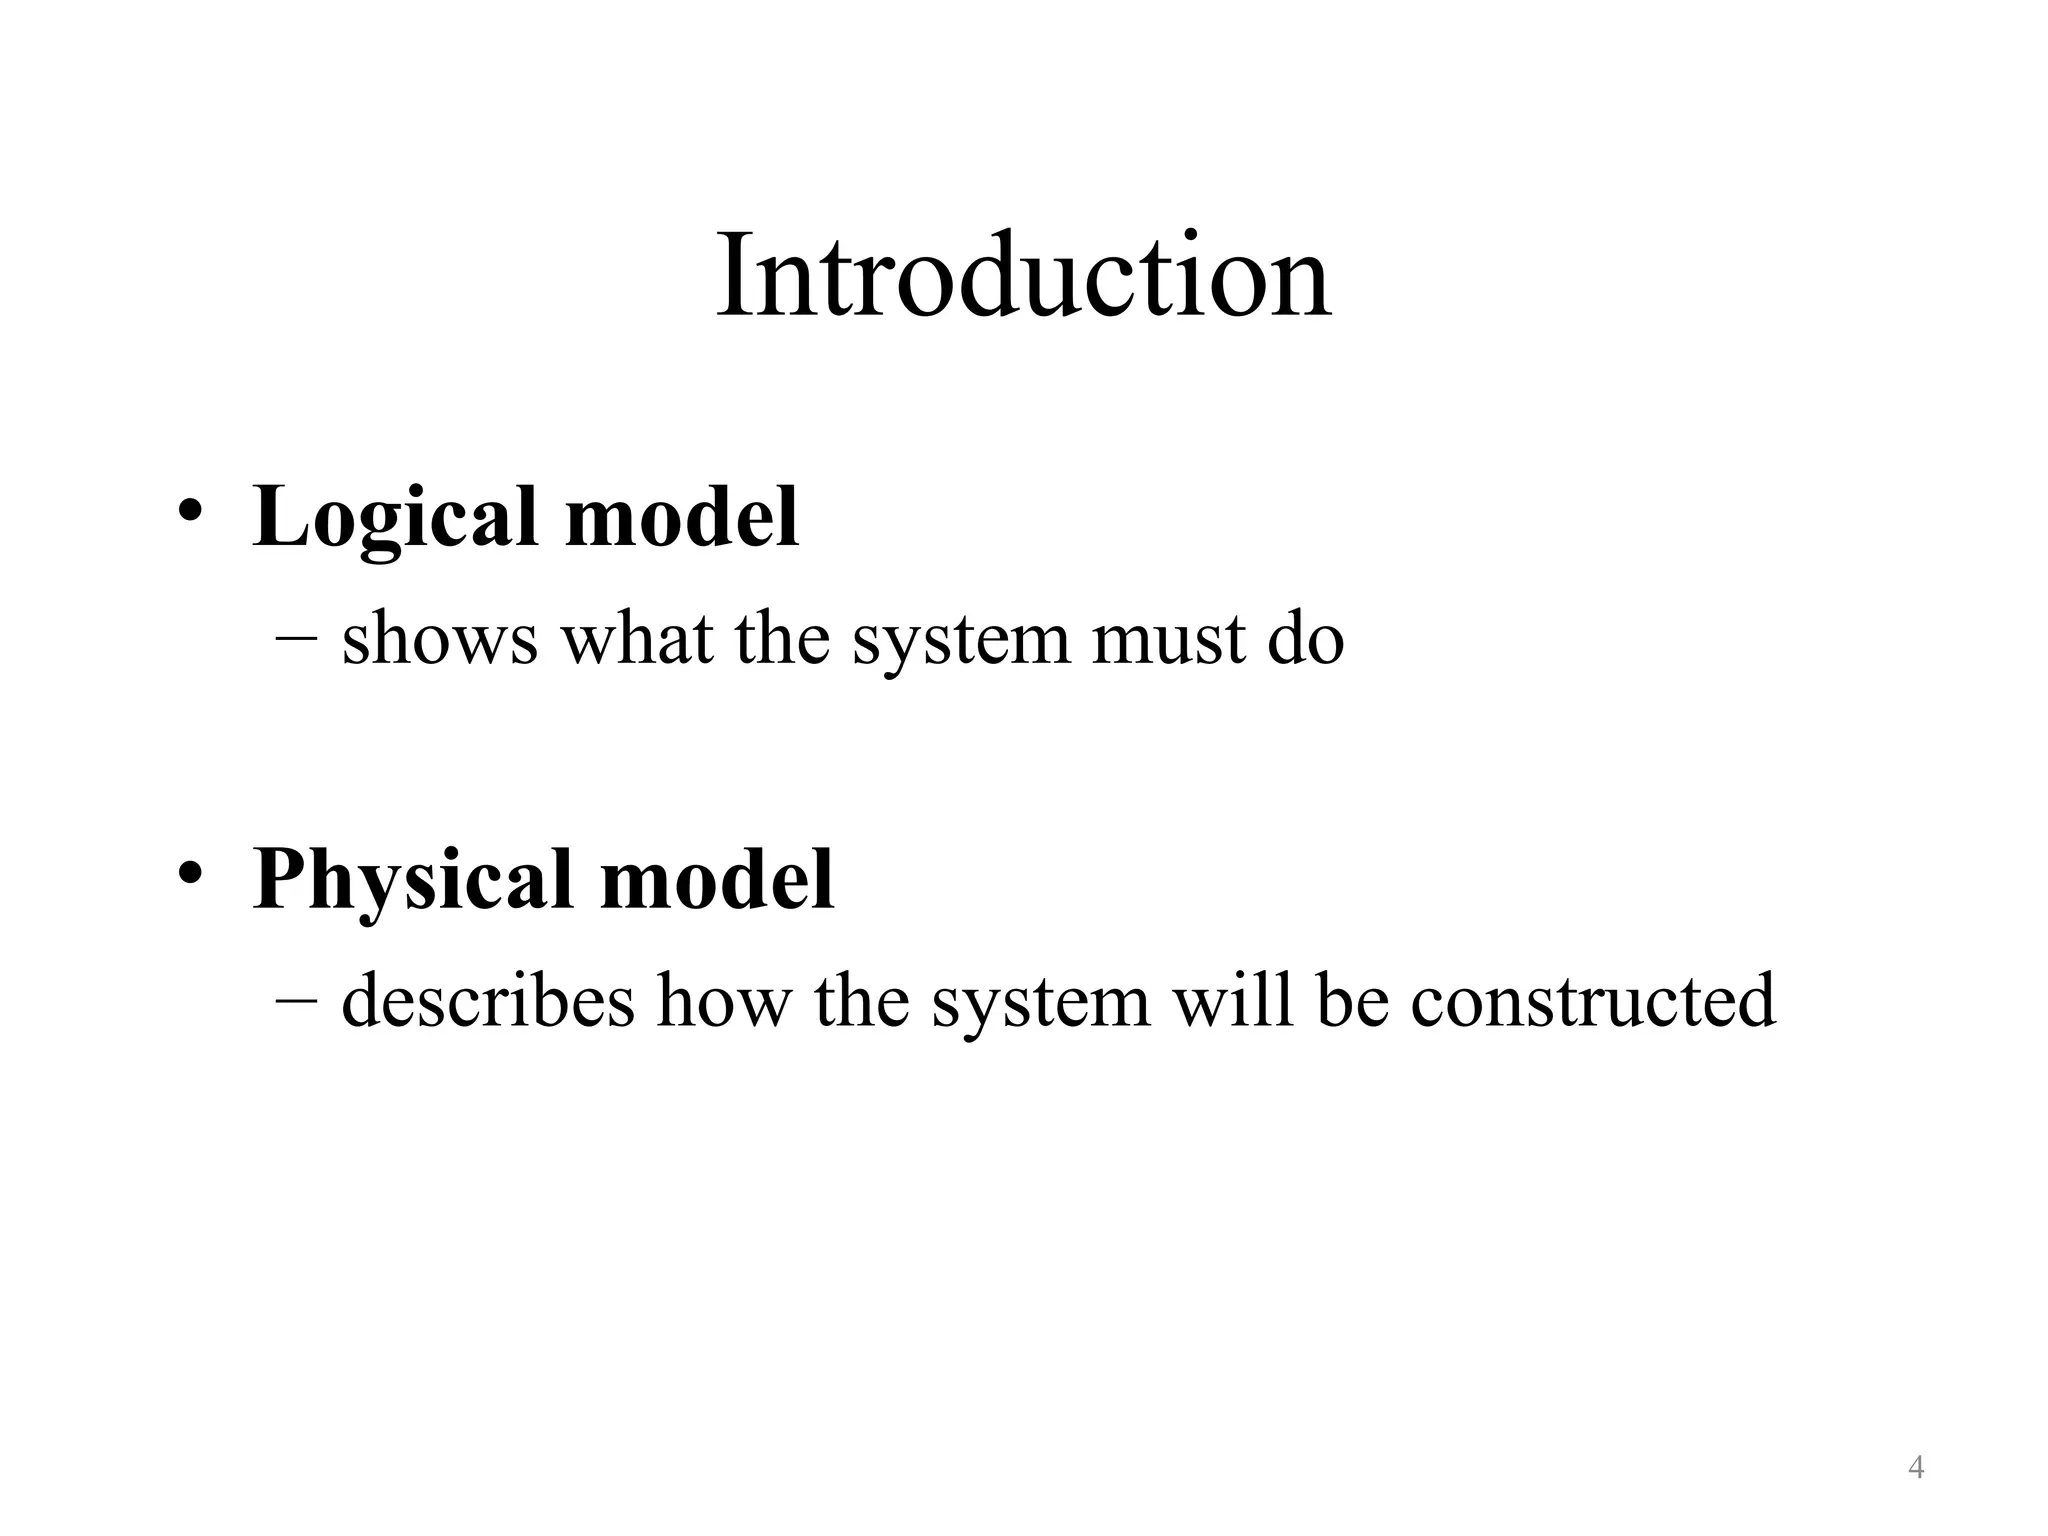
Introduction
• Logical model
–shows what the system must do
• Physical model
– describes how the system will be constructed
4
5.
Overview of Dataand Process
Modeling Tools
• Systems analysts use many graphical techniques to
describe an information system
• Data and process modeling involves three main tools:
– data flow diagrams,
– data dictionary, and
– process descriptions
• A data flow diagram (DFD) uses various symbols to
show how the system transforms input data into
useful information
5
6.
Data Flow Diagrams
Adata flow diagram (DFD)
• shows how data moves through an information system
• but does not show program logic or processing steps
A set of DFDs
• provides a logical model that
• shows what the system does,
• not how it does it
6
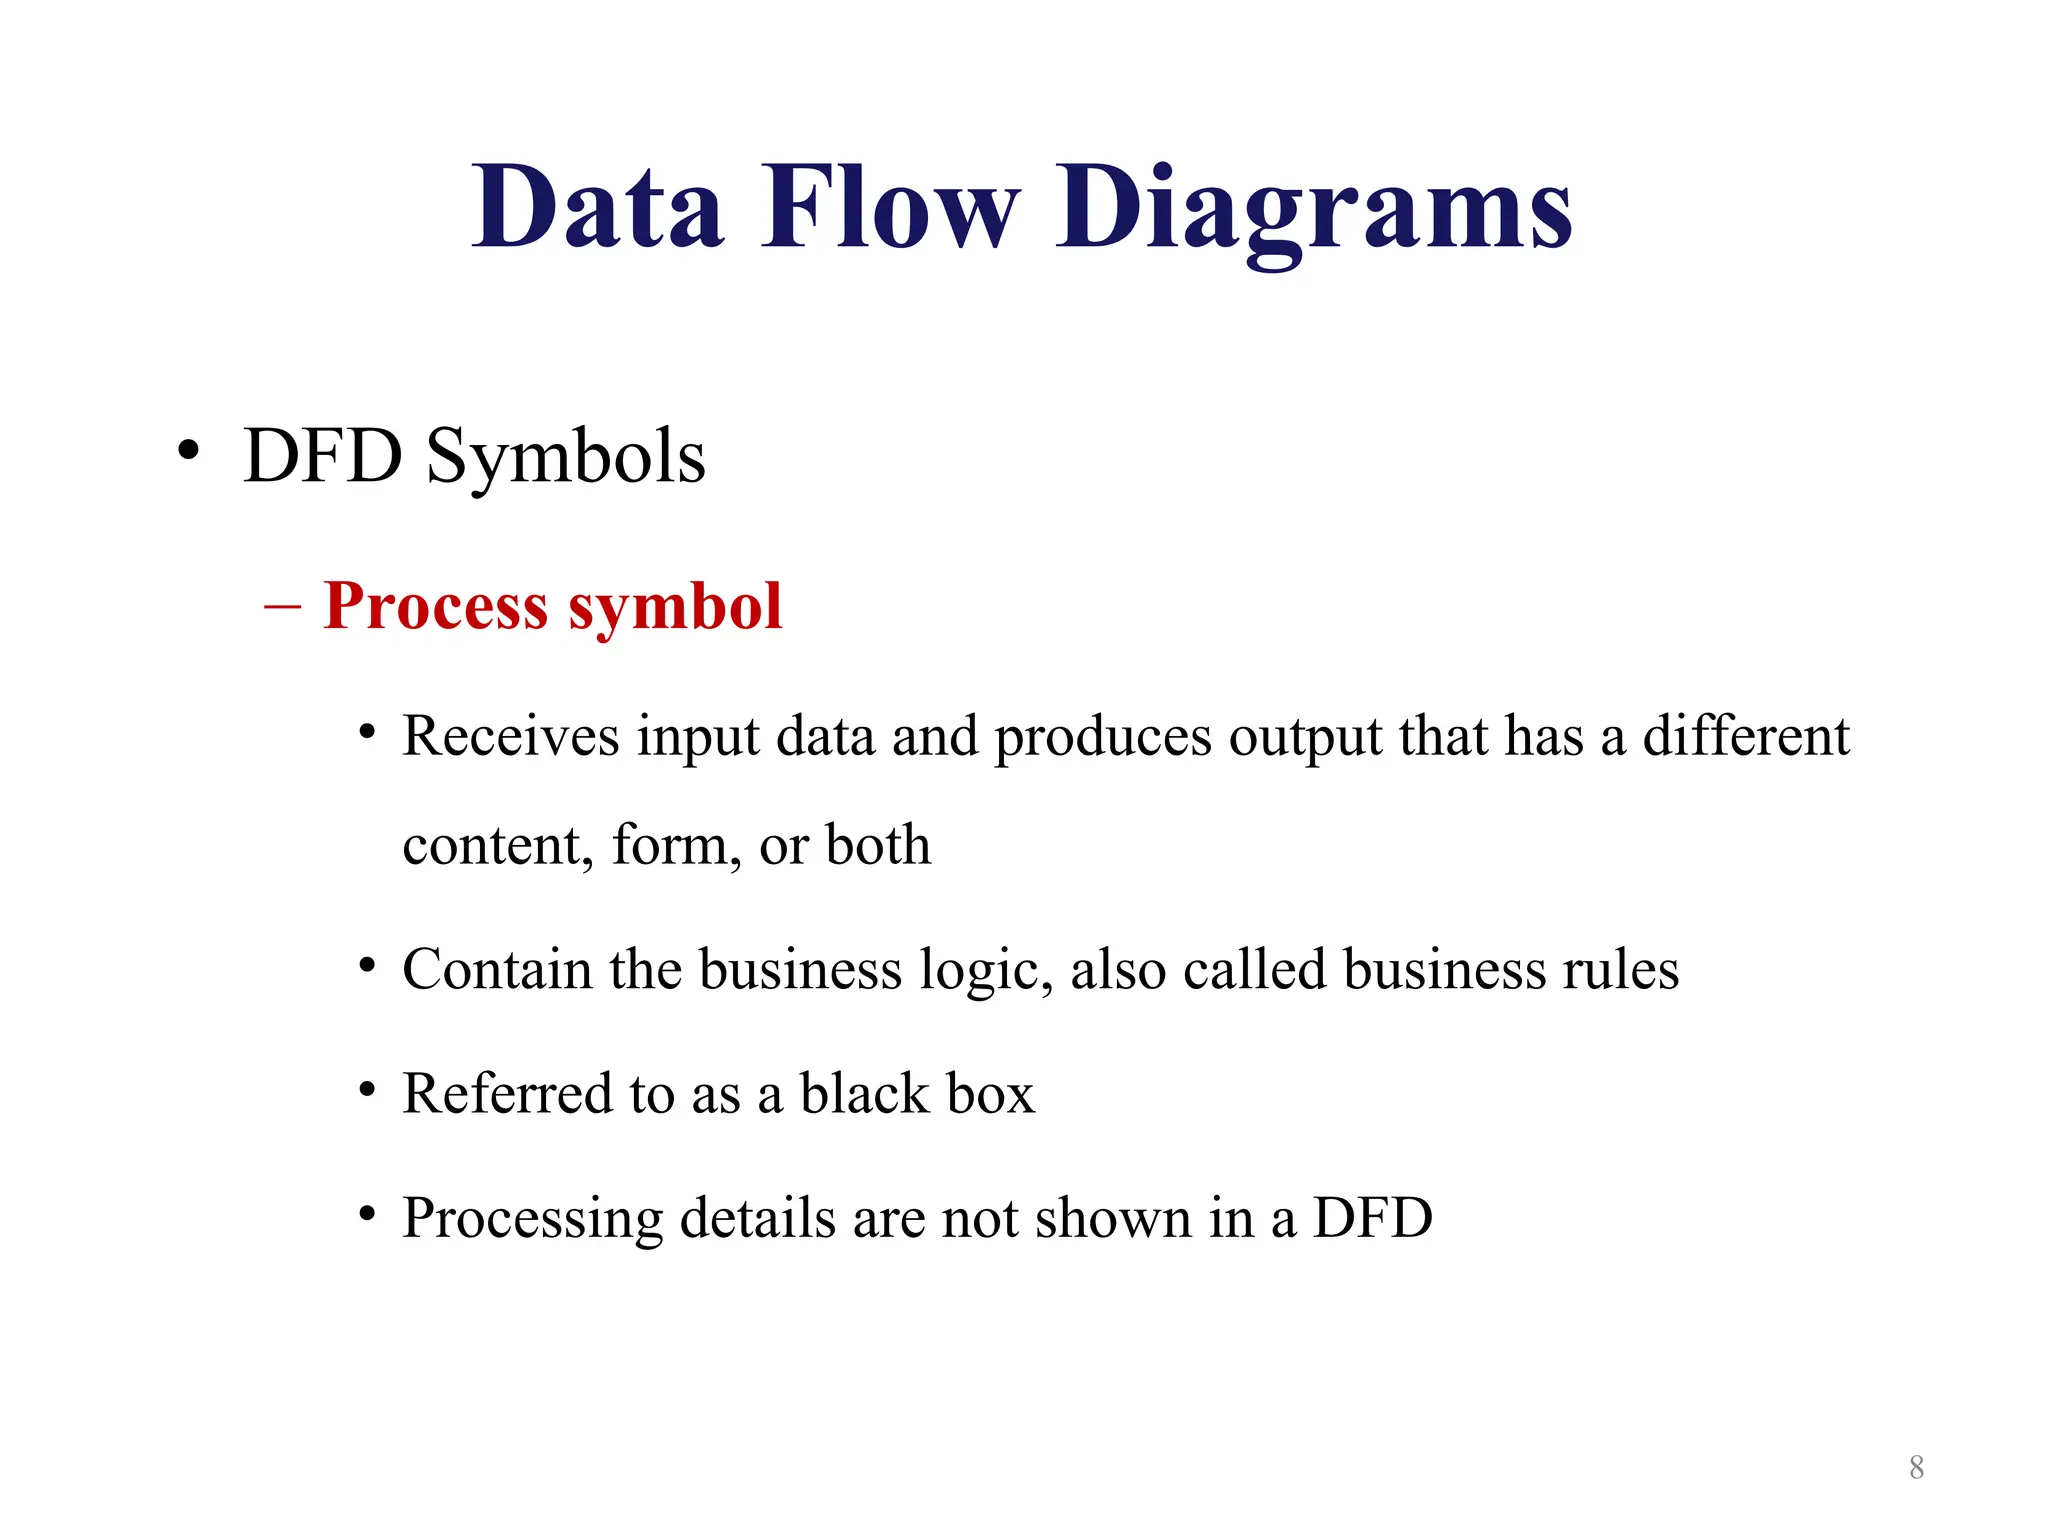
Data Flow Diagrams
•DFD Symbols
– Process symbol
• Receives input data and produces output that has a different
content, form, or both
• Contain the business logic, also called business rules
• Referred to as a black box
• Processing details are not shown in a DFD
8
9.
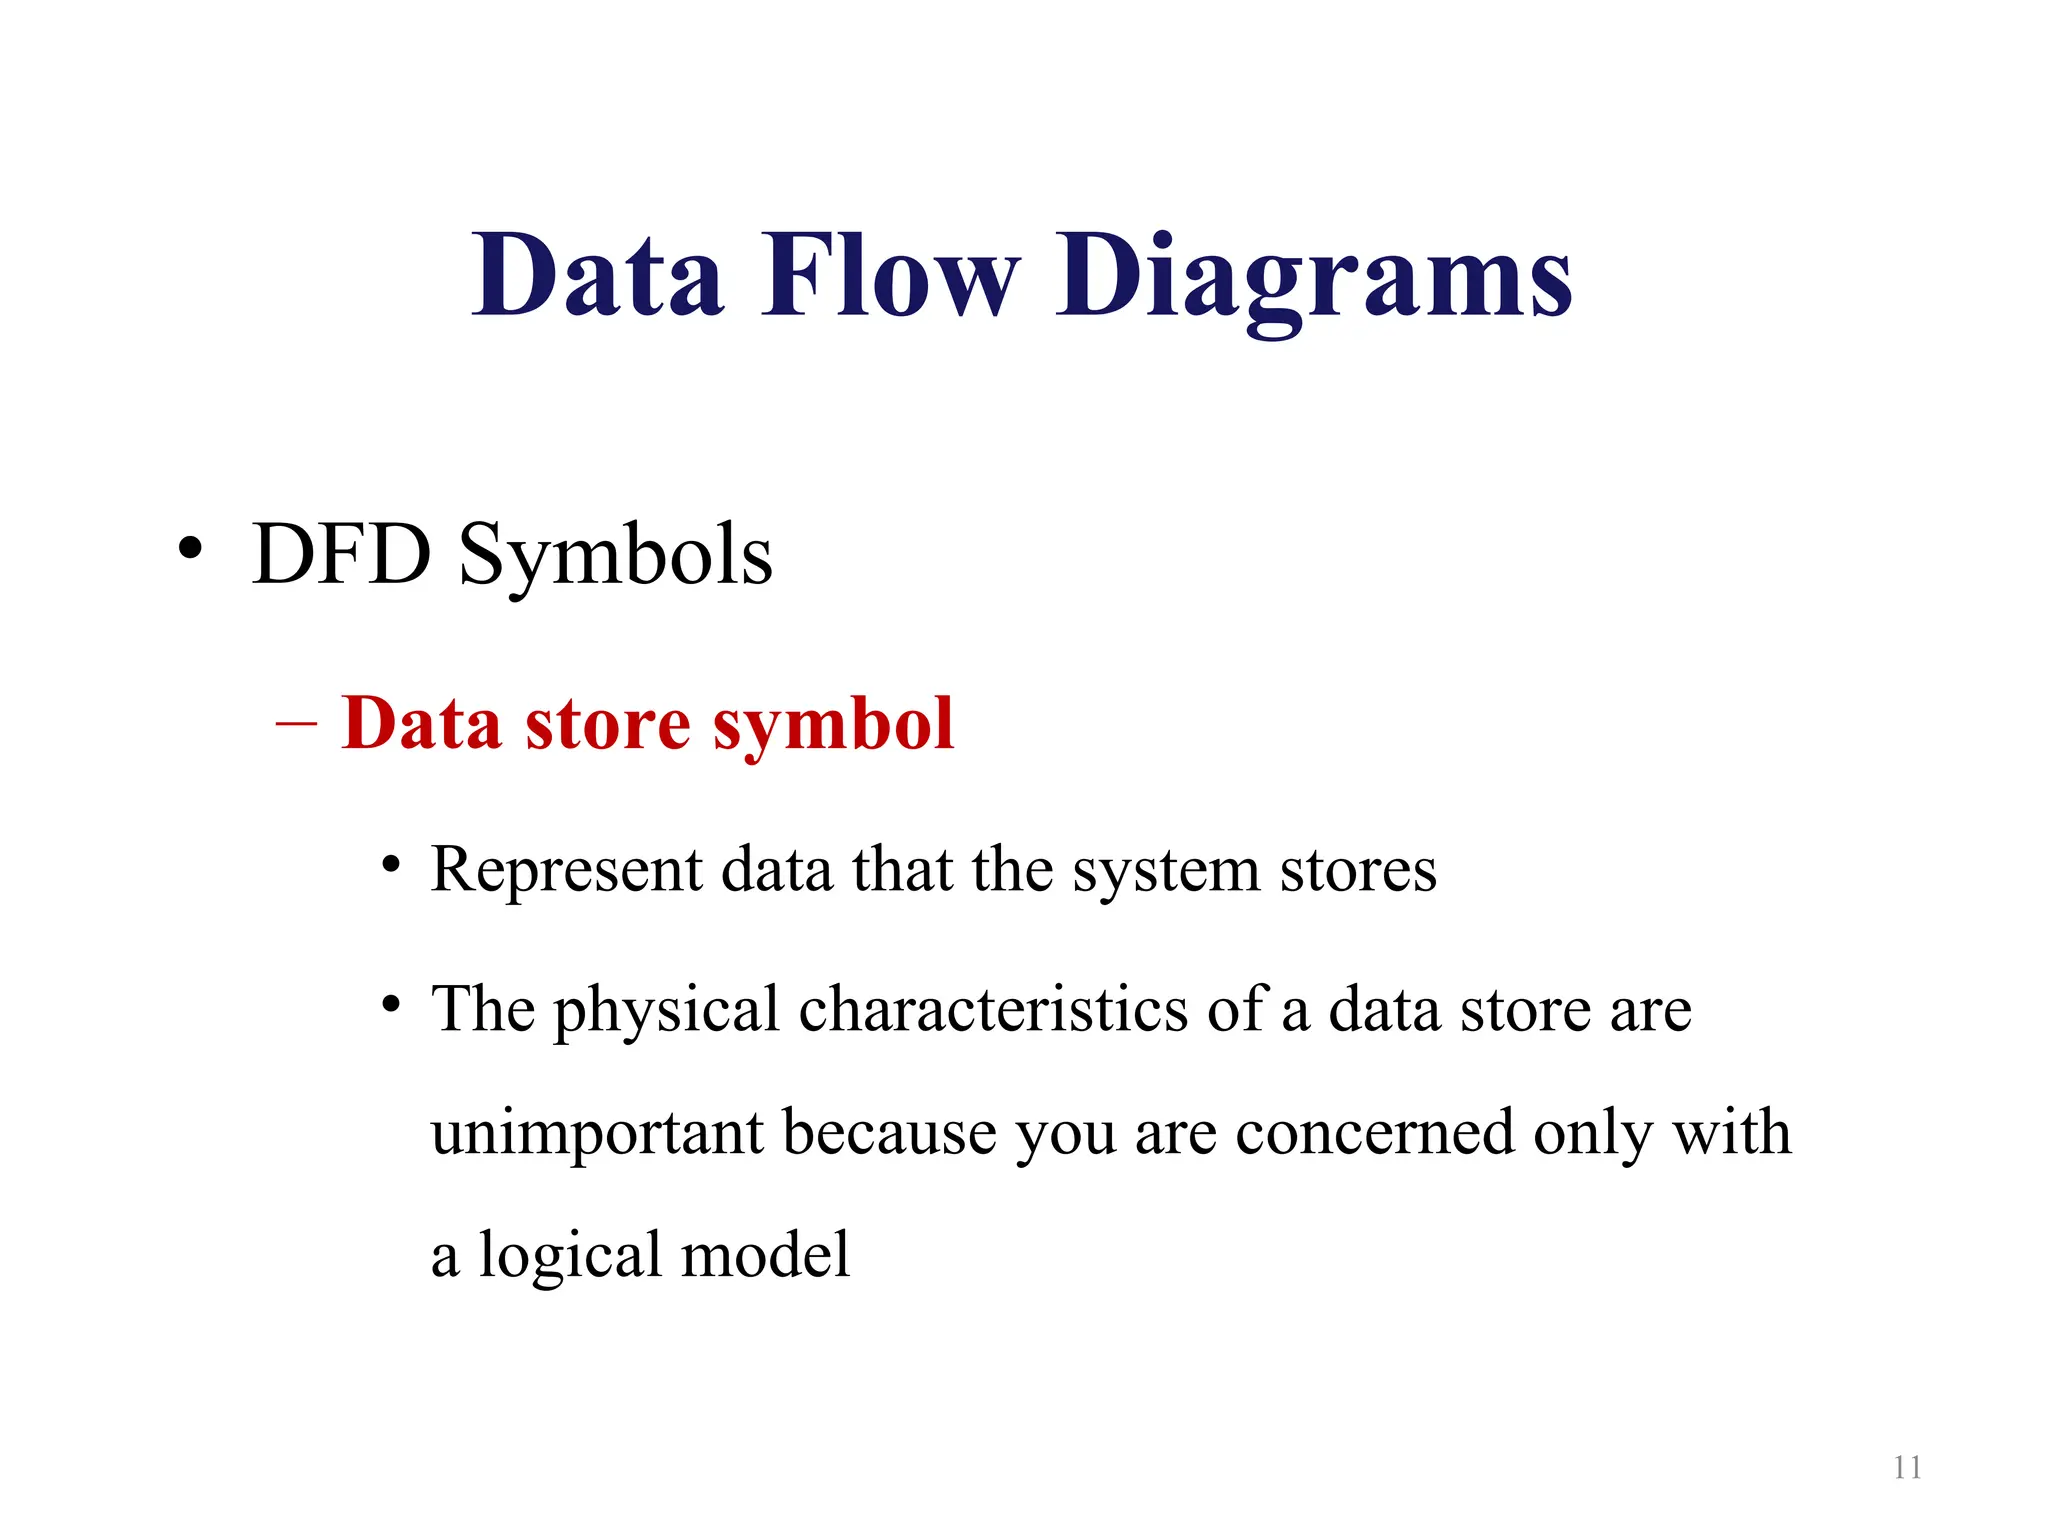
Data Flow Diagrams
•DFD Symbols
– Data flow symbol
– Data flow is a path for data to move from one part of the
information system to another.
• Represents one or more data items
• The symbol for a data flow is a line with a single or double arrowhead
– Impossible DFDs
– Spontaneous generation produces output but has no input
– Black hole has input but no output
– Gray hole has both, but input is not sufficient to create the output
9
11.
Data Flow Diagrams
•DFD Symbols
– Data store symbol
• Represent data that the system stores
• The physical characteristics of a data store are
unimportant because you are concerned only with
a logical model
11
12.
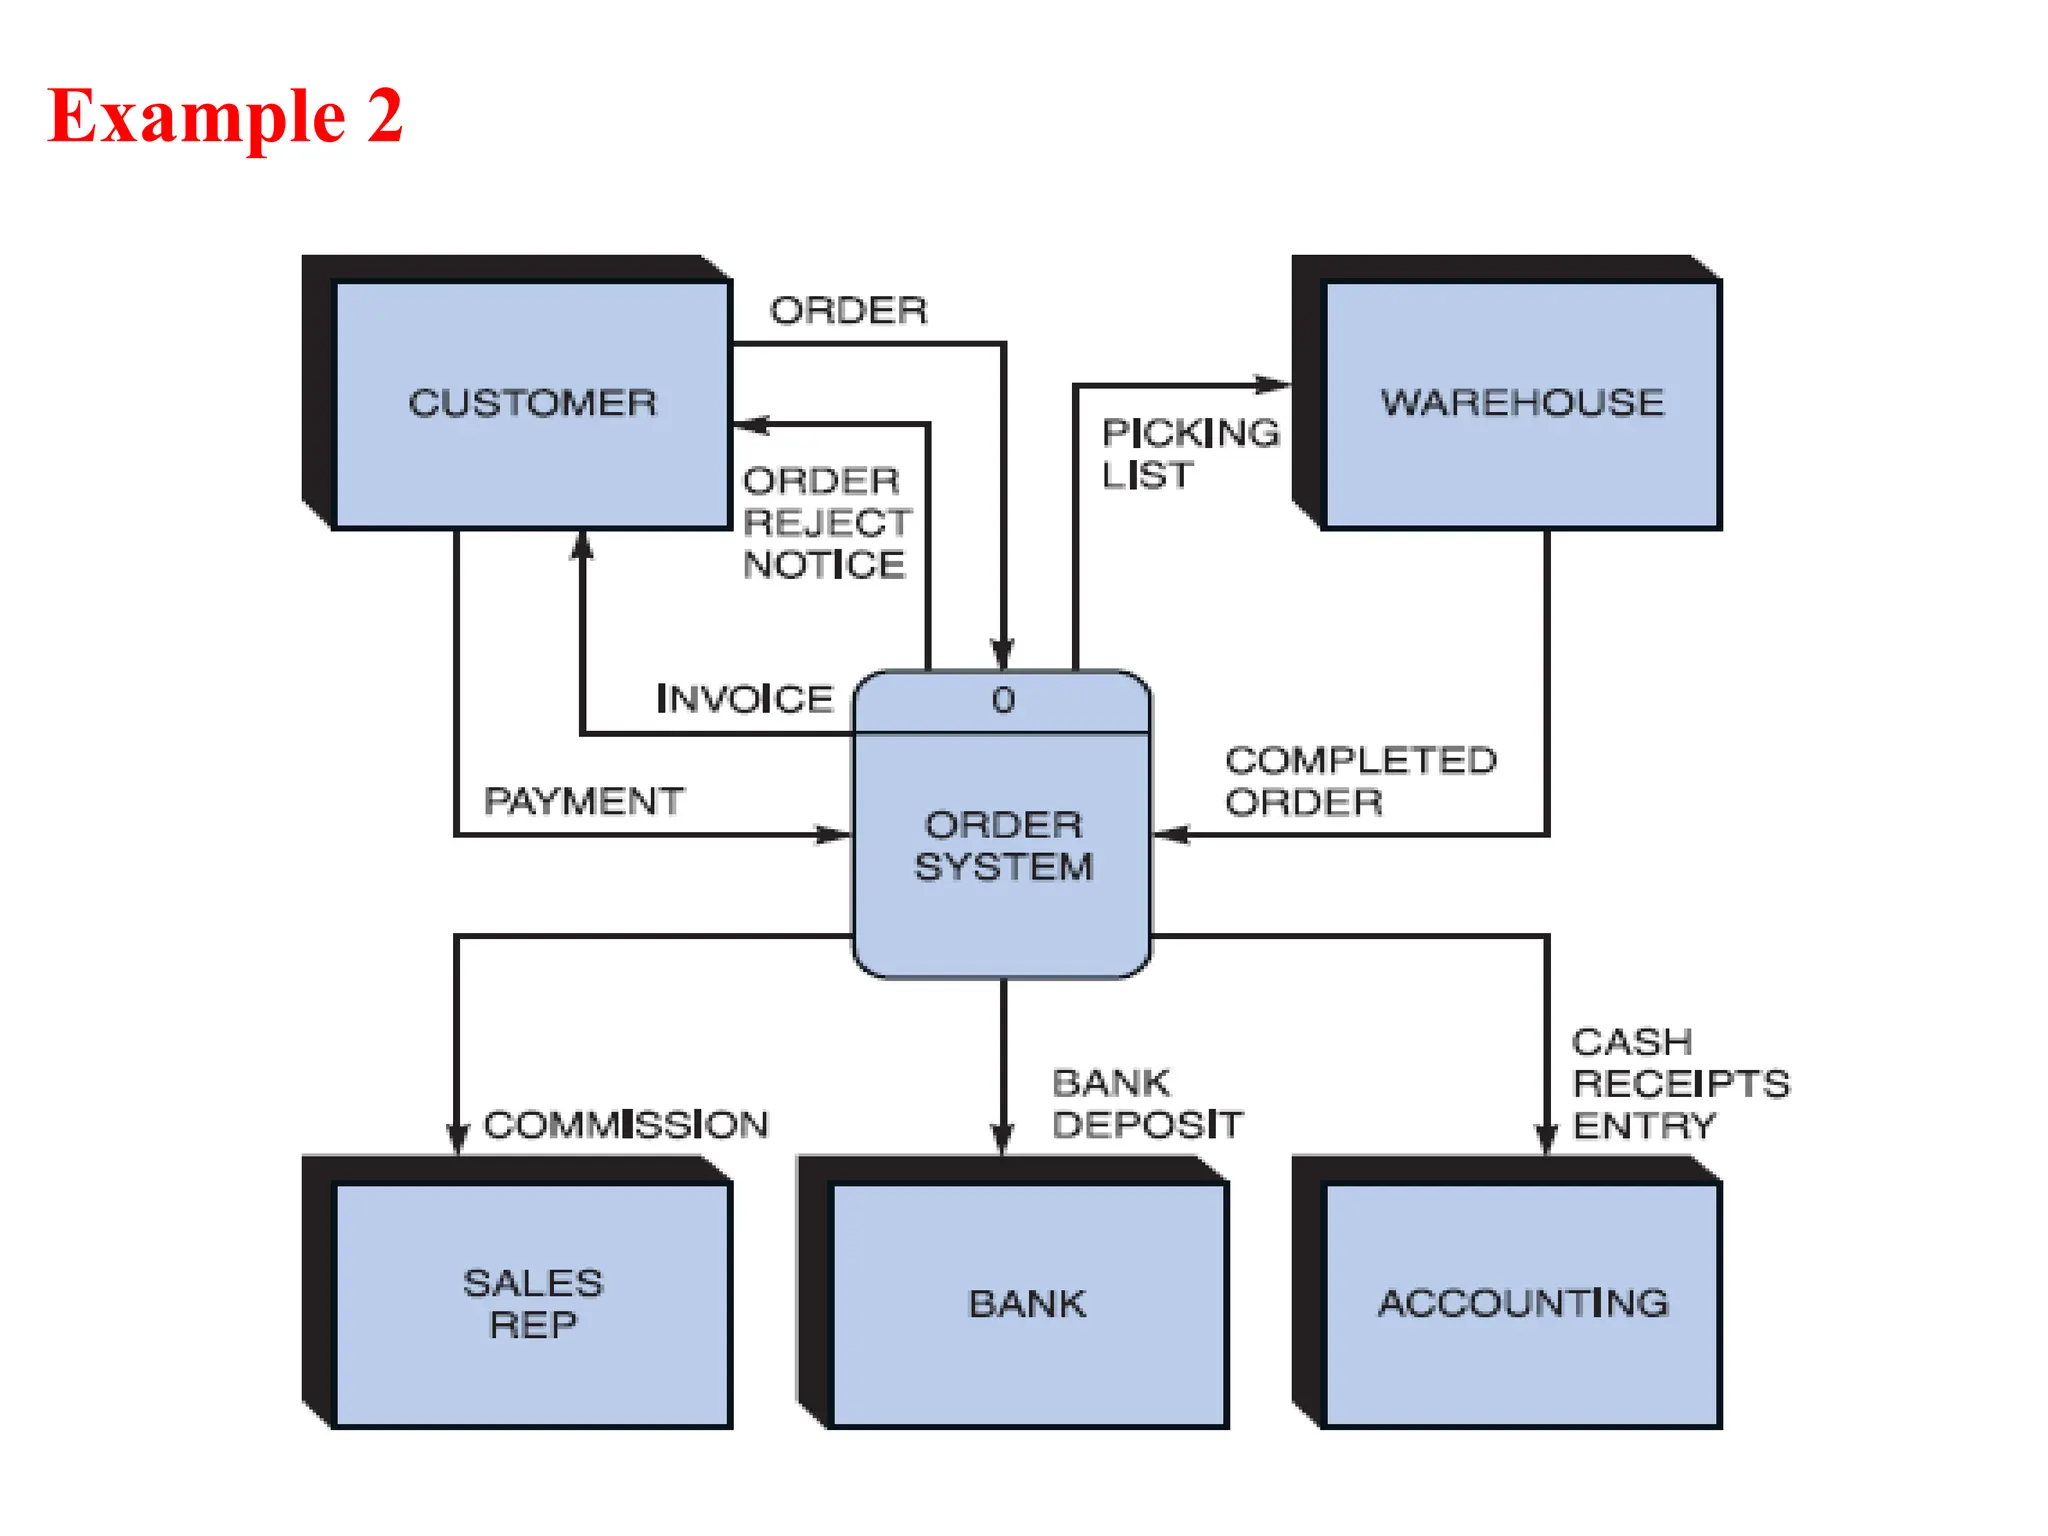
Two data storescannot be connected by a data flow
without an intervening process, and each data store must
have at least one outgoing and one incoming data flow.
13.
Data Flow Diagrams
•DFD Symbols
– Entity Symbol
• Name of the entity appears inside the symbol
• Shows External entities that provide data to
the system
Also called Terminators:
• Since they are the data origins or final
destinations
• Source: entity supplying data
• Sink: entity that receives data
• Each entity must be connected to a process
by a data flow
13
14.
Creating a Setof DFDs
• Create a graphical model of the information
system based on your fact-finding results
• Three-step process
– Step 1: Draw a context diagram
– Step 2: Draw a diagram 0 DFD
– Step 3: Draw the lower-level diagrams
14
15.
Creating a Setof DFDs
• Guidelines for Drawing DFDs
– Draw the context diagram so that it fits on one page
– Use the name of the information system as the process
name in the context diagram
– Use unique names within each set of symbols
– Do not cross lines
– Provide a unique name and reference number for each
process
– Obtain as much user input and feedback as possible
15
16.
Creating a Setof DFDs
• Step 1: Draw a Context Diagram
– Context diagram is a top-level view of an information
system that shows the system’s boundaries and scope.
– Most general view
– Start with process 0 (Black Box)
– Data stores are not shown in the context diagram.
16
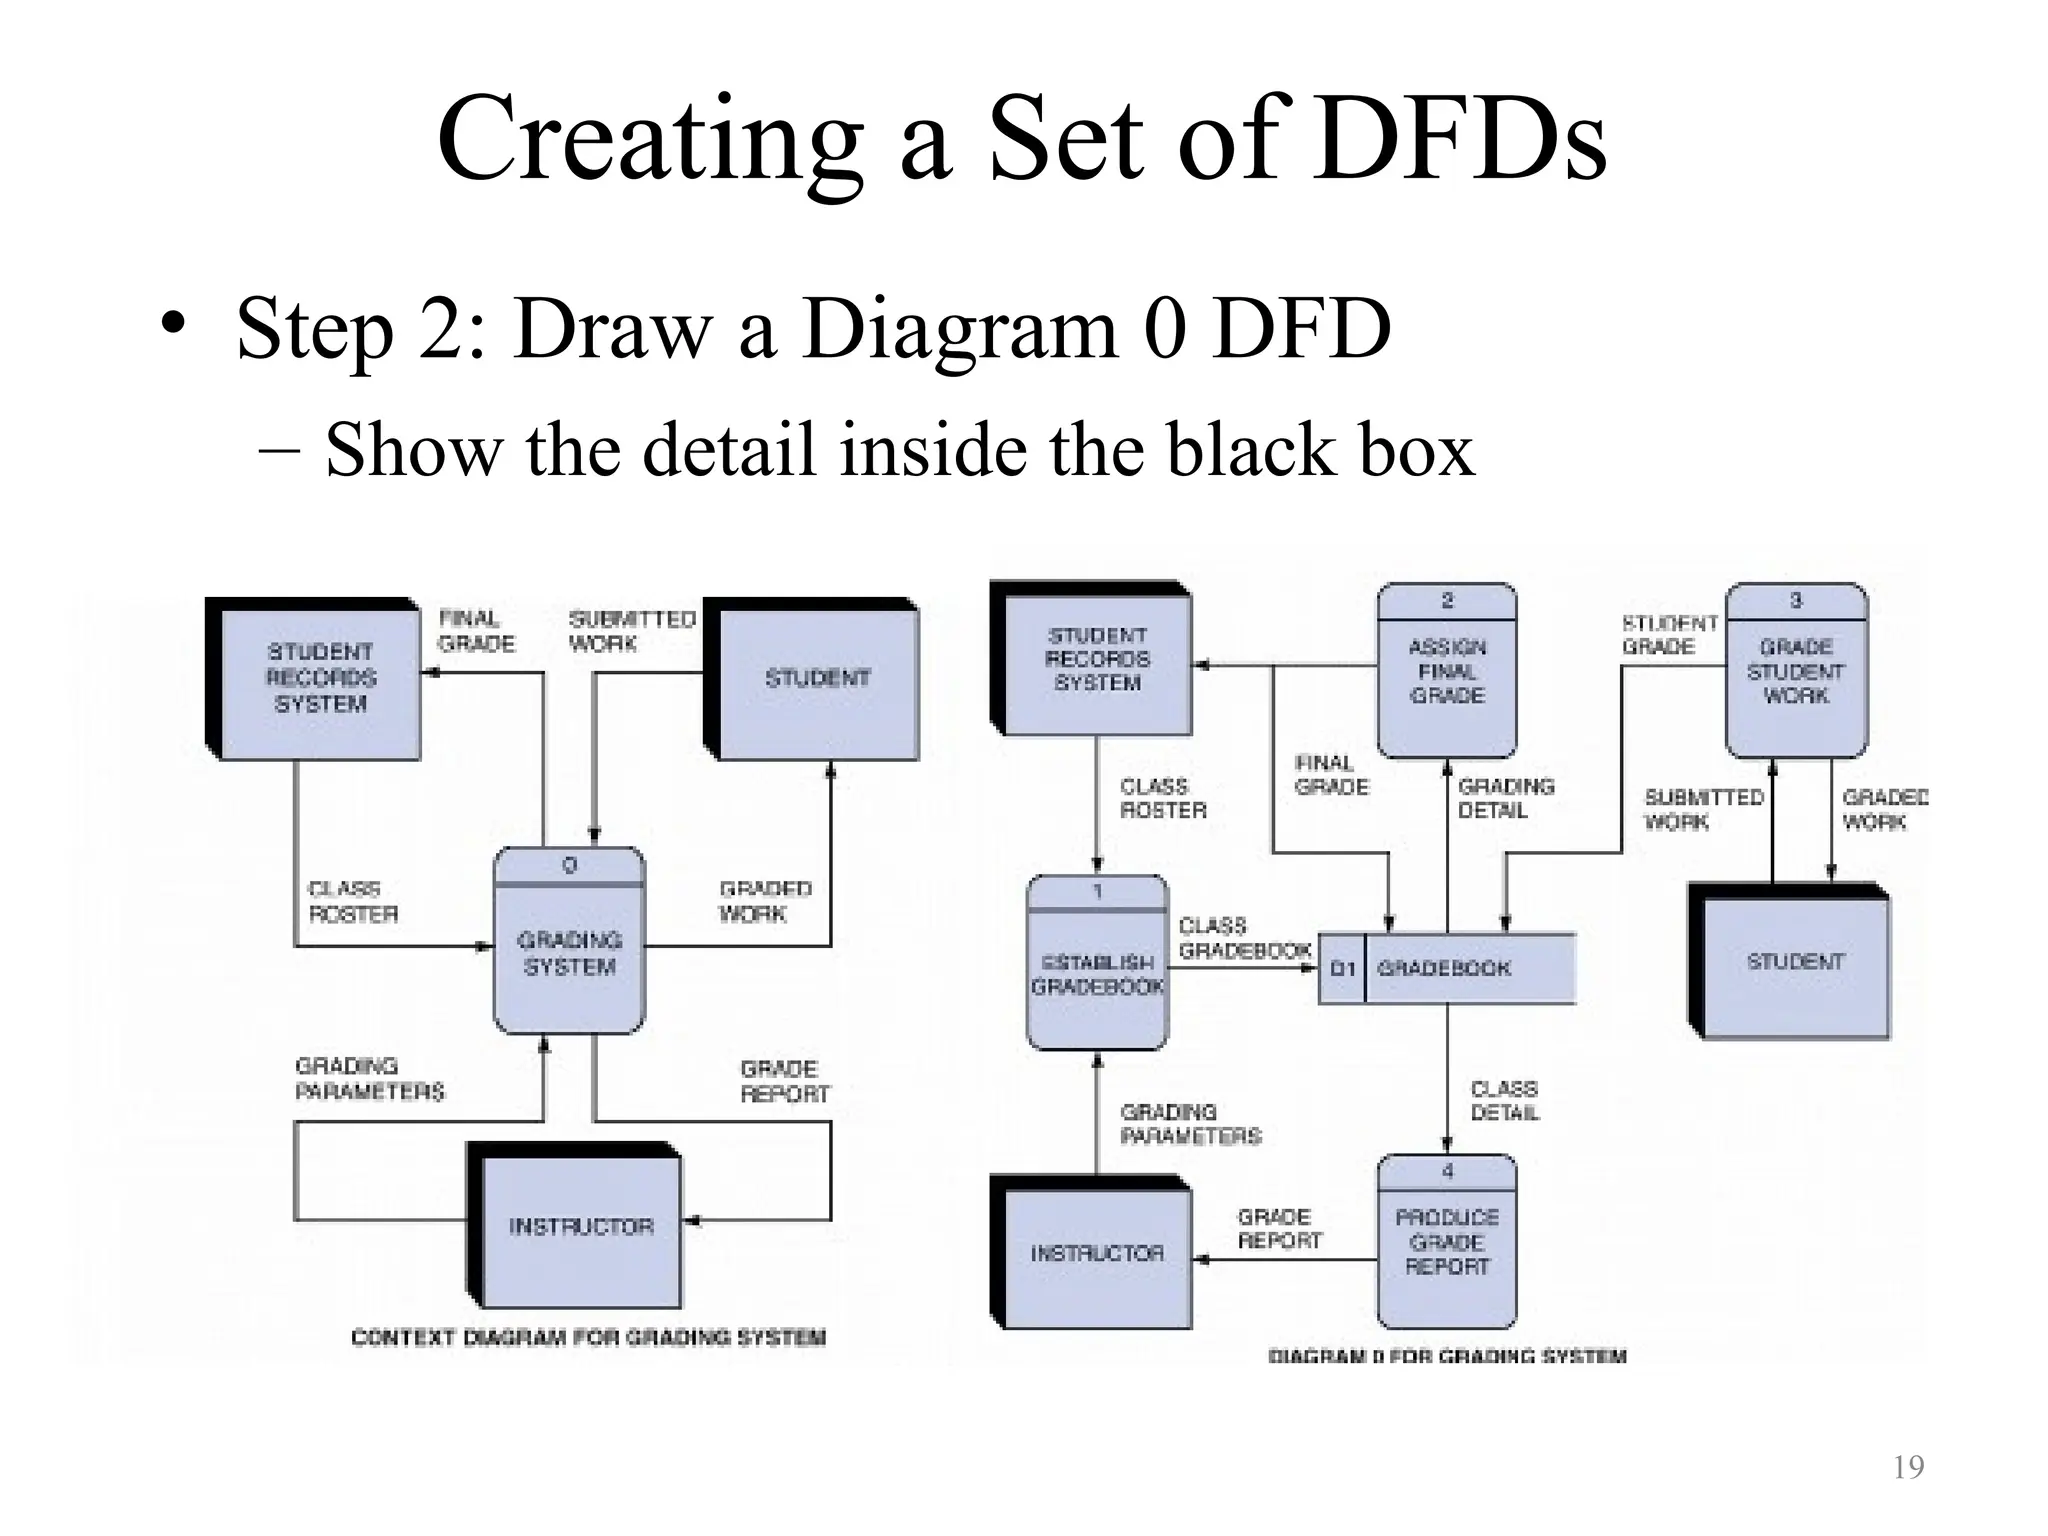
Creating a Setof DFDs
• Step 2: Draw a Diagram 0 DFD
– Show the detail inside the black box
19
20.
Creating a Setof DFDs
• Step 2: Draw a Diagram 0 DFD
– If same data flows in both directions, you can use a double-
headed arrow
– A diverging data flow is a data flow in which the same data
travels to two or more different locations.
– Diagram 0 is an exploded view of process 0
• Parent diagram: higher-level diagram of an exploded DFD
• Child diagram: lower-level diagram of an exploded DFD
– Functional primitive:
• A process that consists of a single function that is not exploded further
20
#1 This repository of slides is intended to support the named chapter. The slide repository should be used as follows:
Copy the file to a unique name for your course and unit.
Edit the file by deleting those slides you don’t want to cover, editing other slides as appropriate to your course, and adding slides as desired.
Print the slides to produce transparency masters or print directly to film or present the slides using a computer image projector.
Each slide includes instructor notes. To view those notes in PowerPoint, click-left on the View Menu; then click left on Notes View sub-menu. You may need to scroll down to see the instructor notes.
The instructor notes are also available in hardcopy as the Instructor Guide to Accompany Systems Analysis and Design Methods, 6/ed.