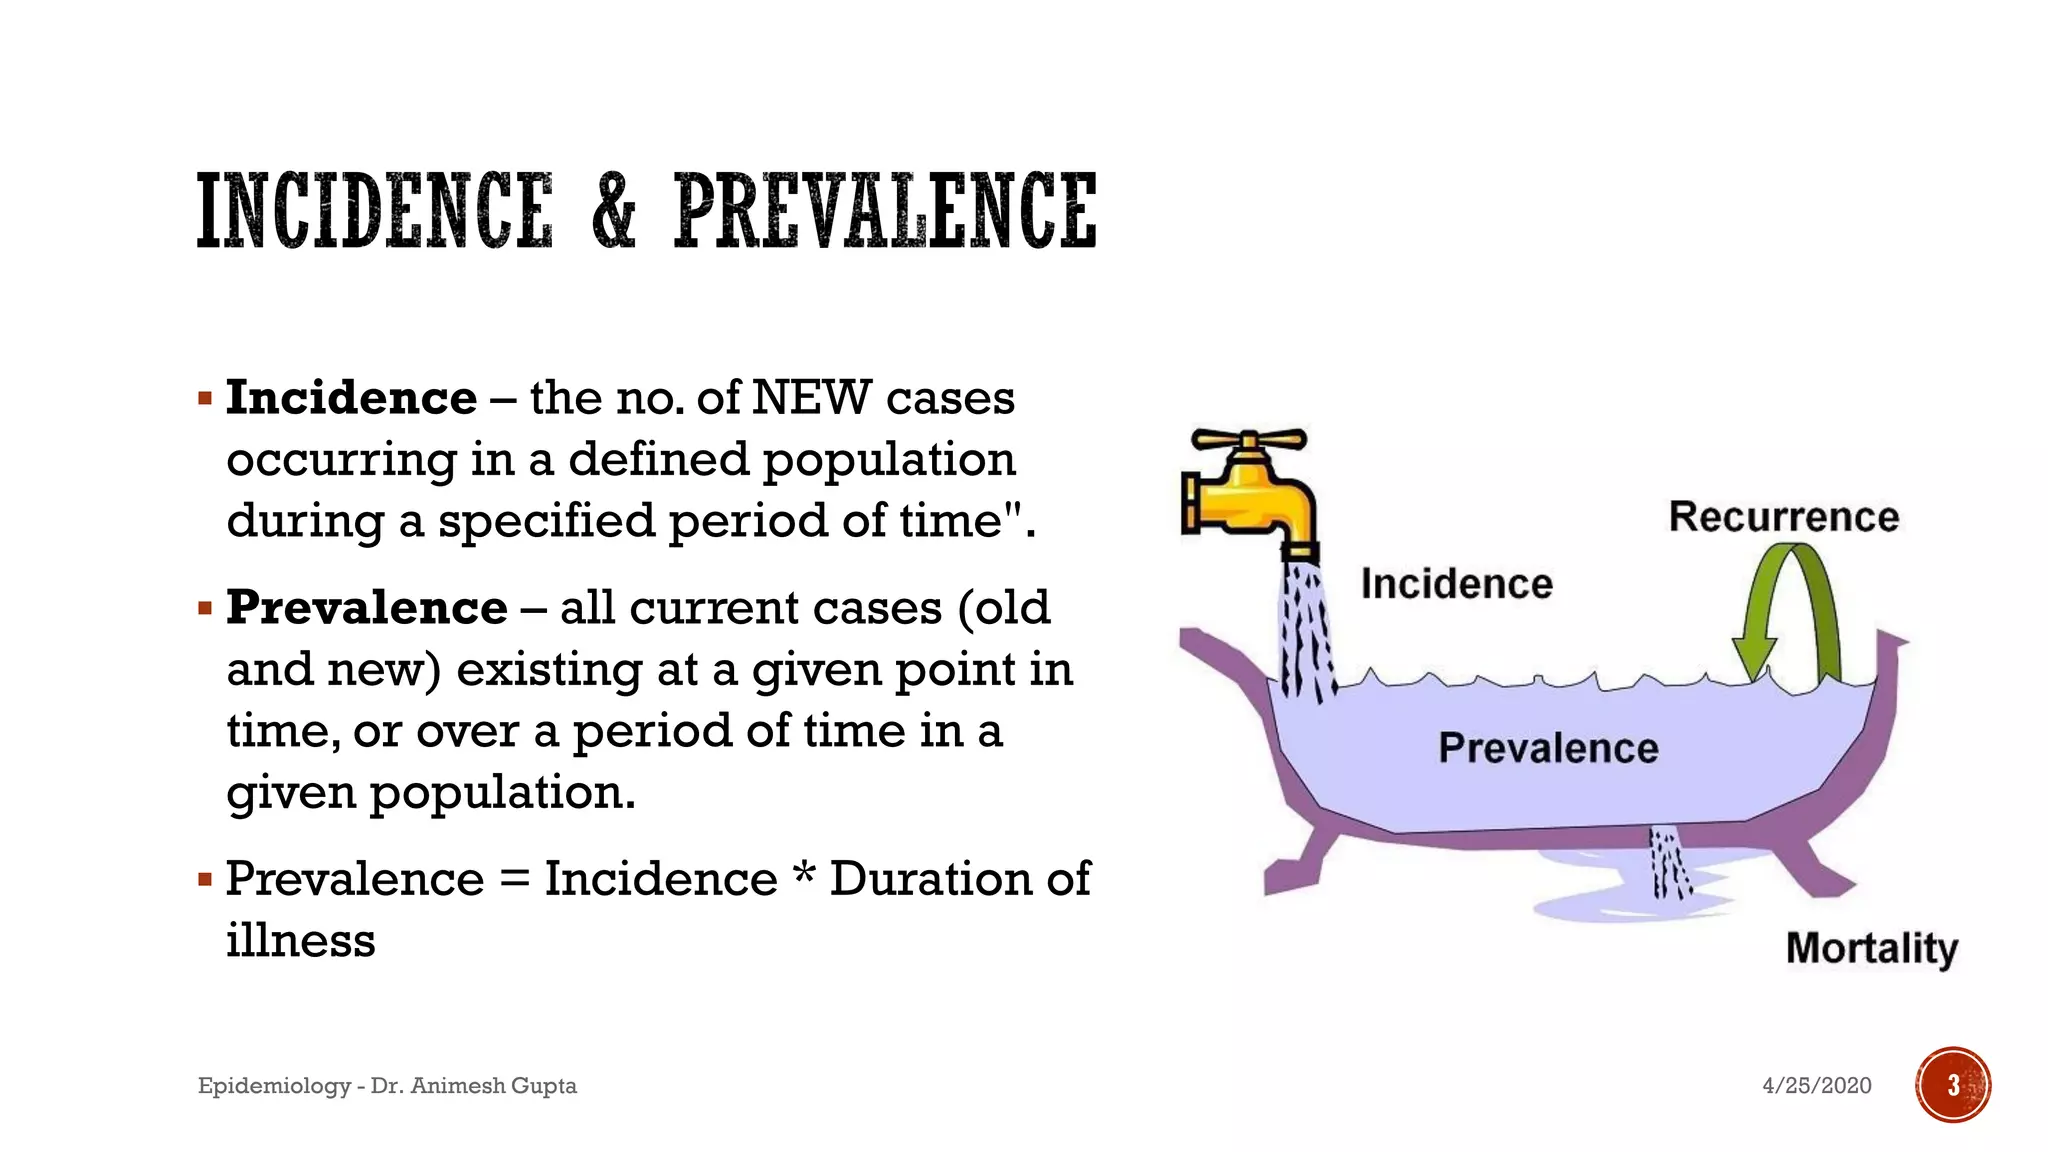
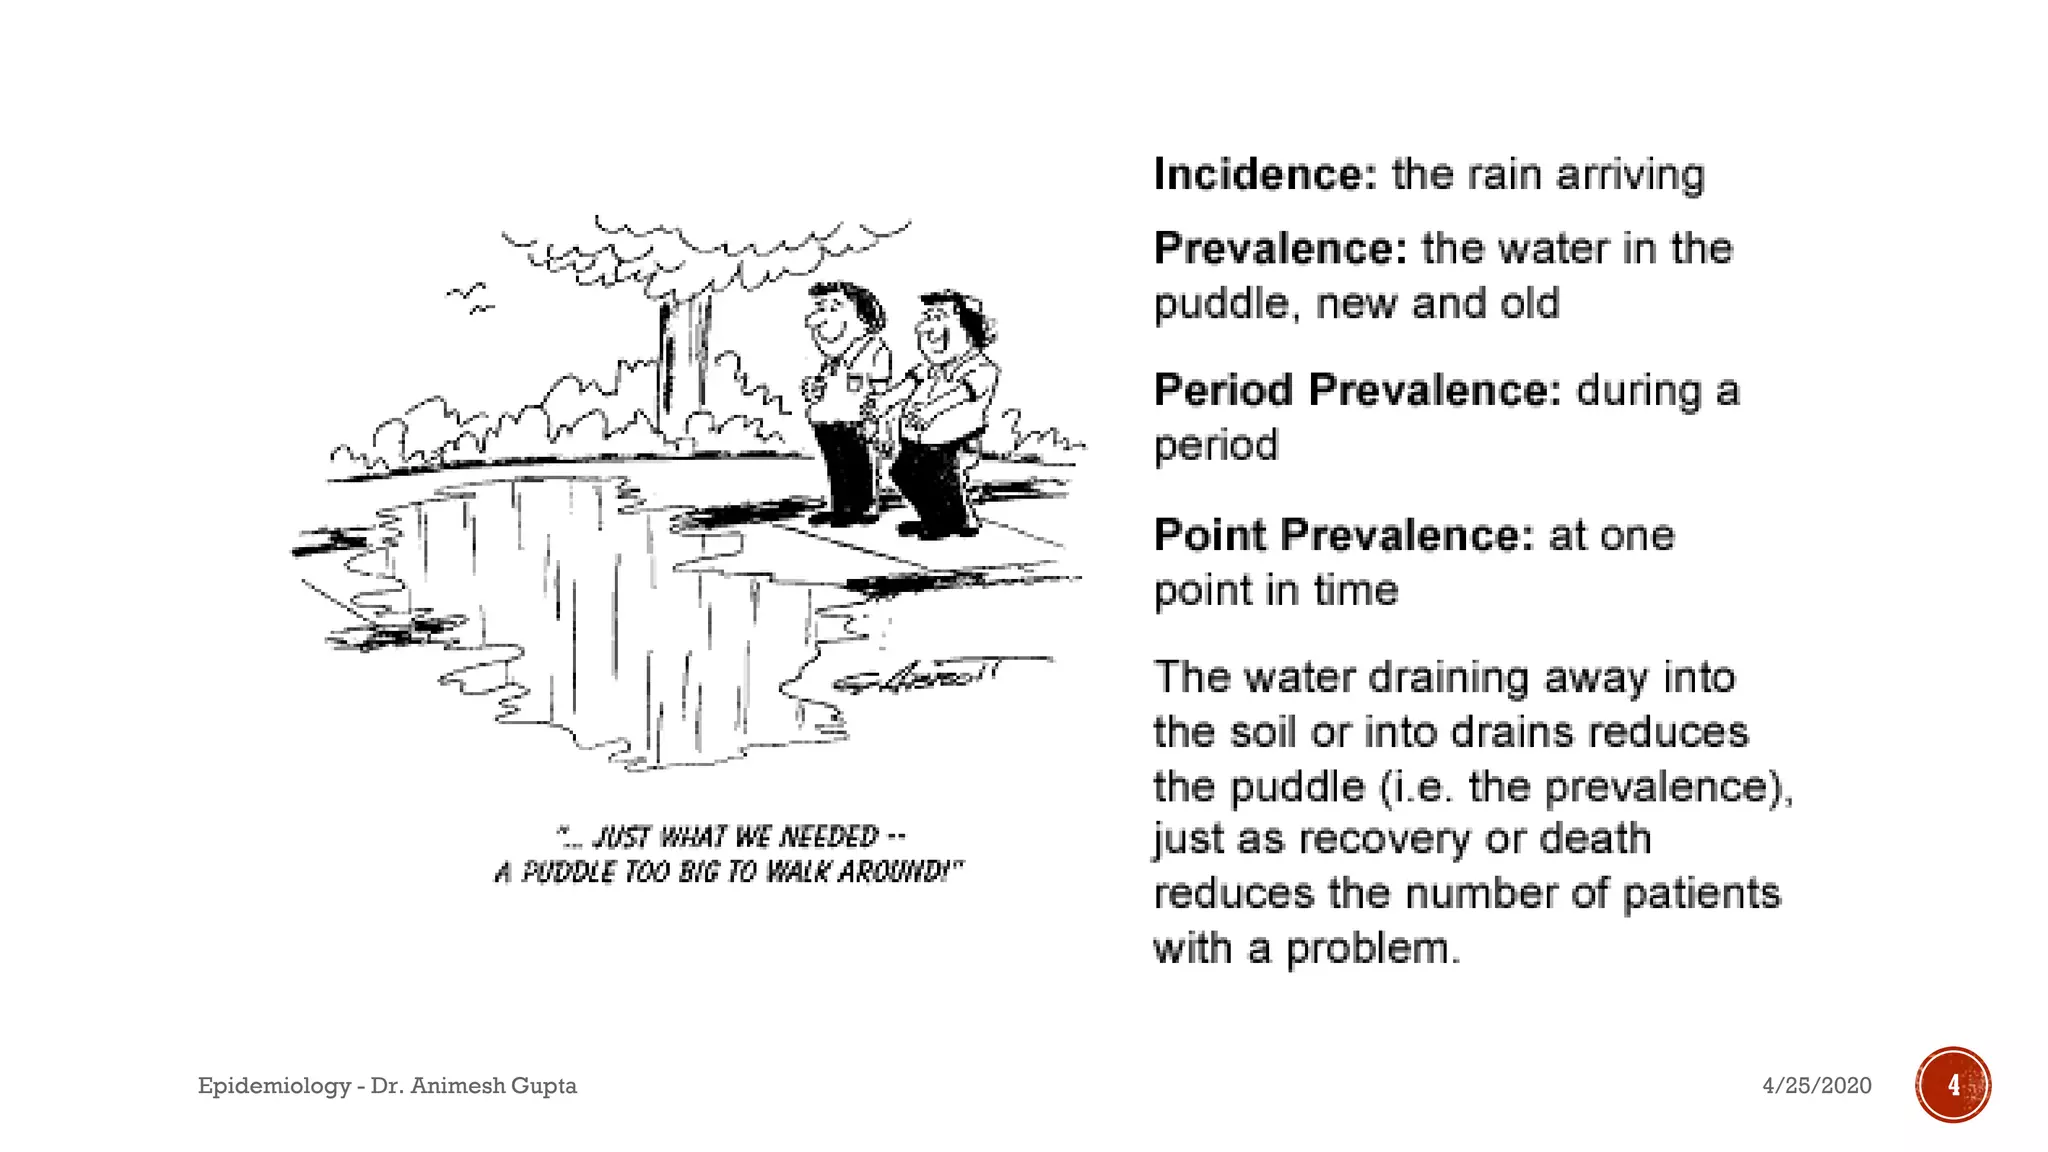
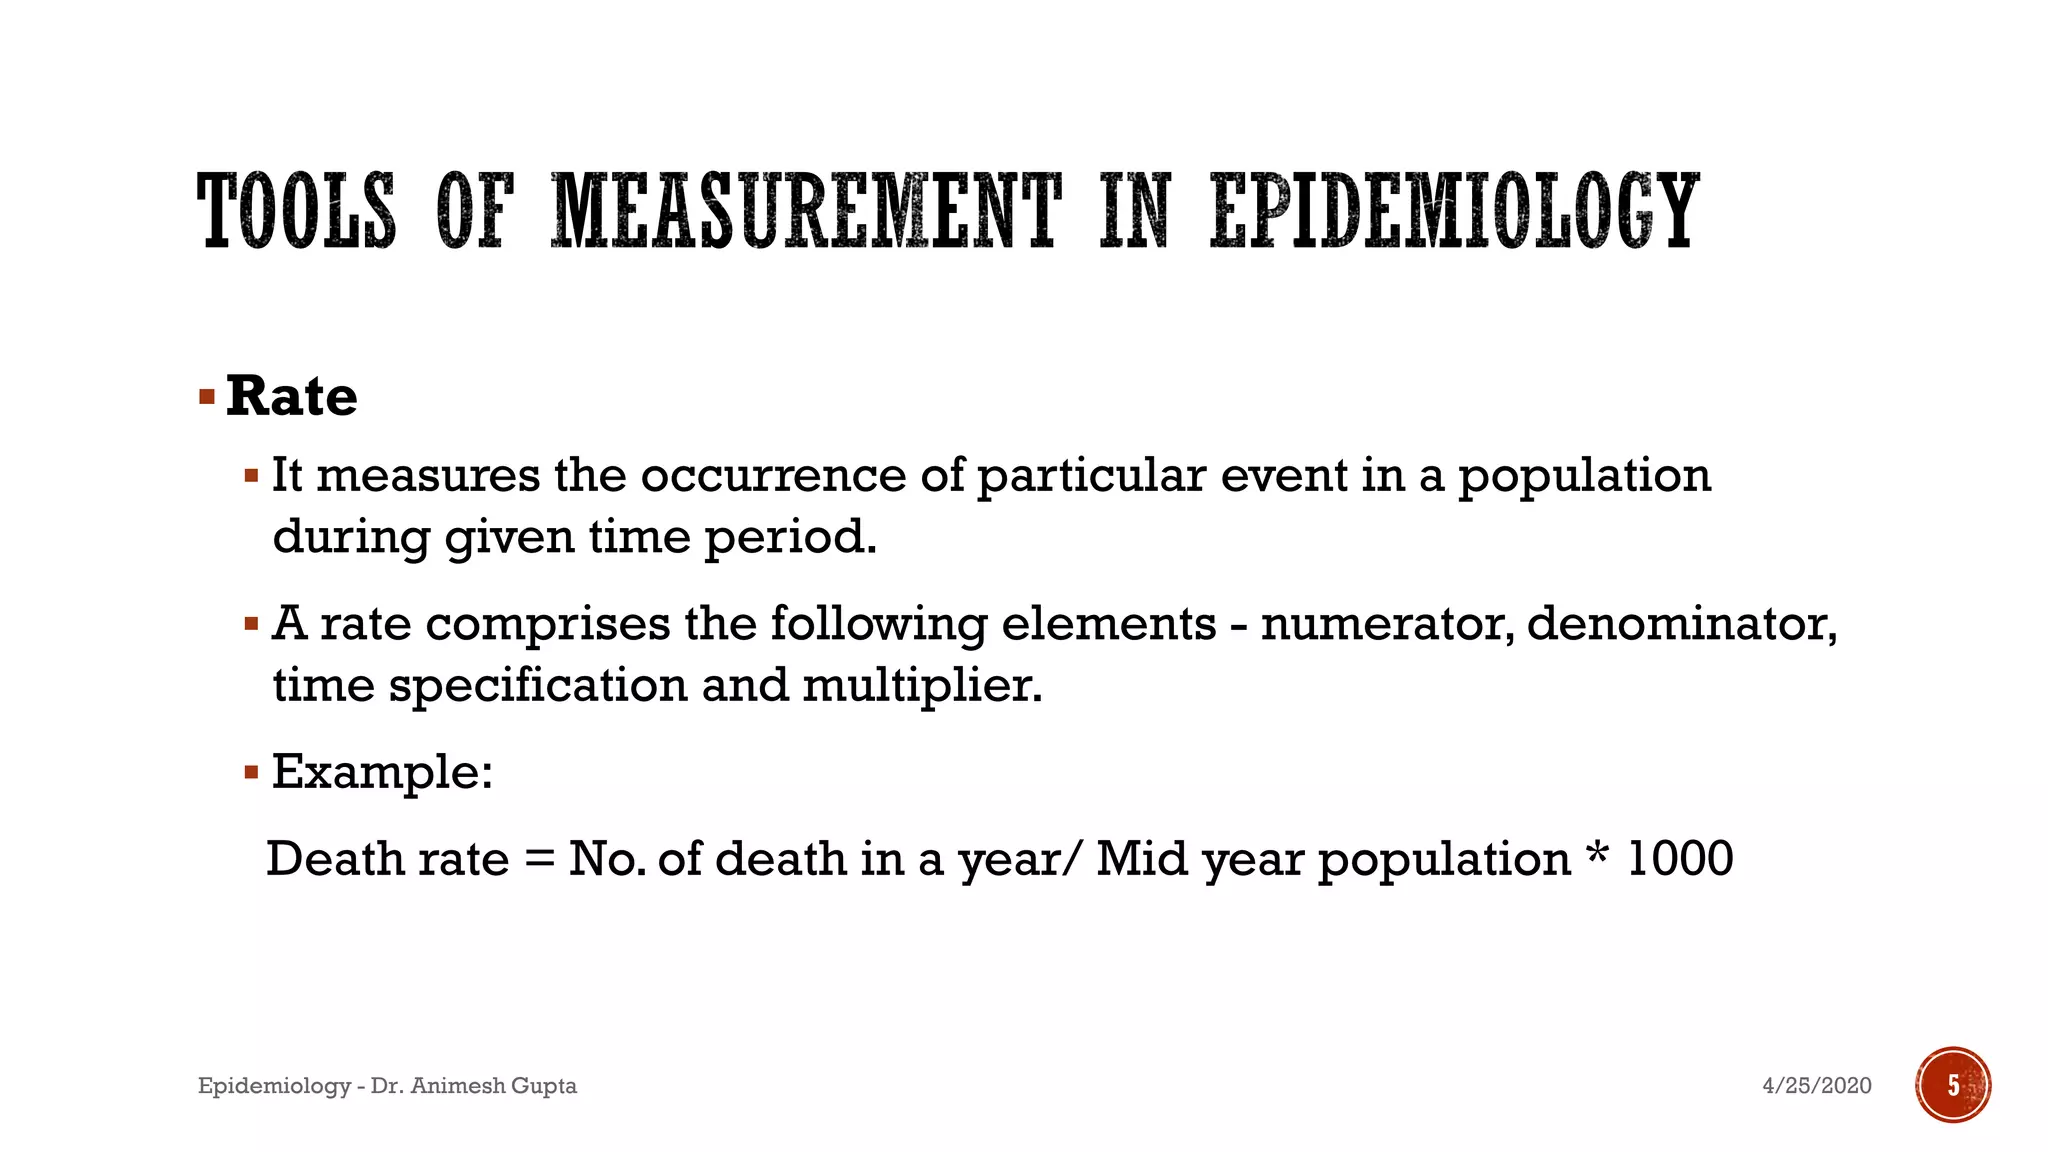
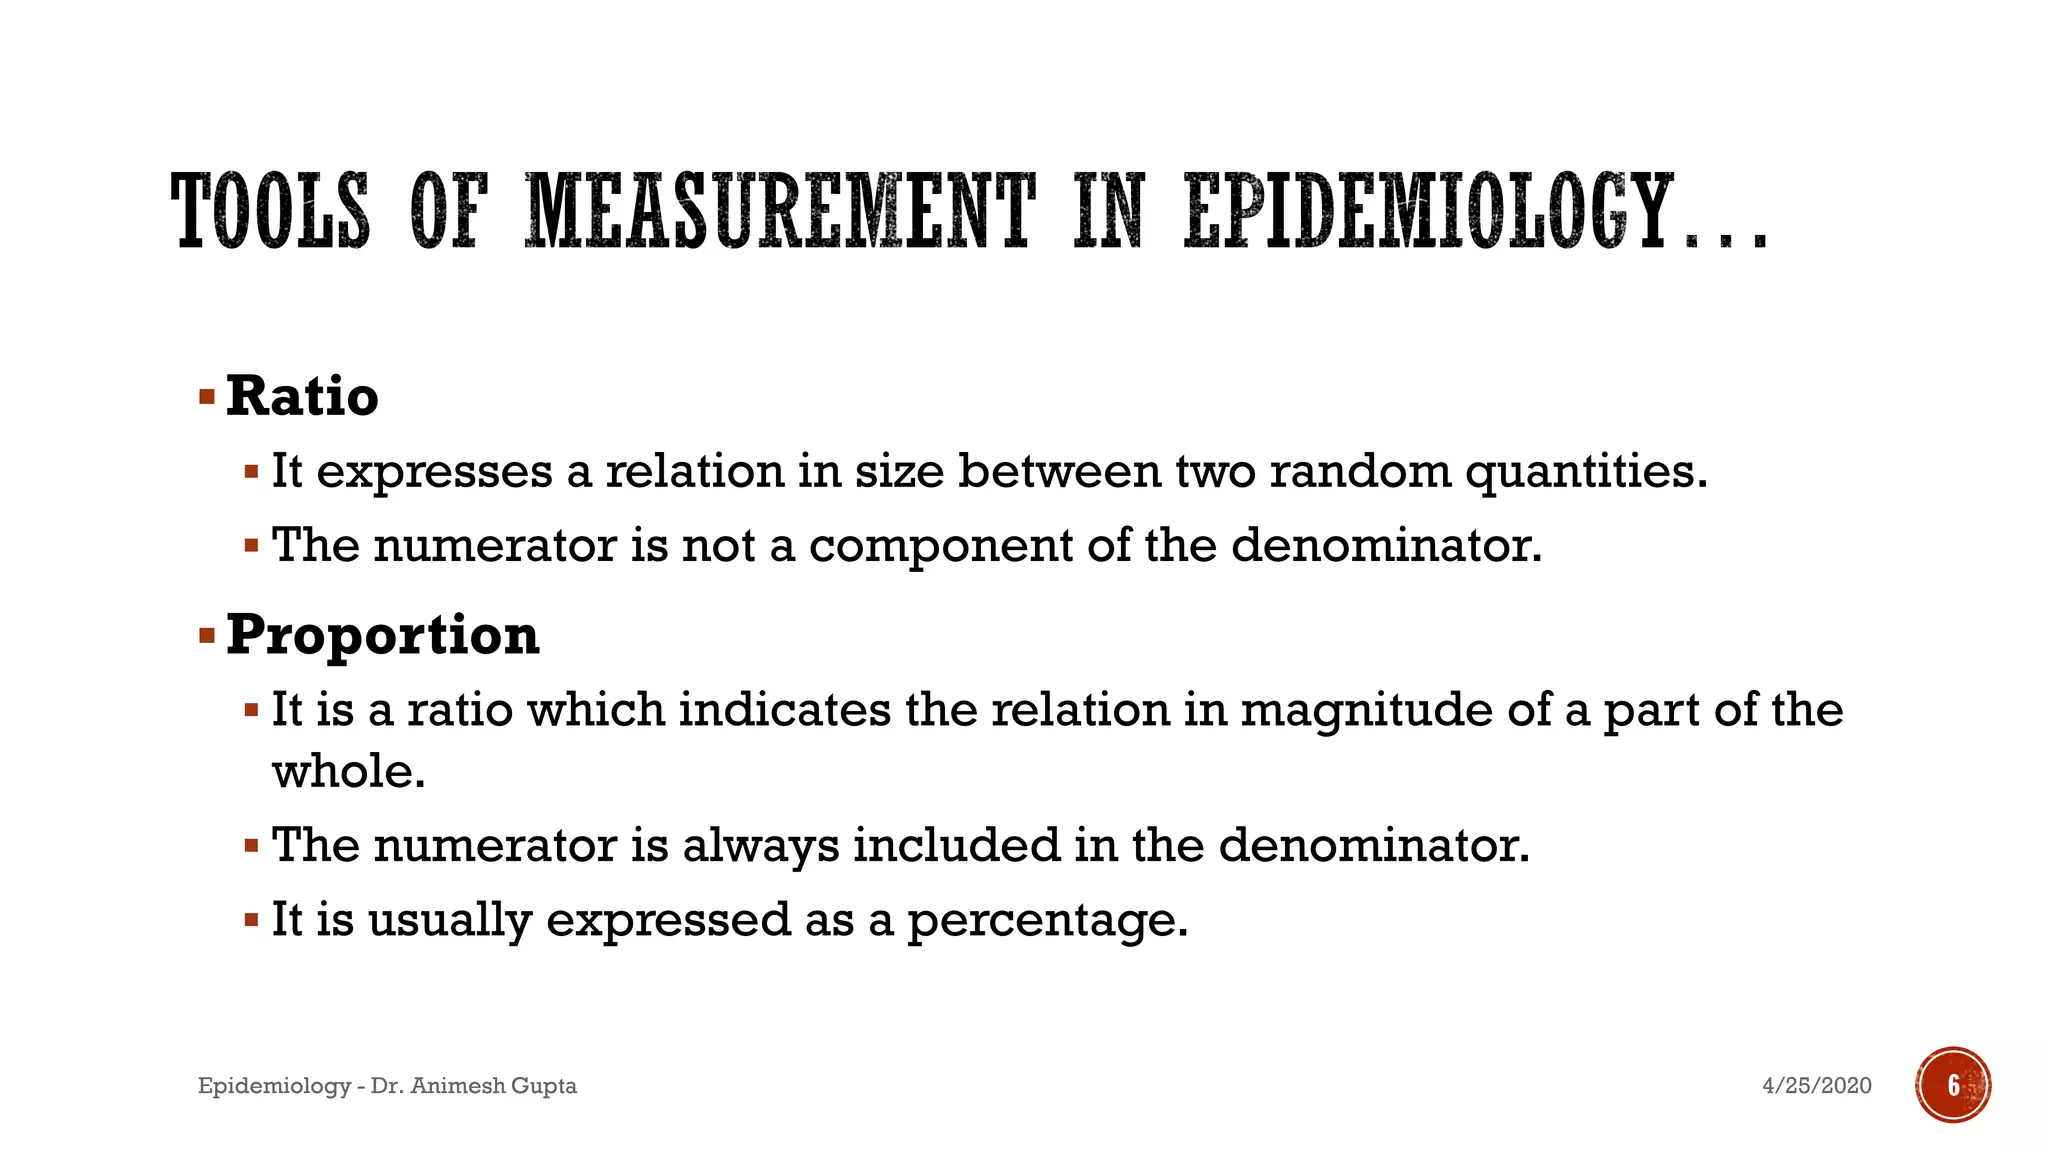
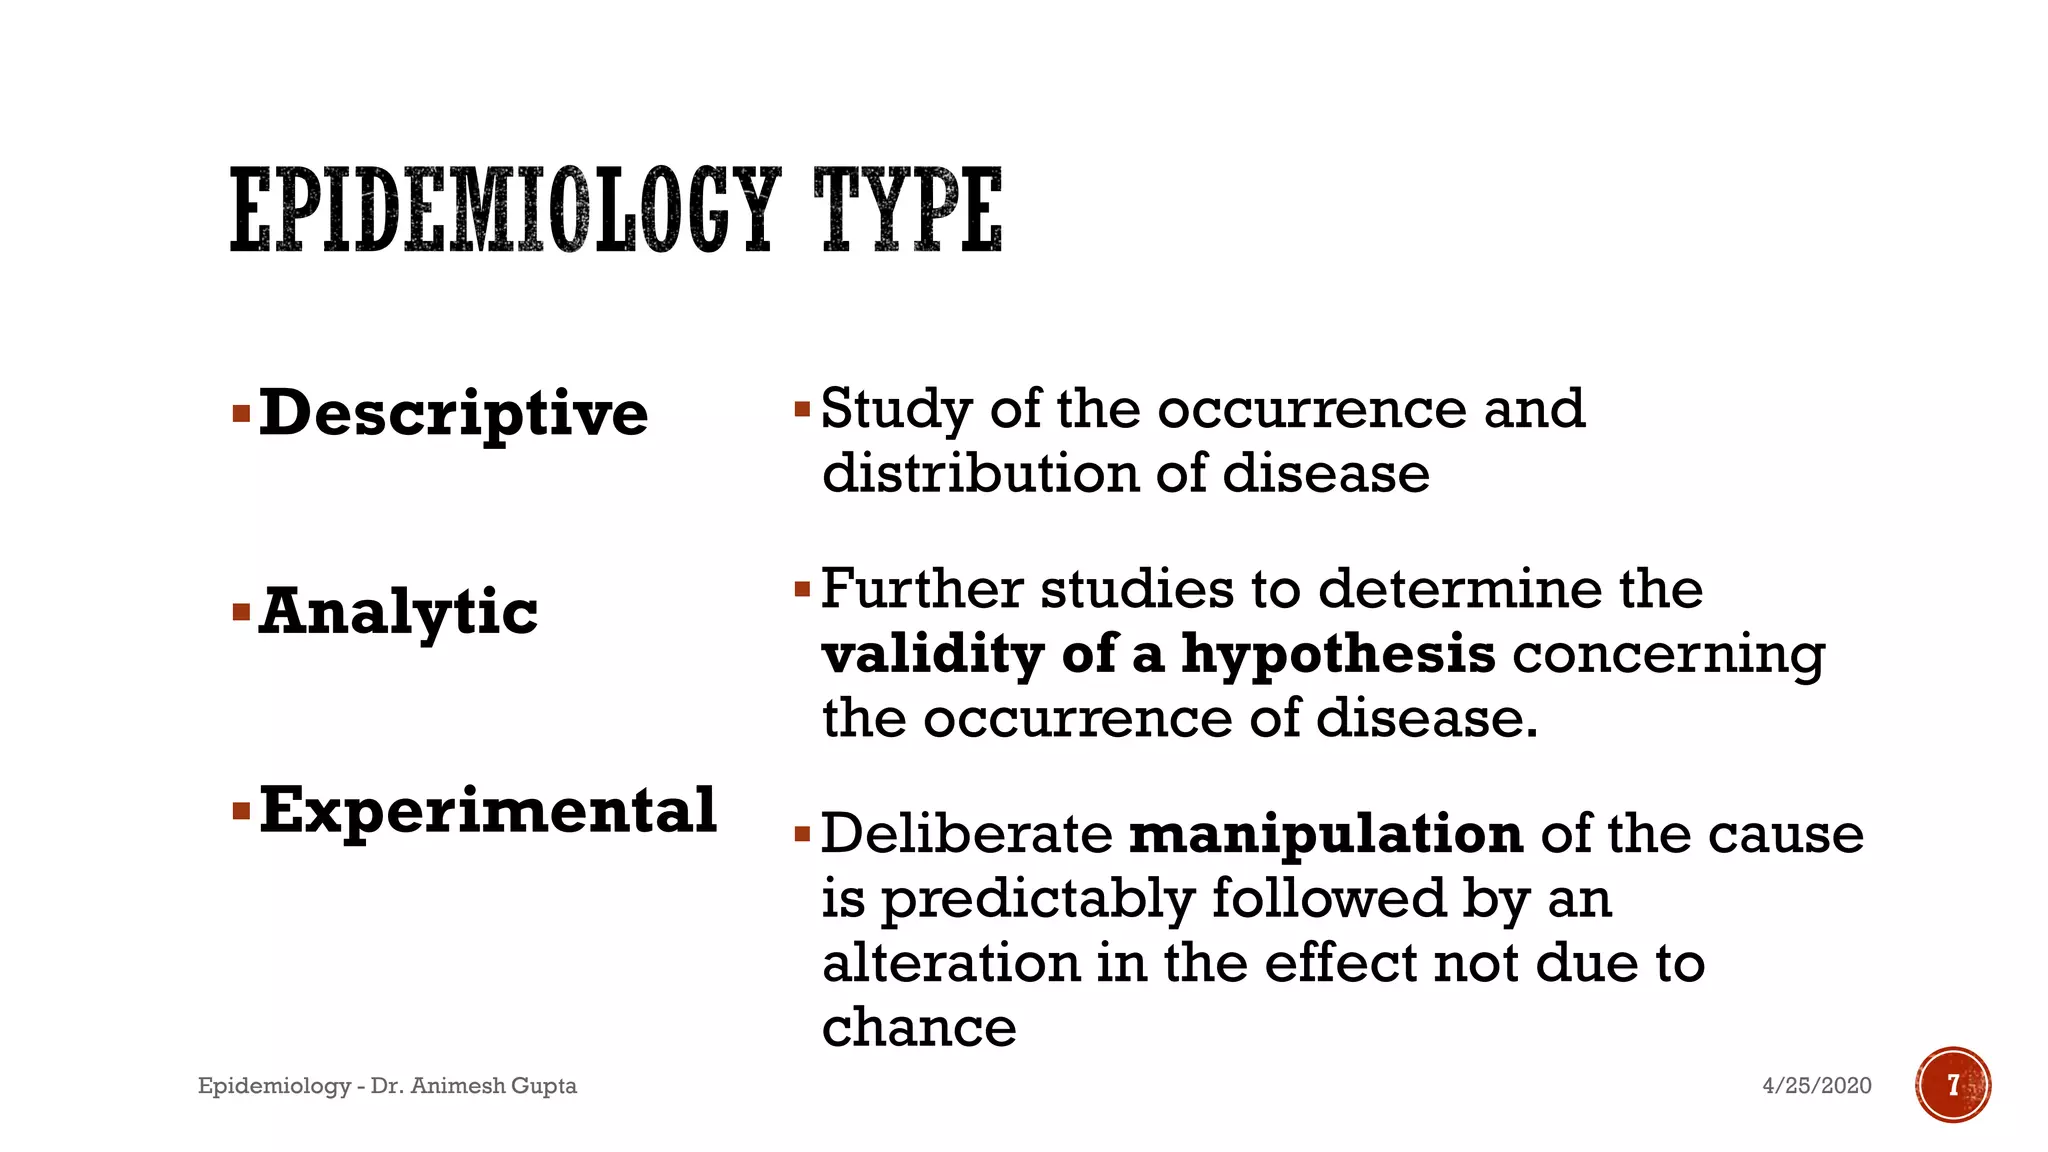
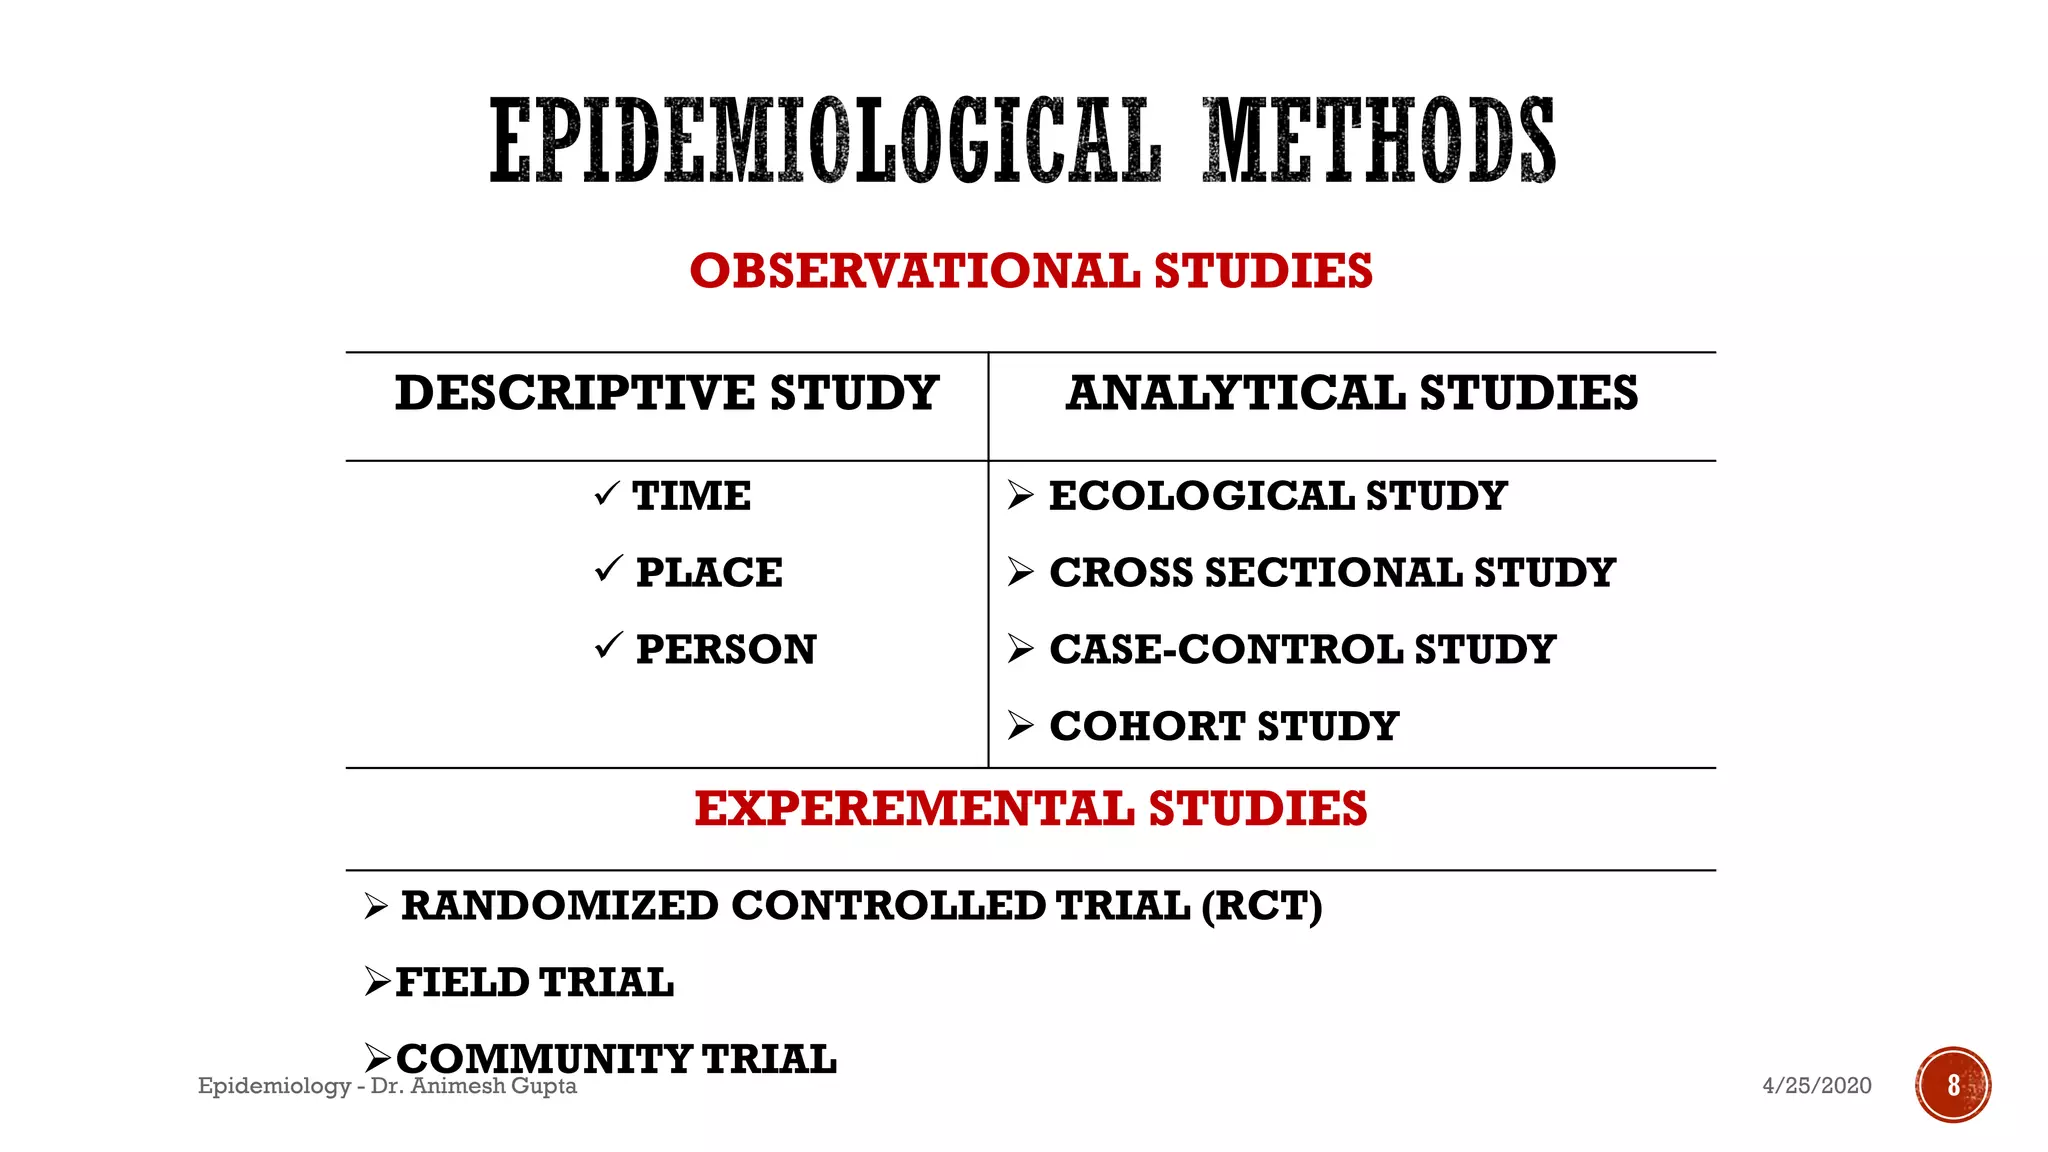
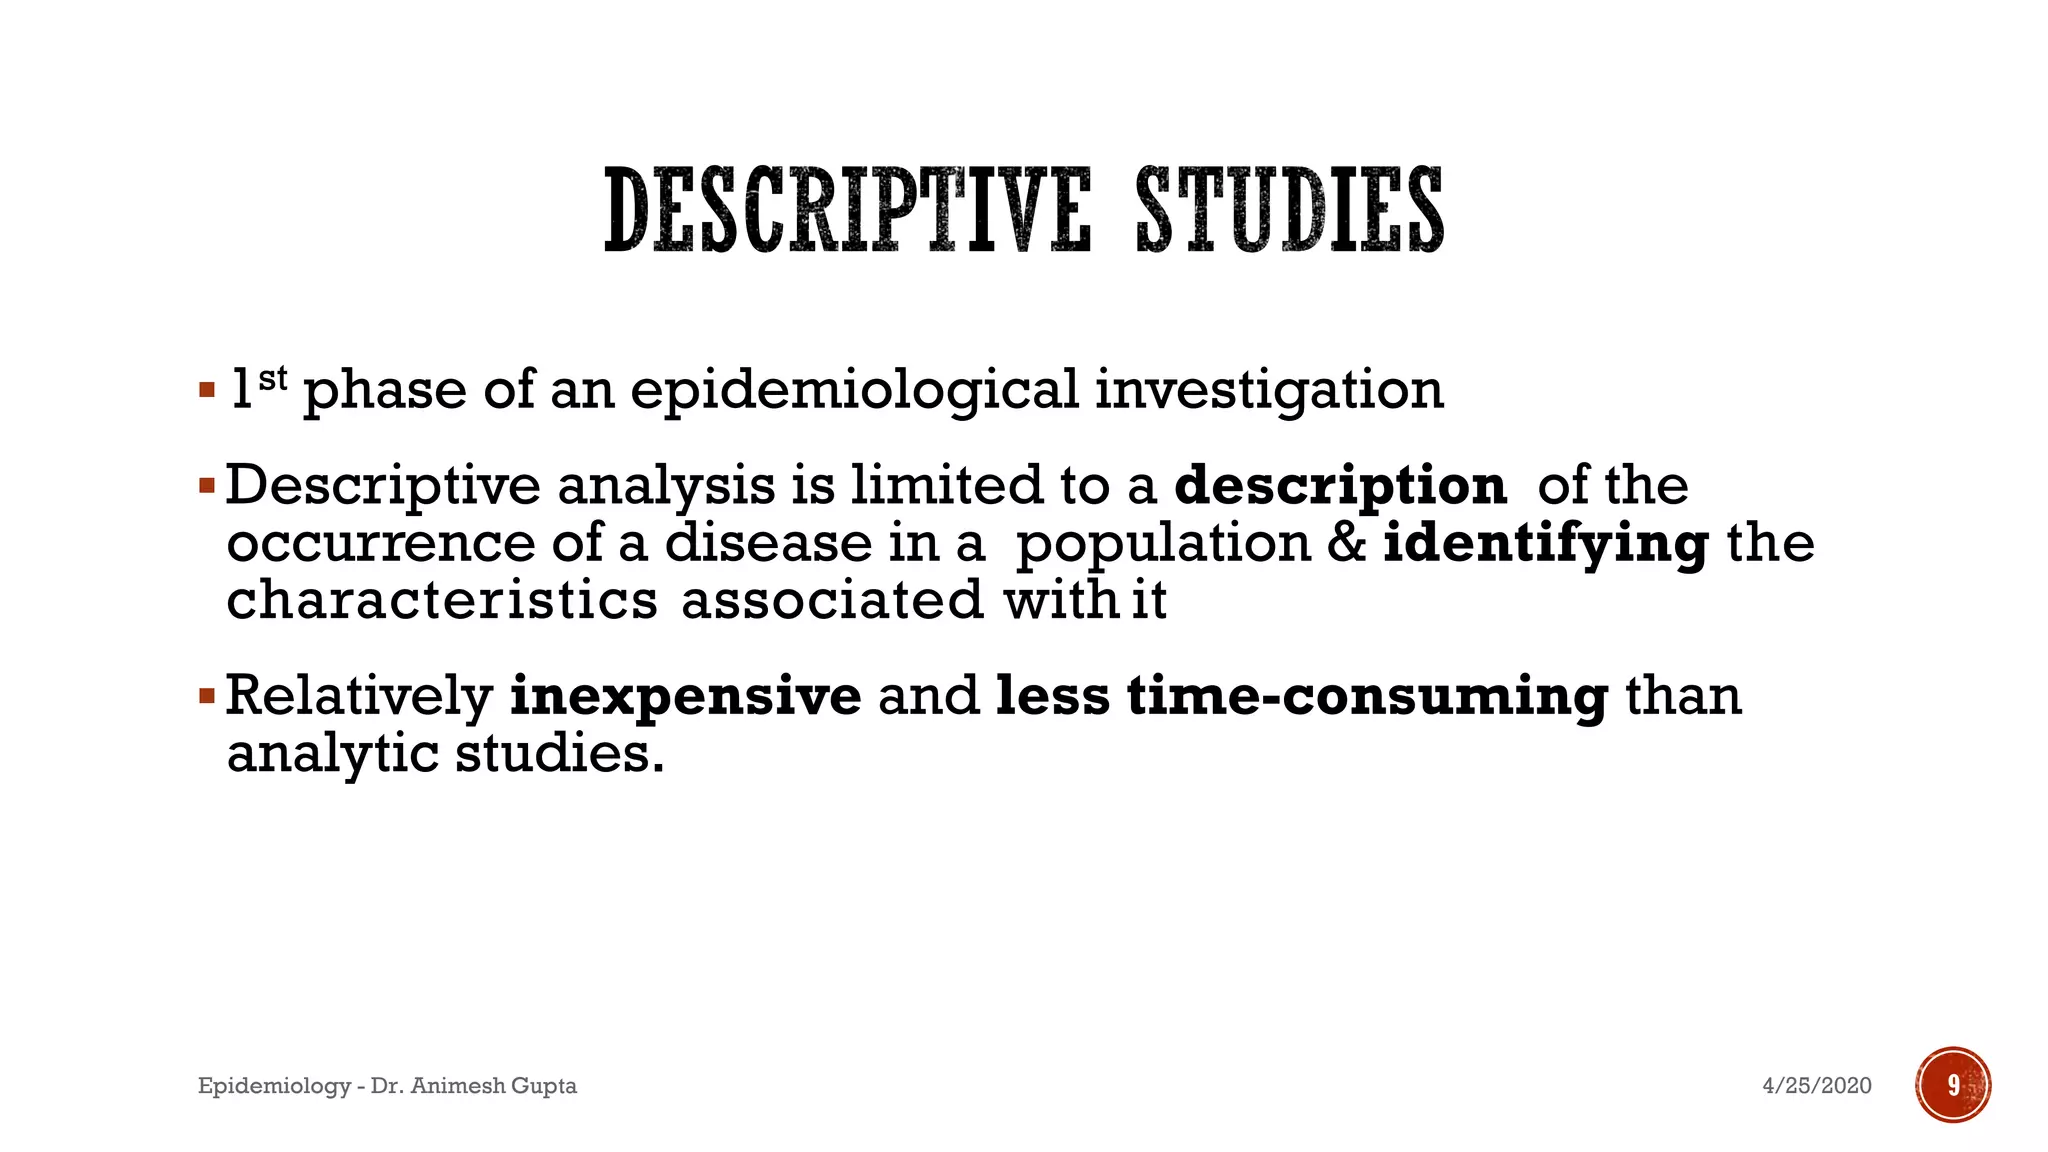
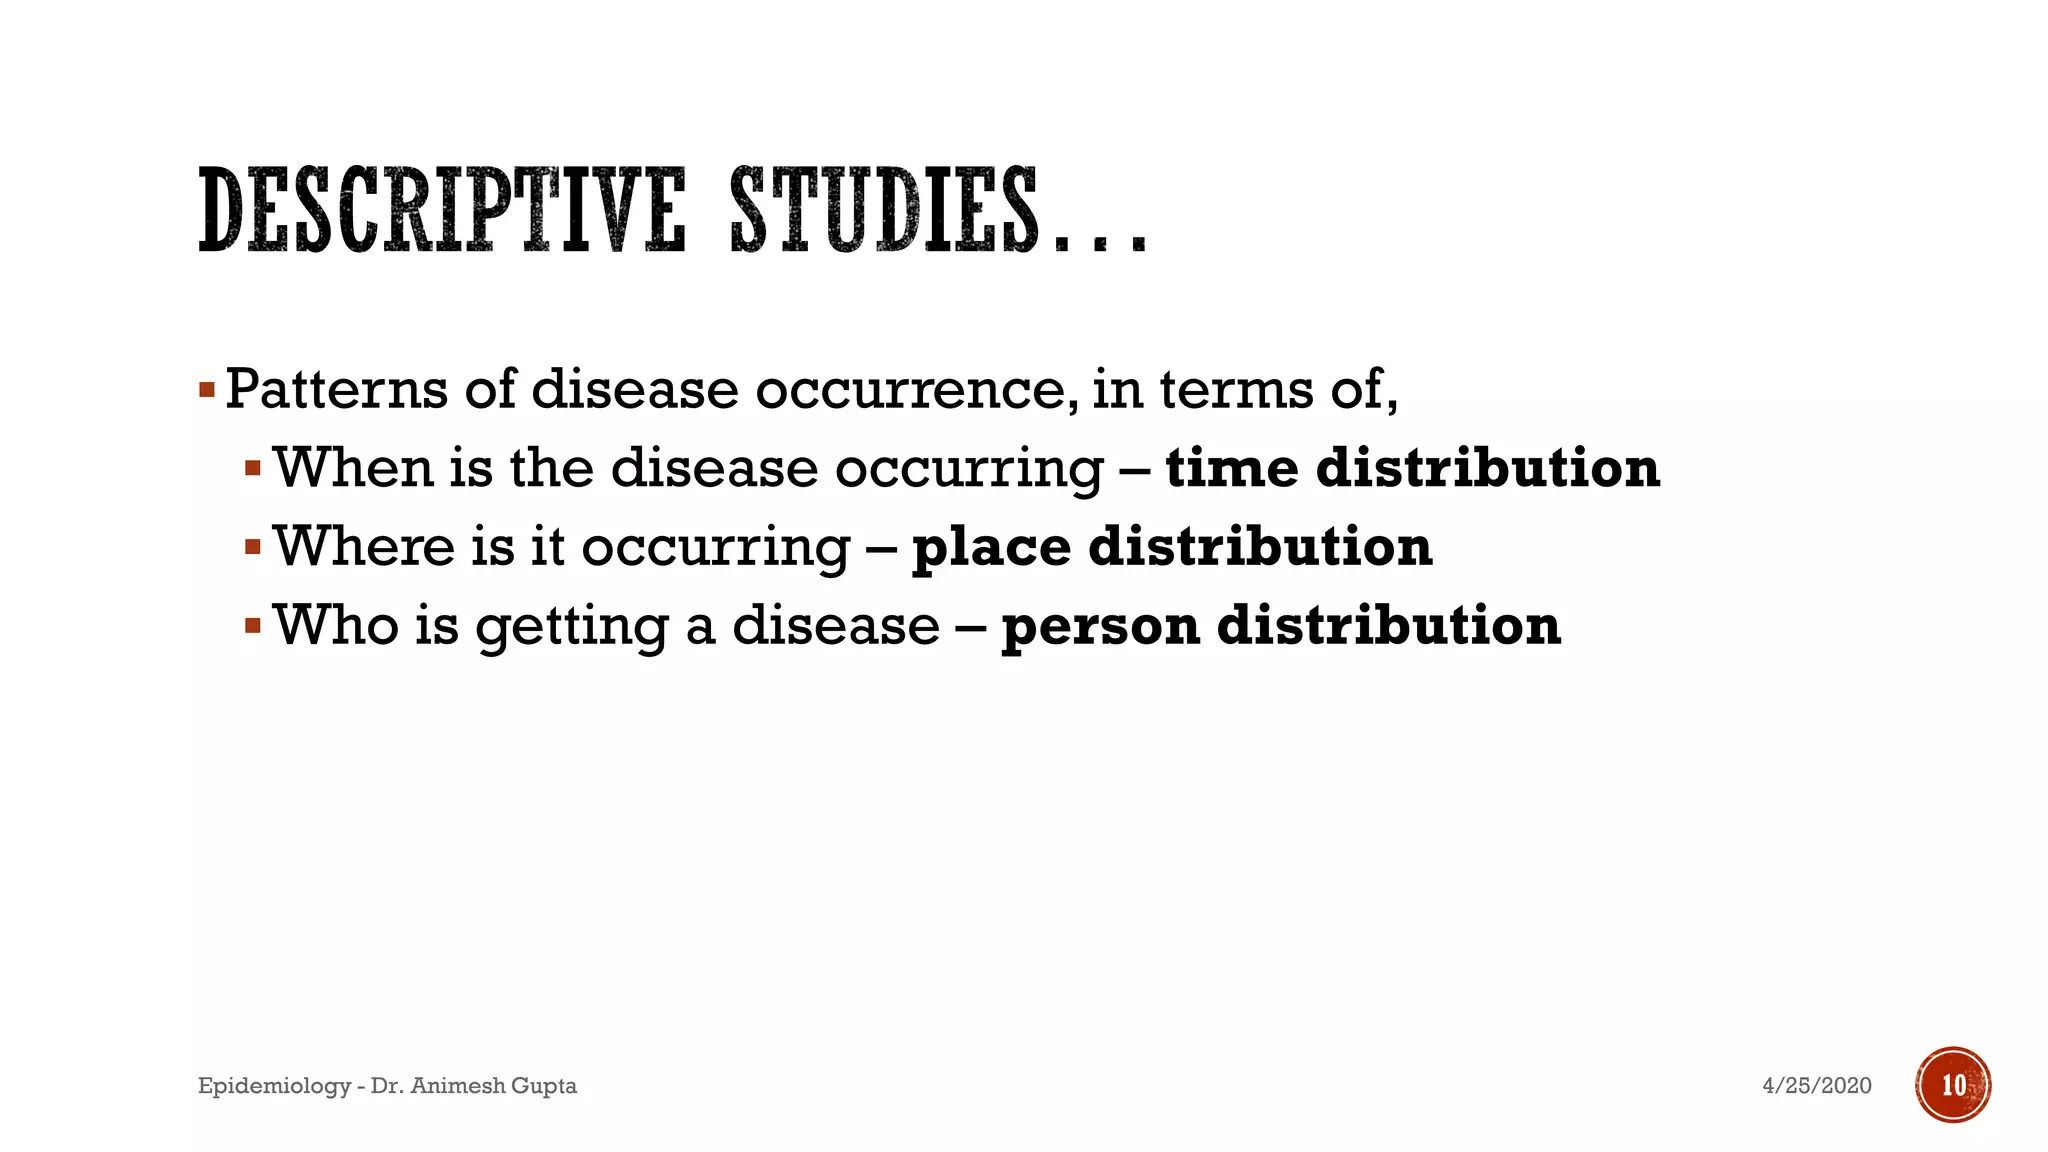
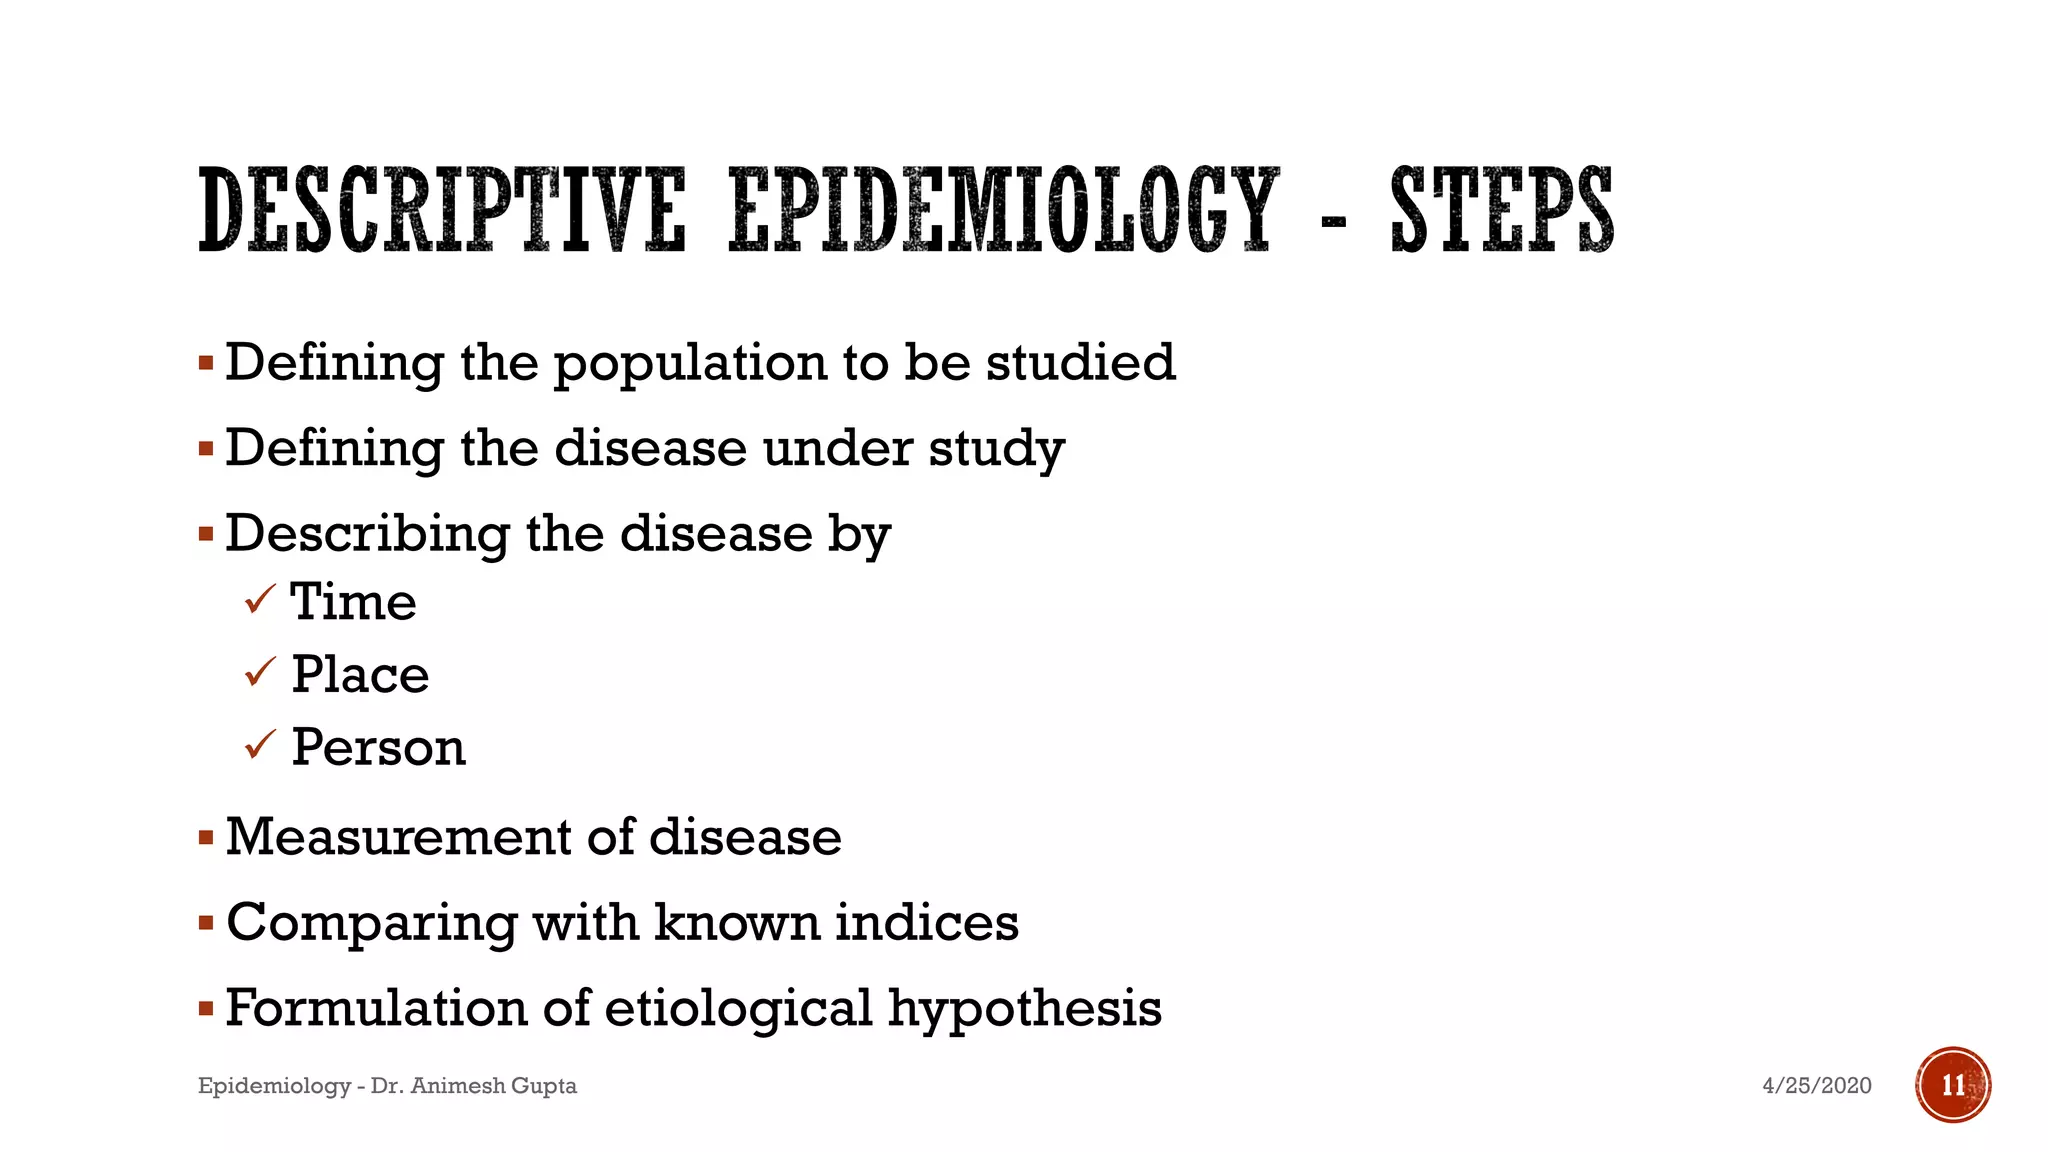
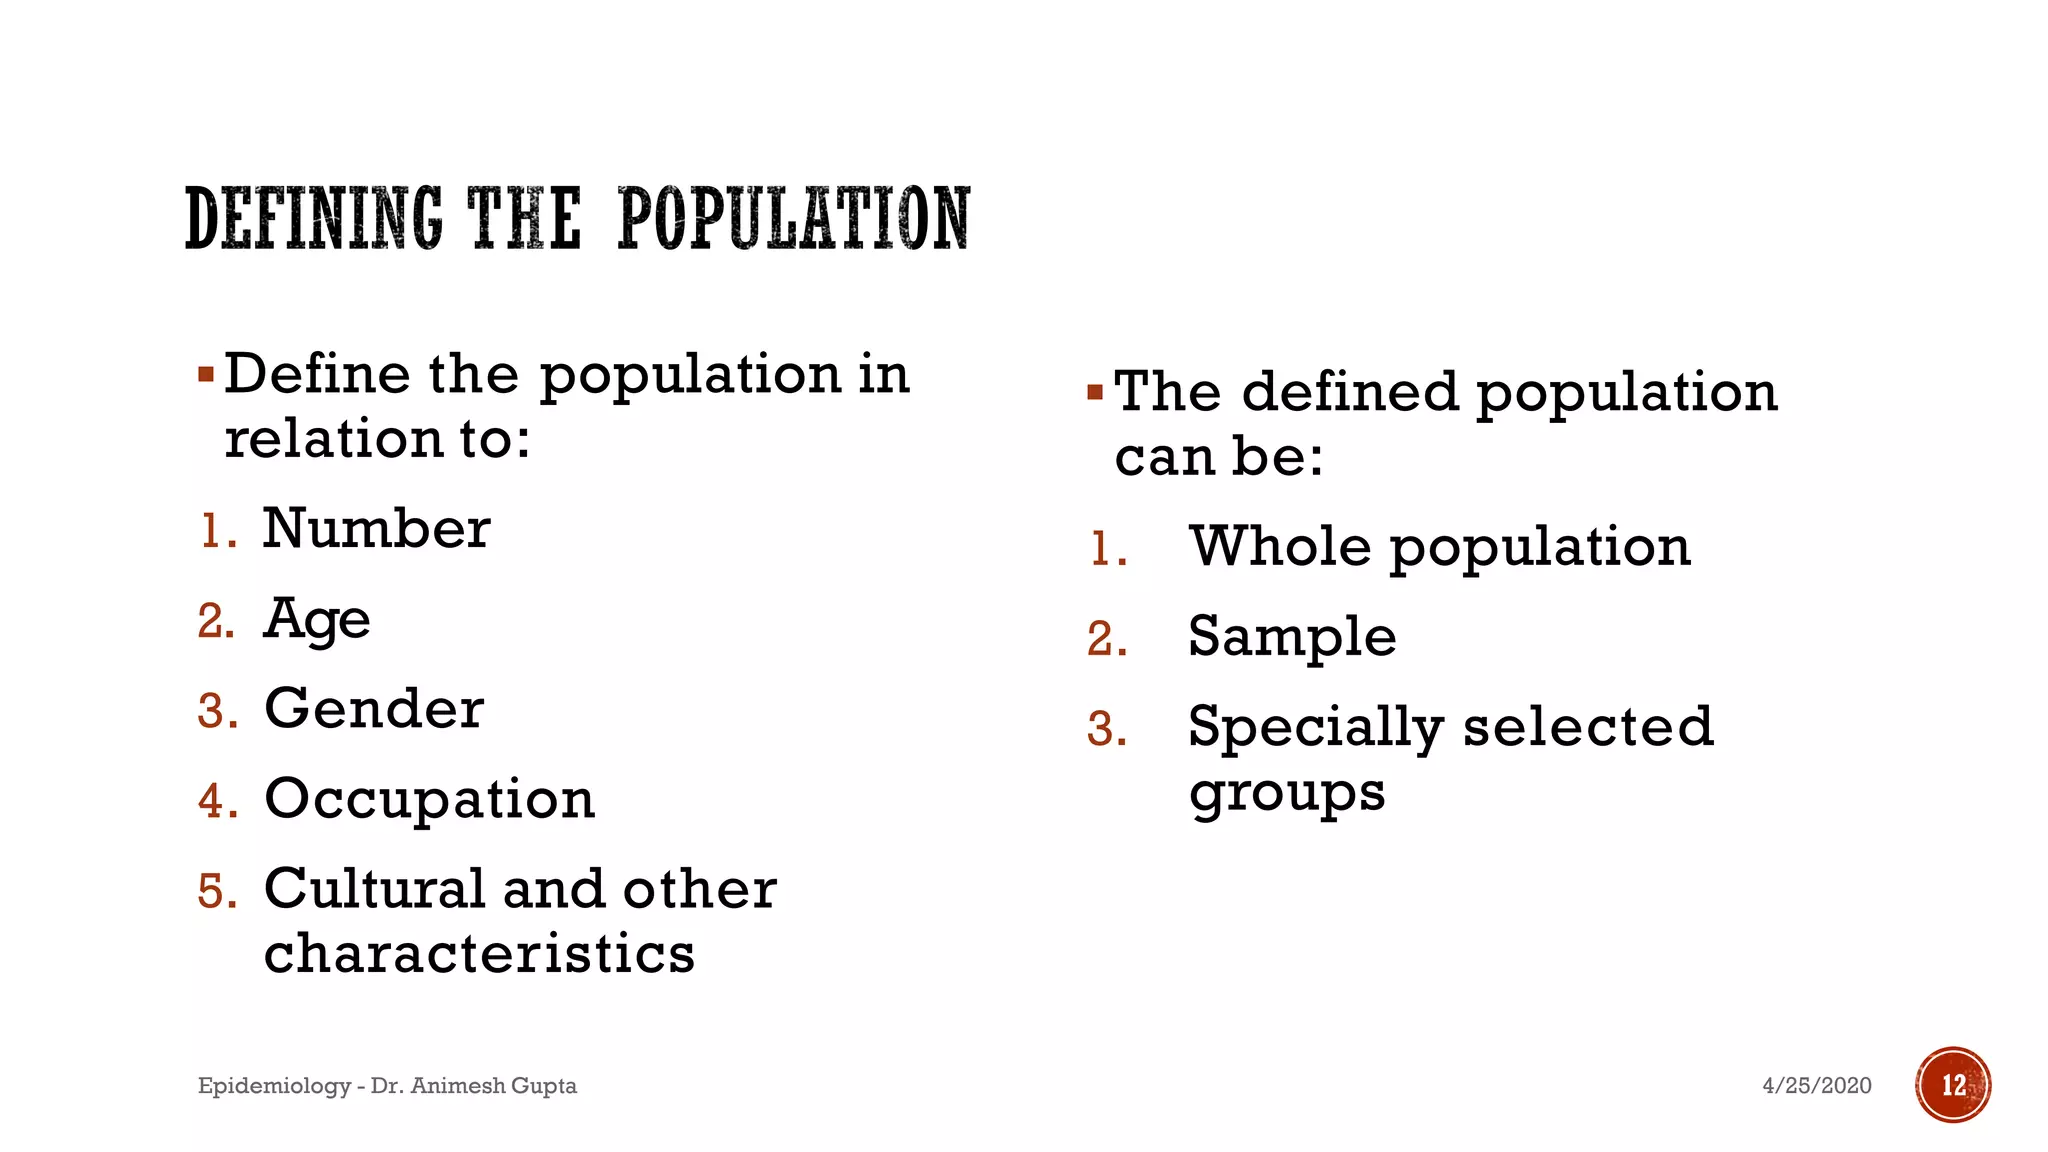
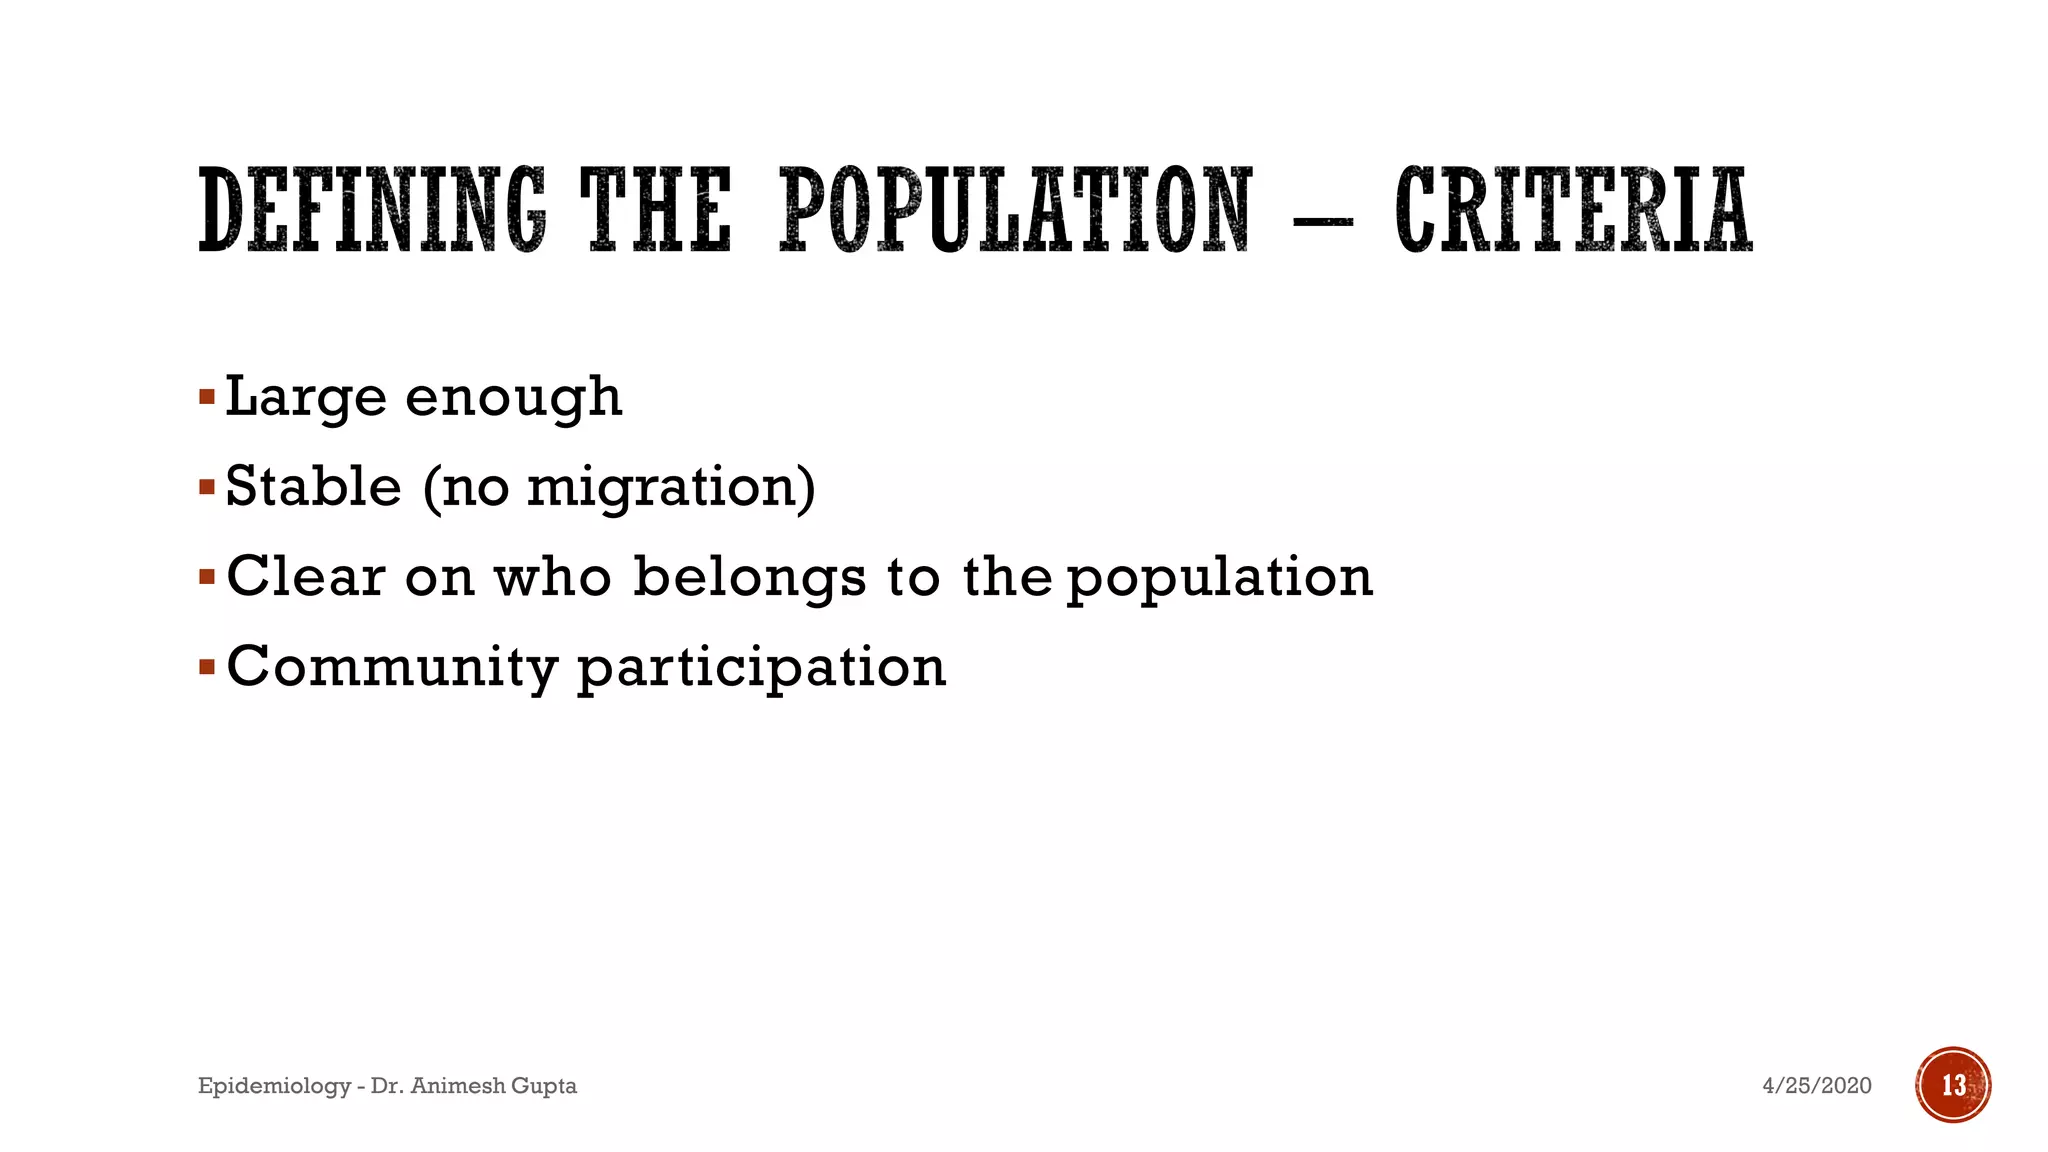
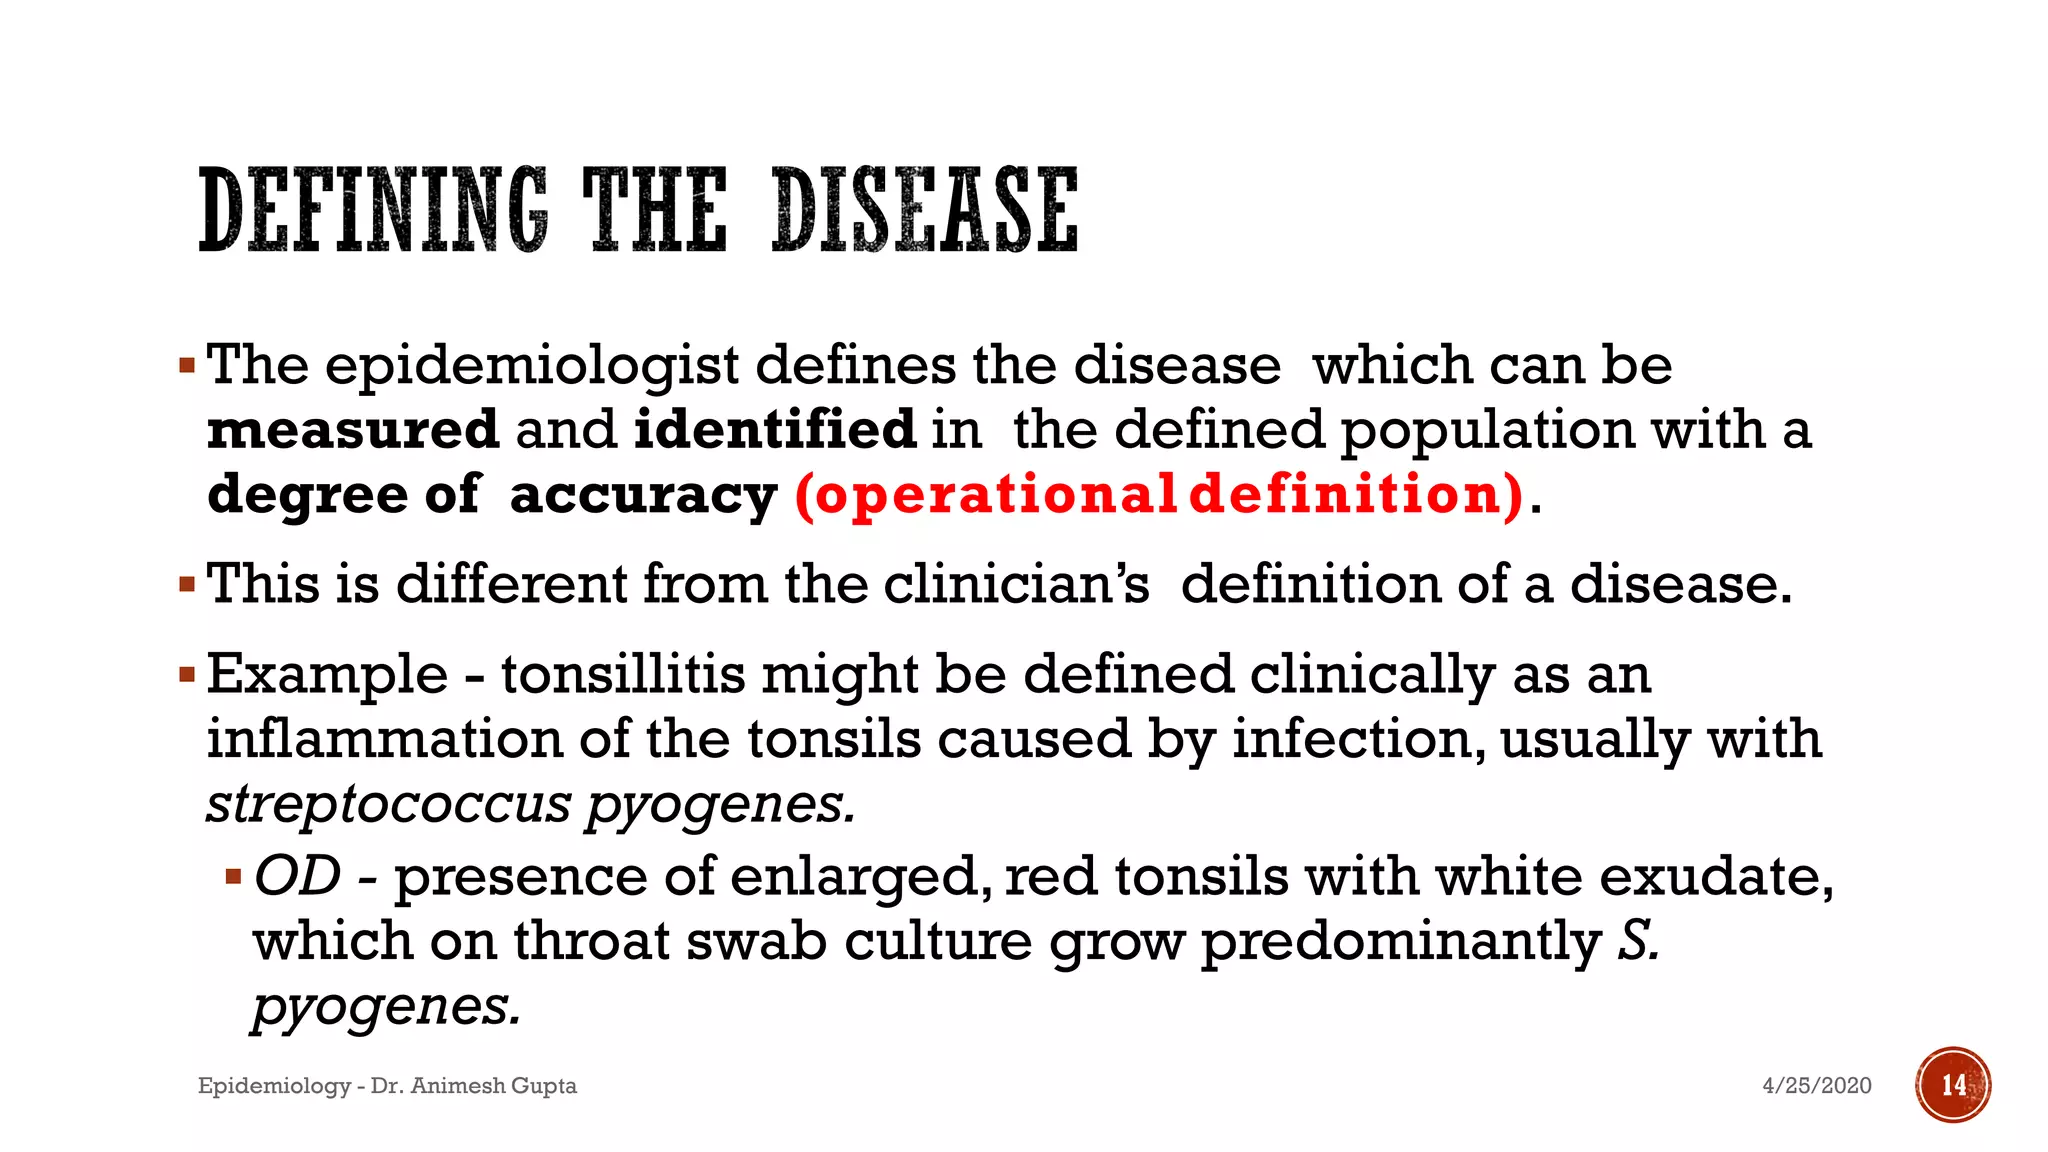
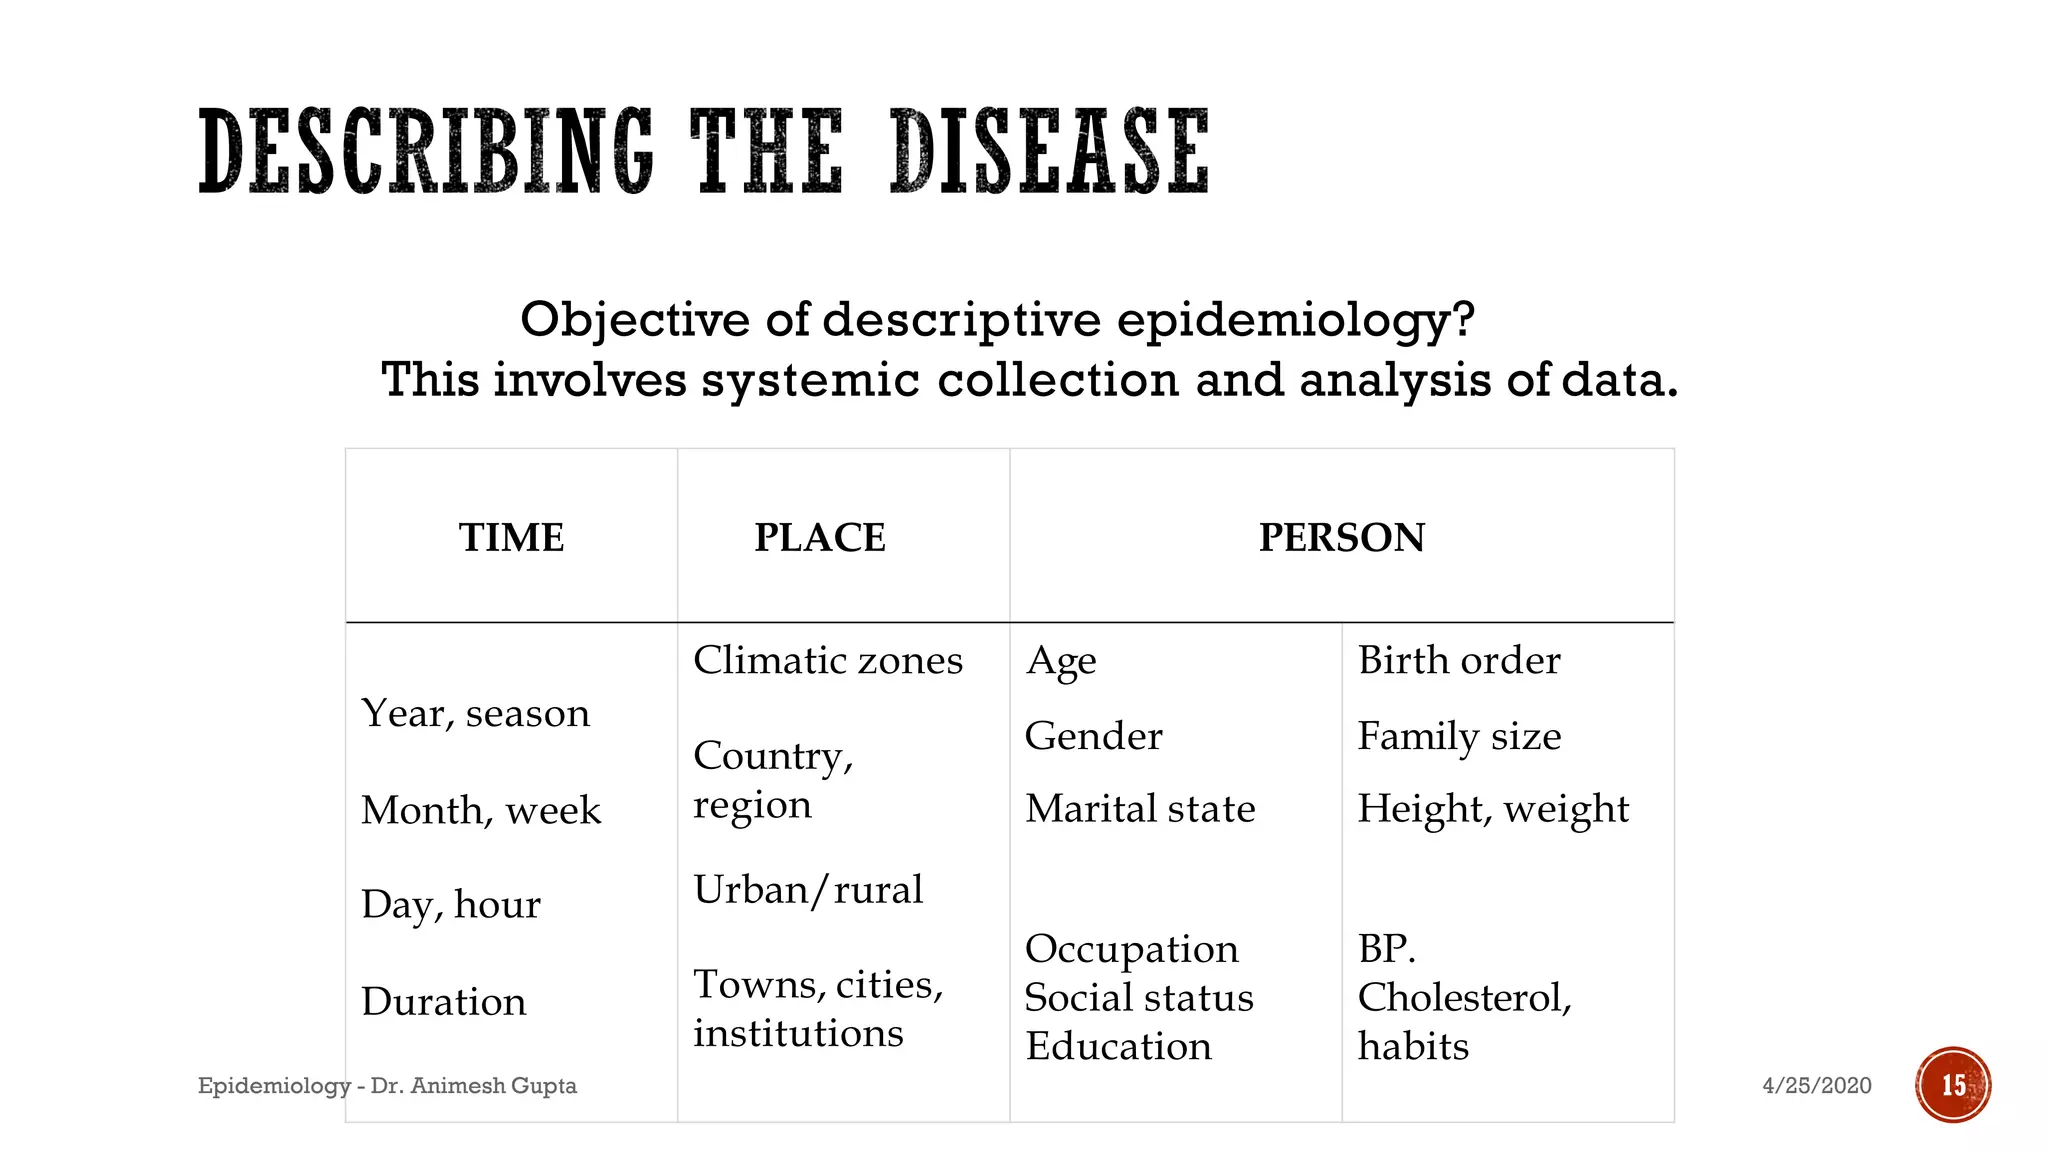
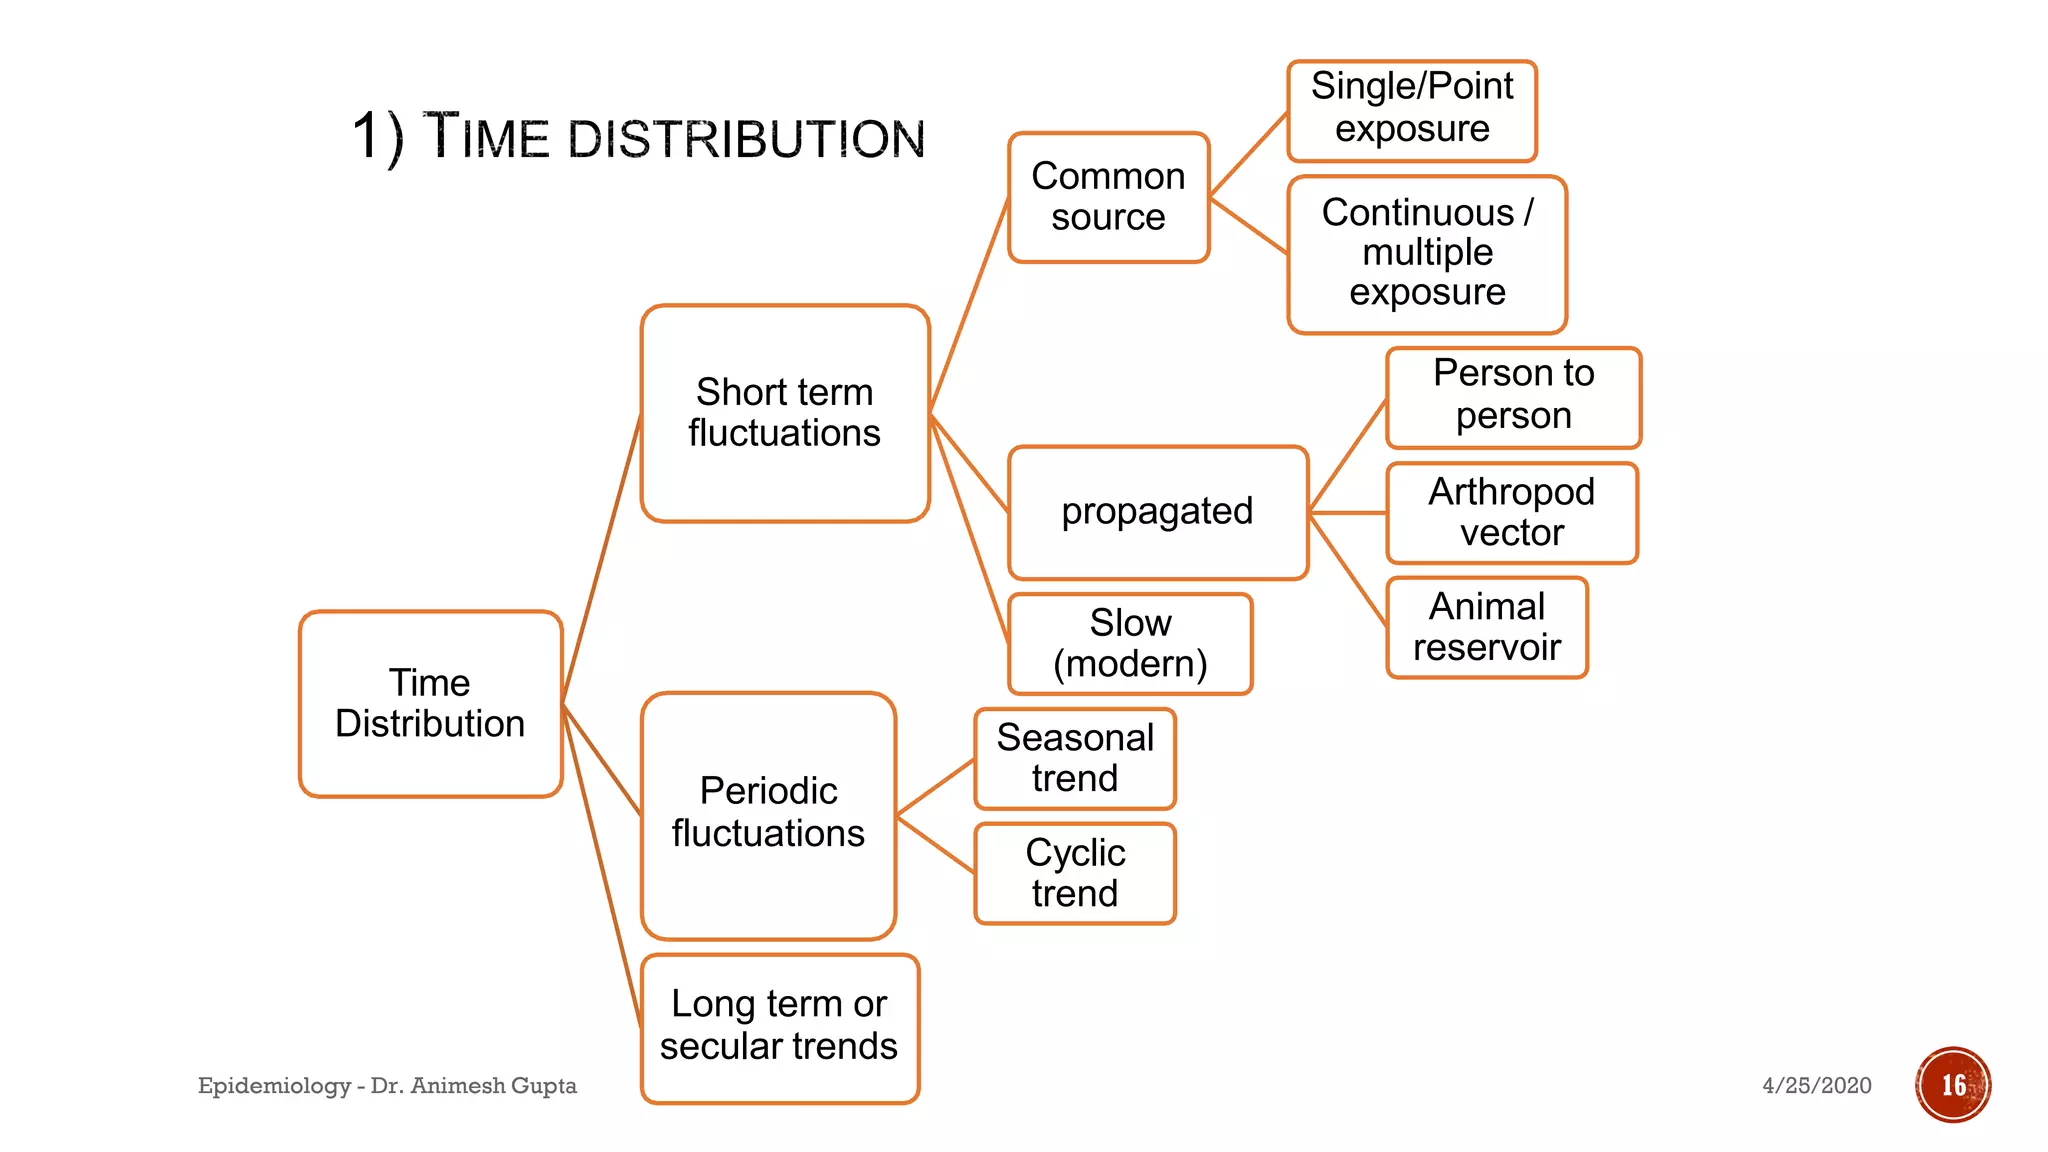
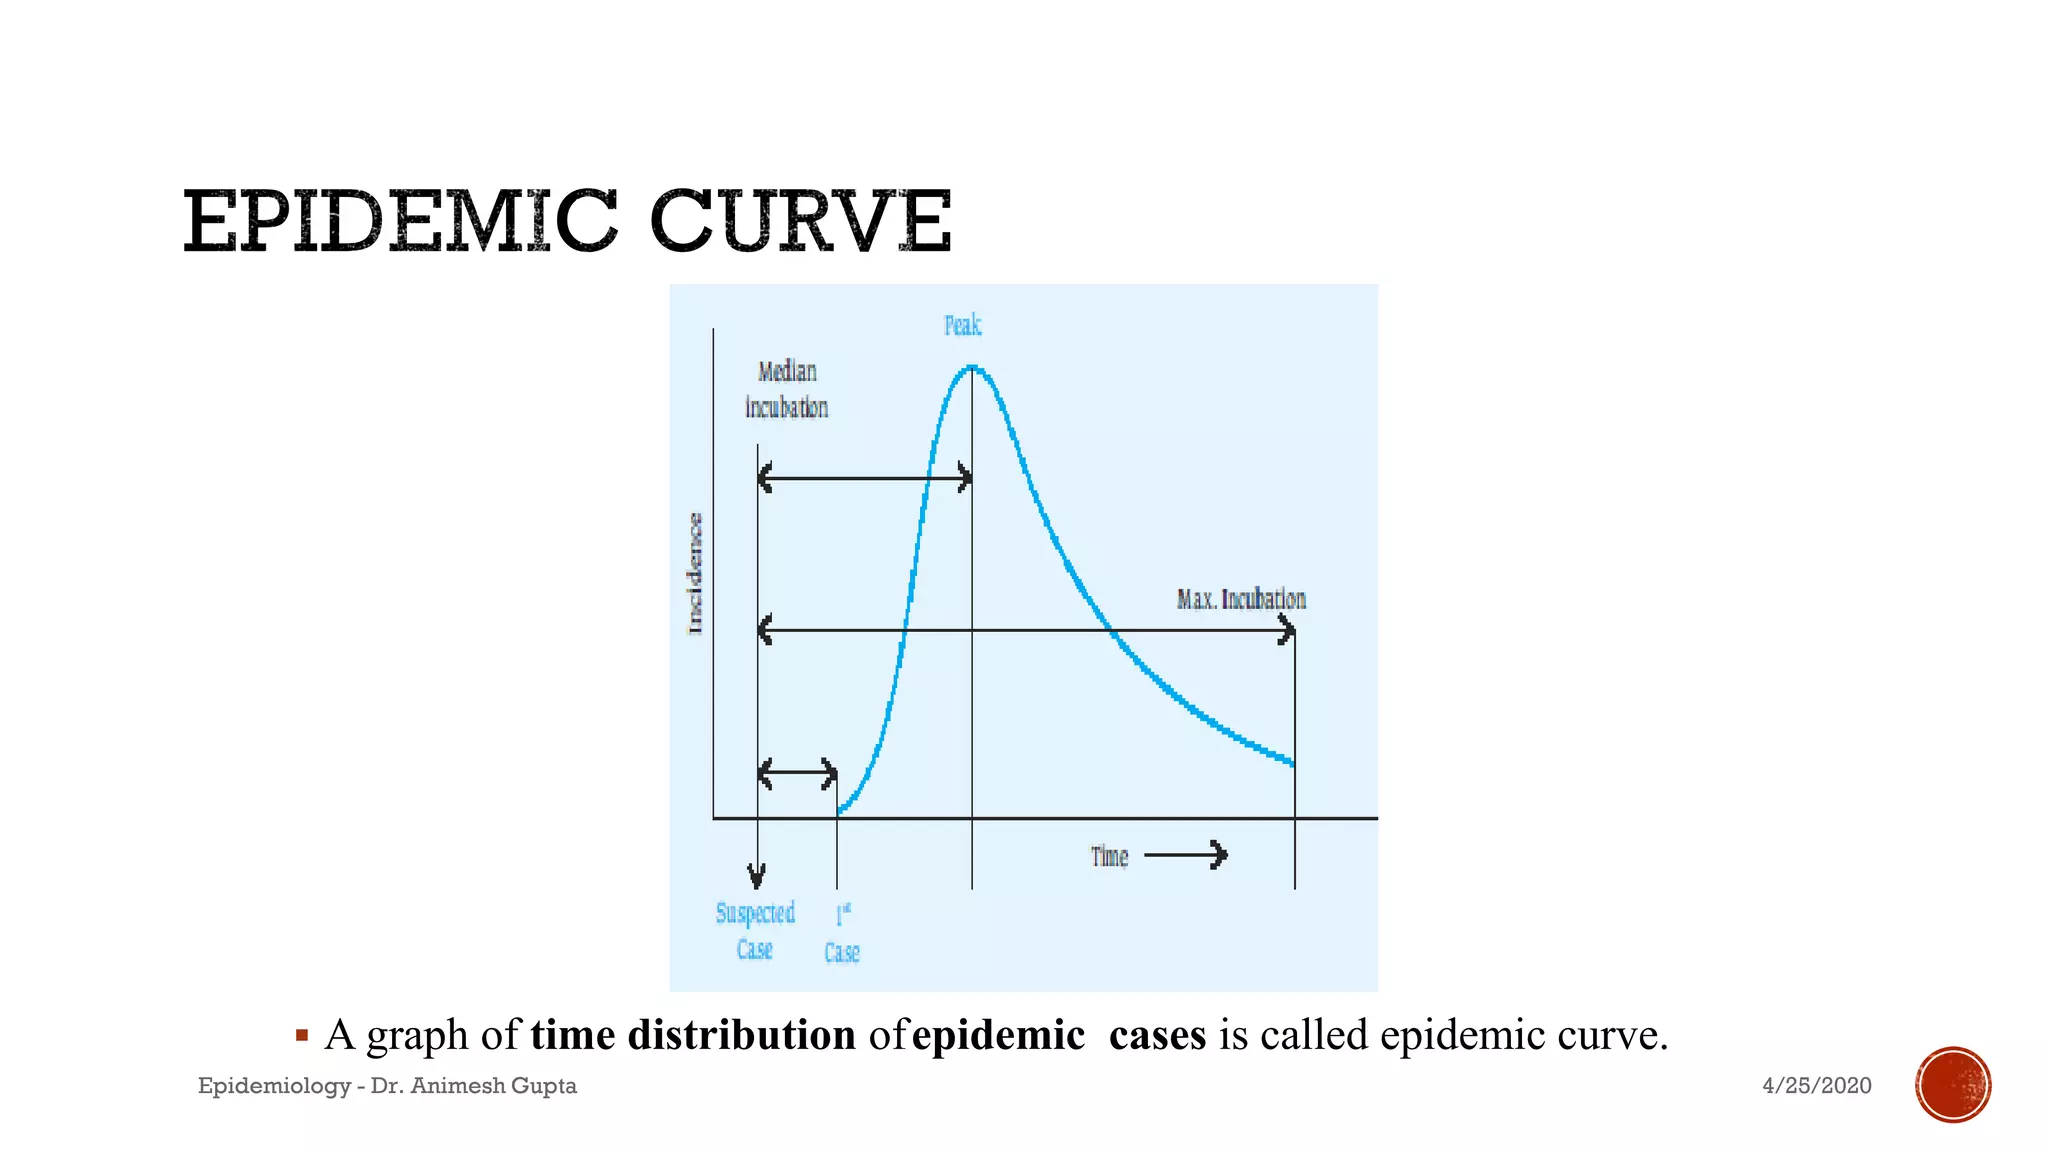
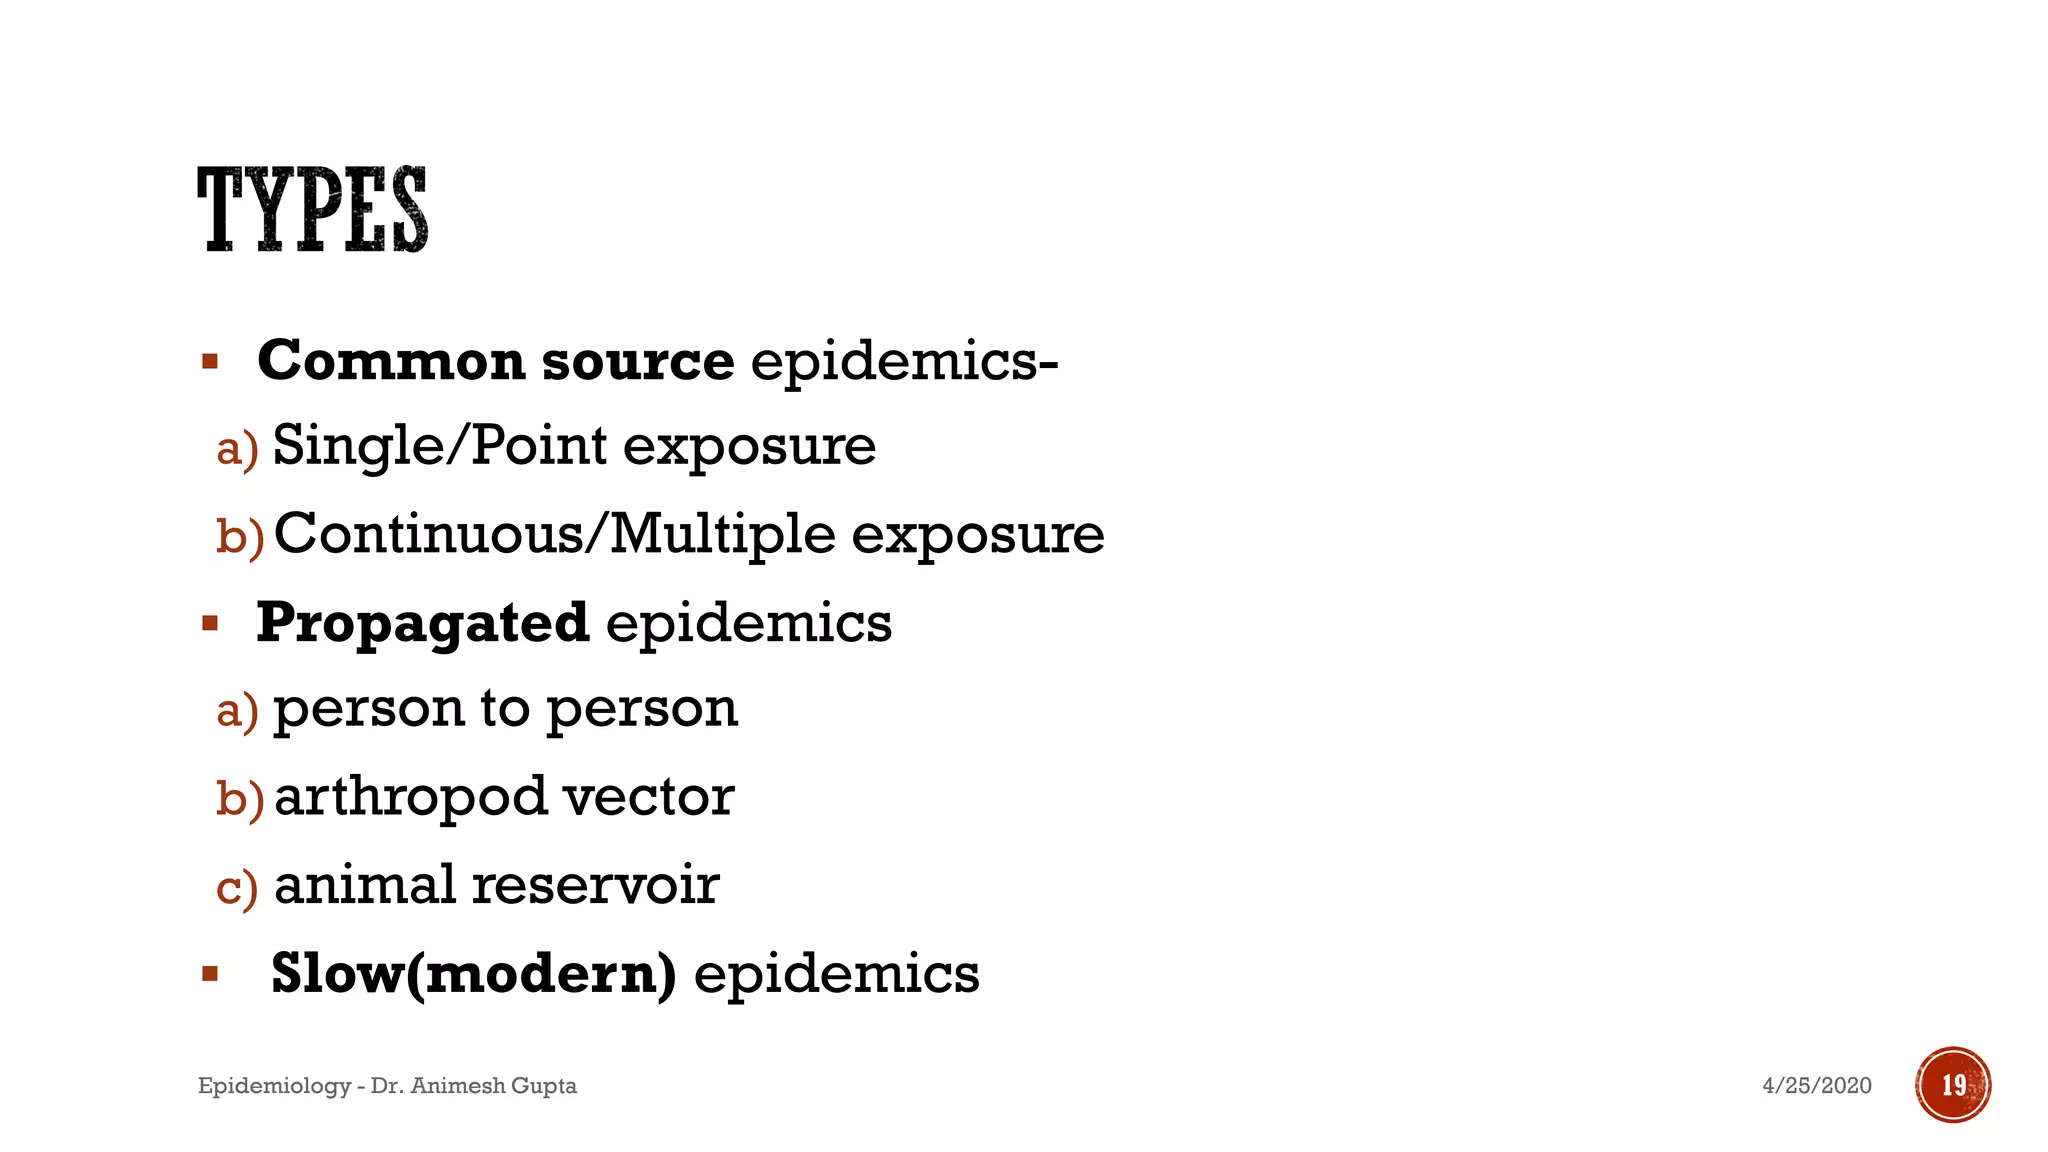
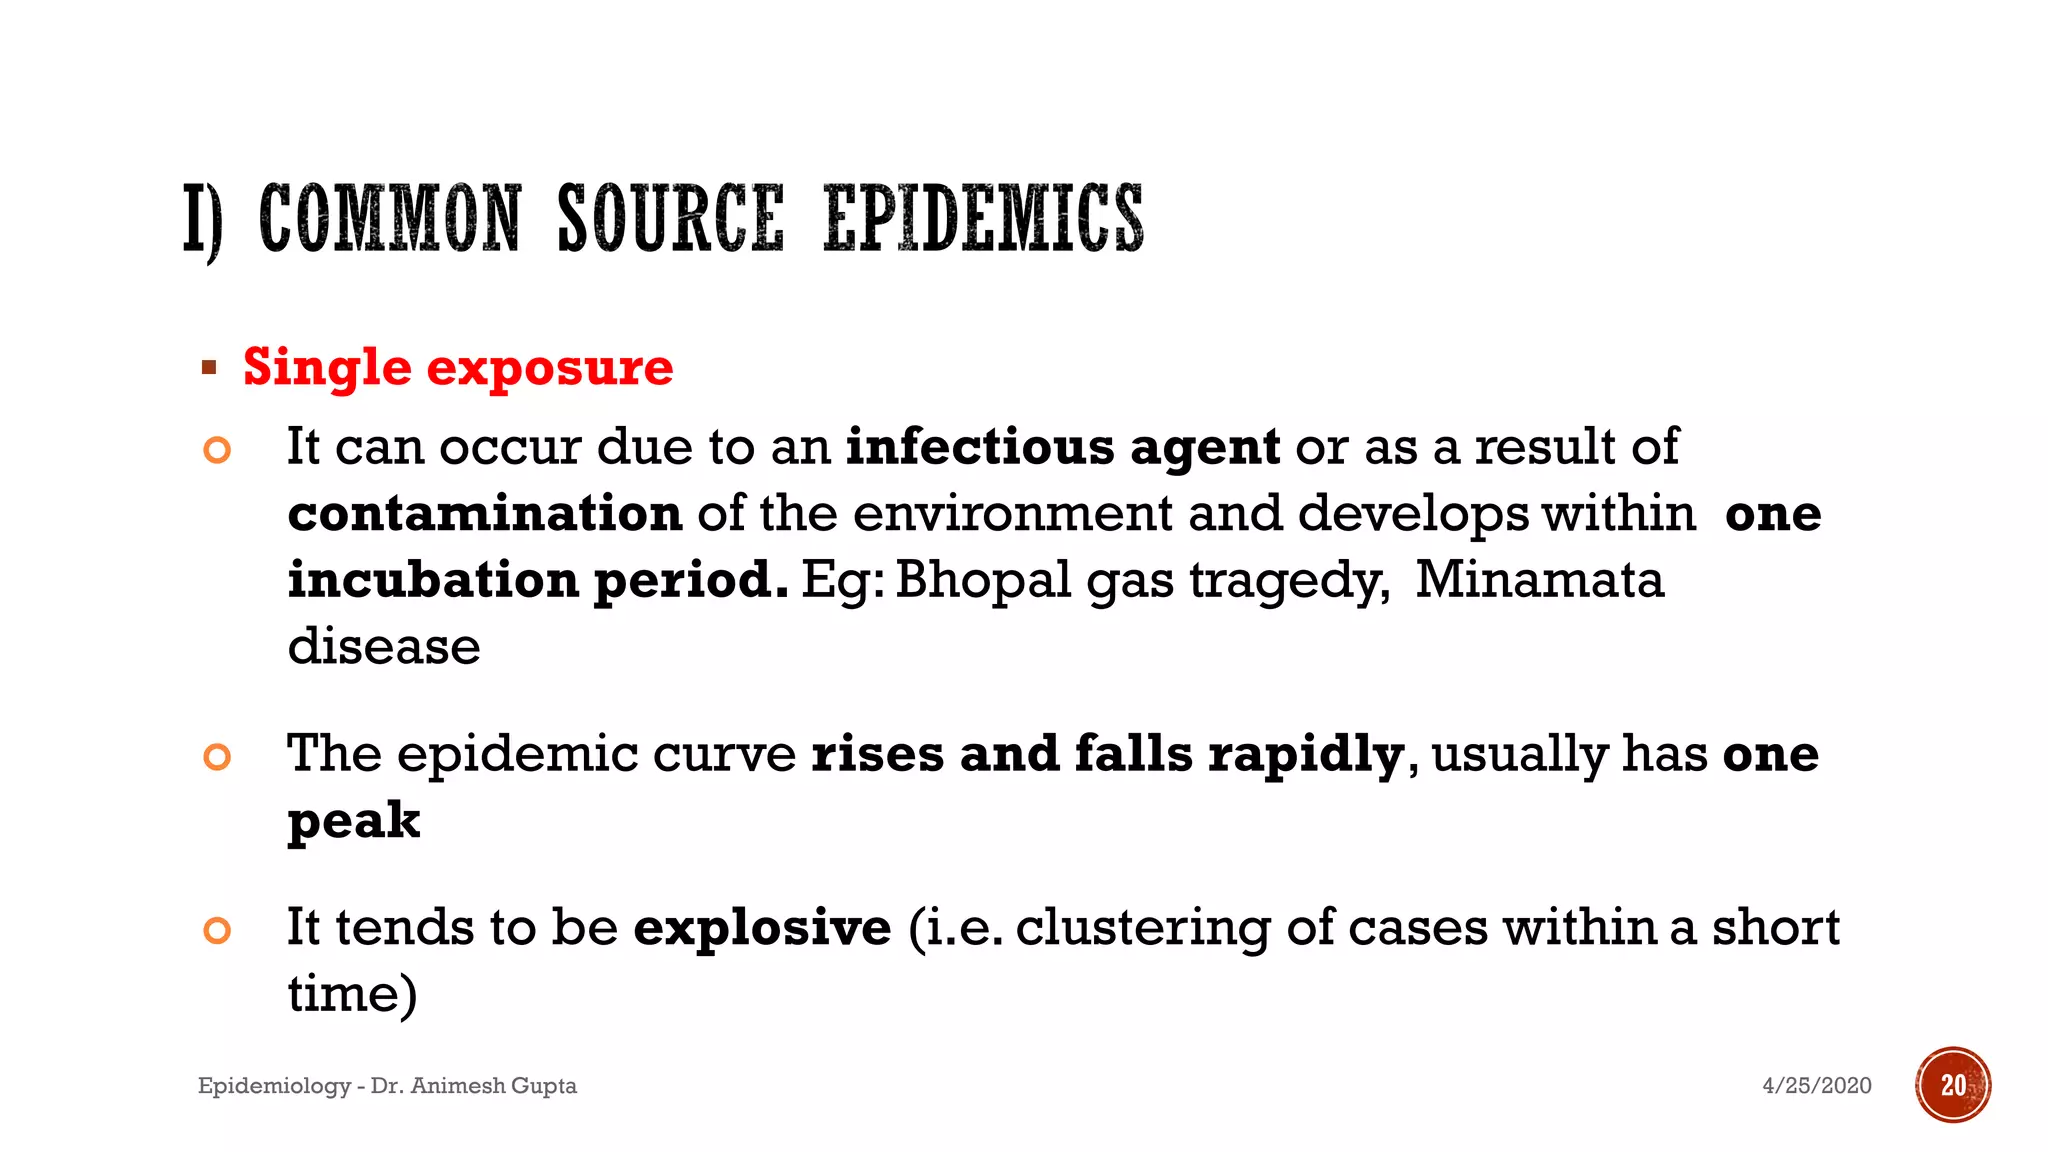
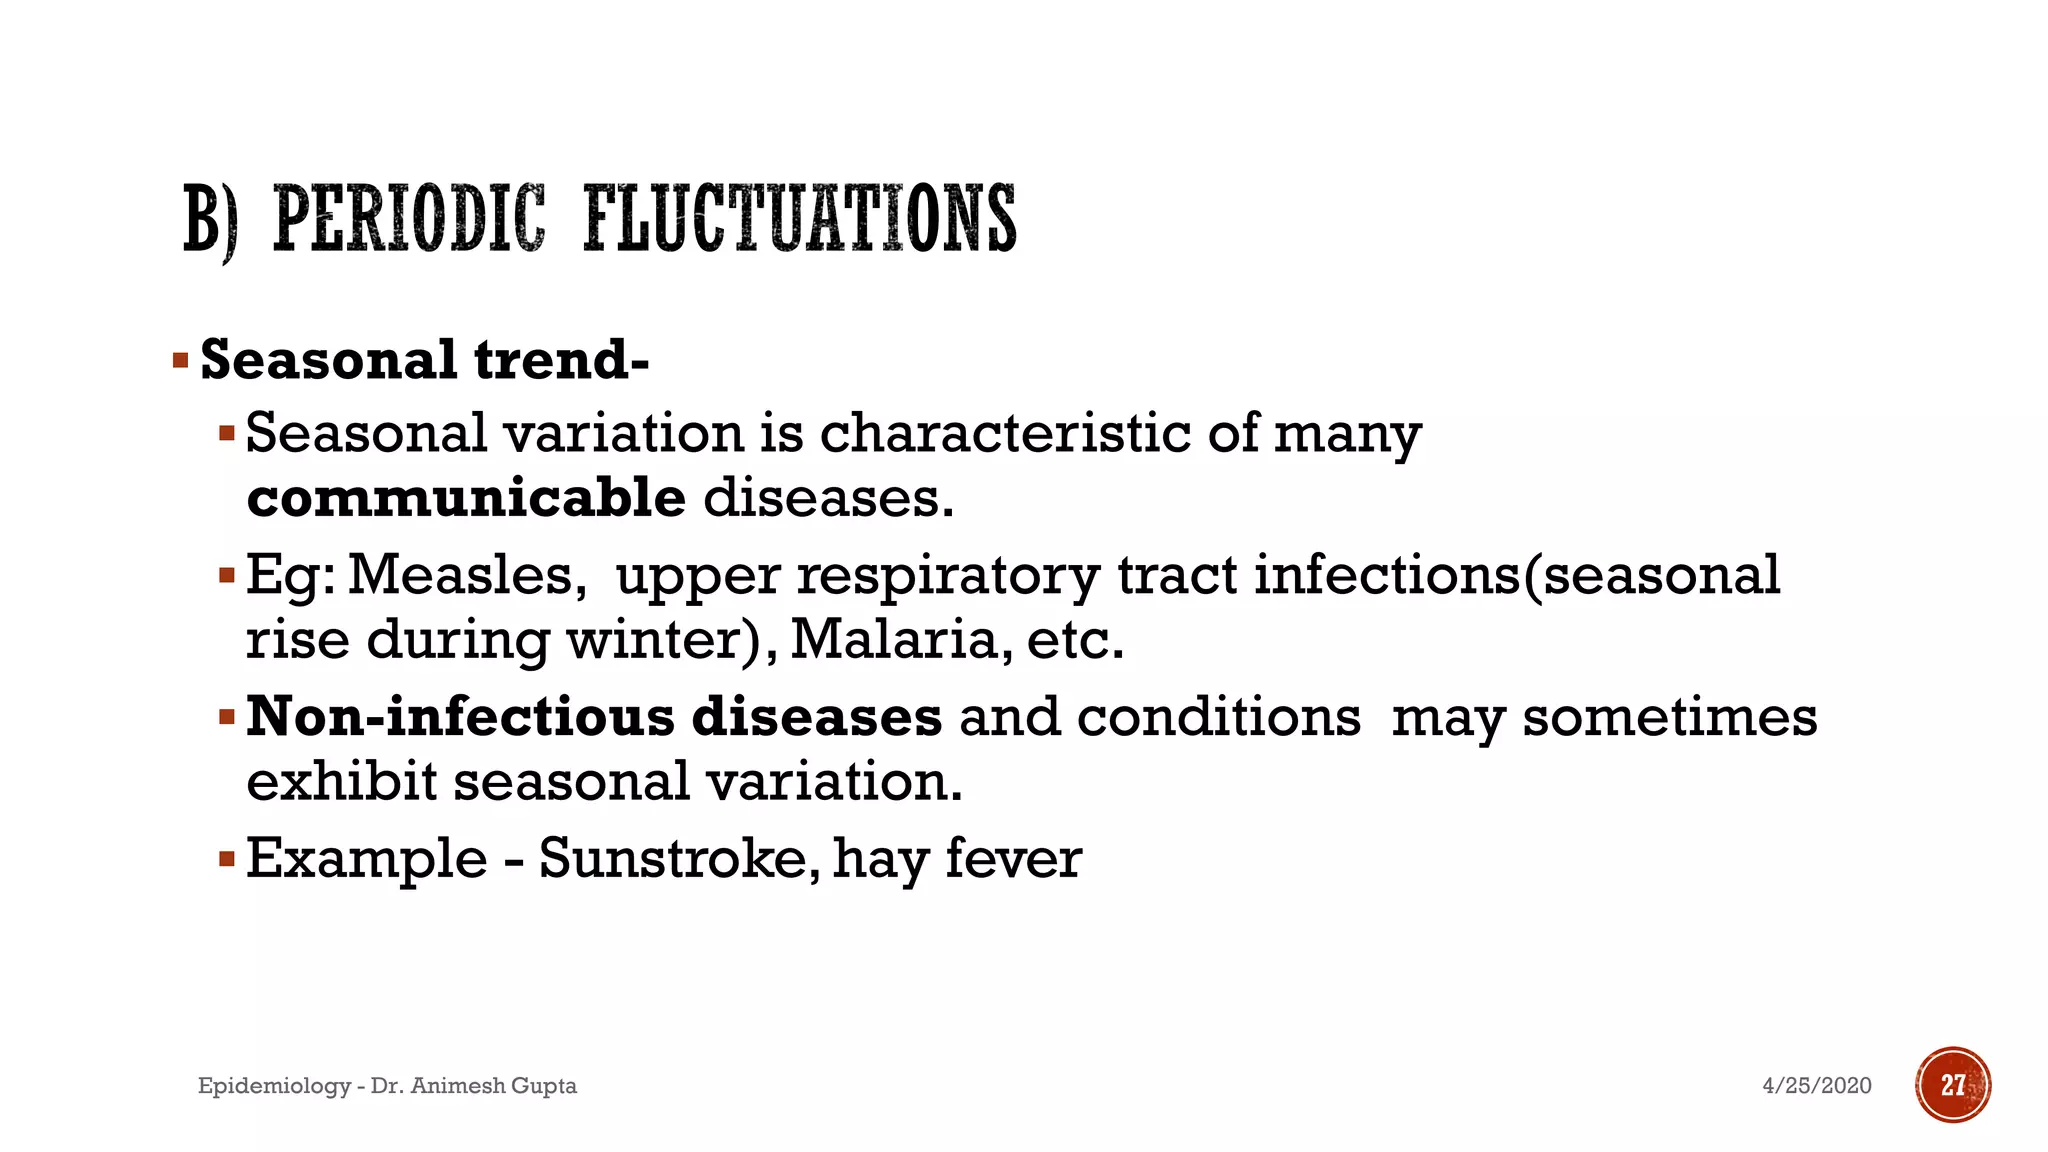
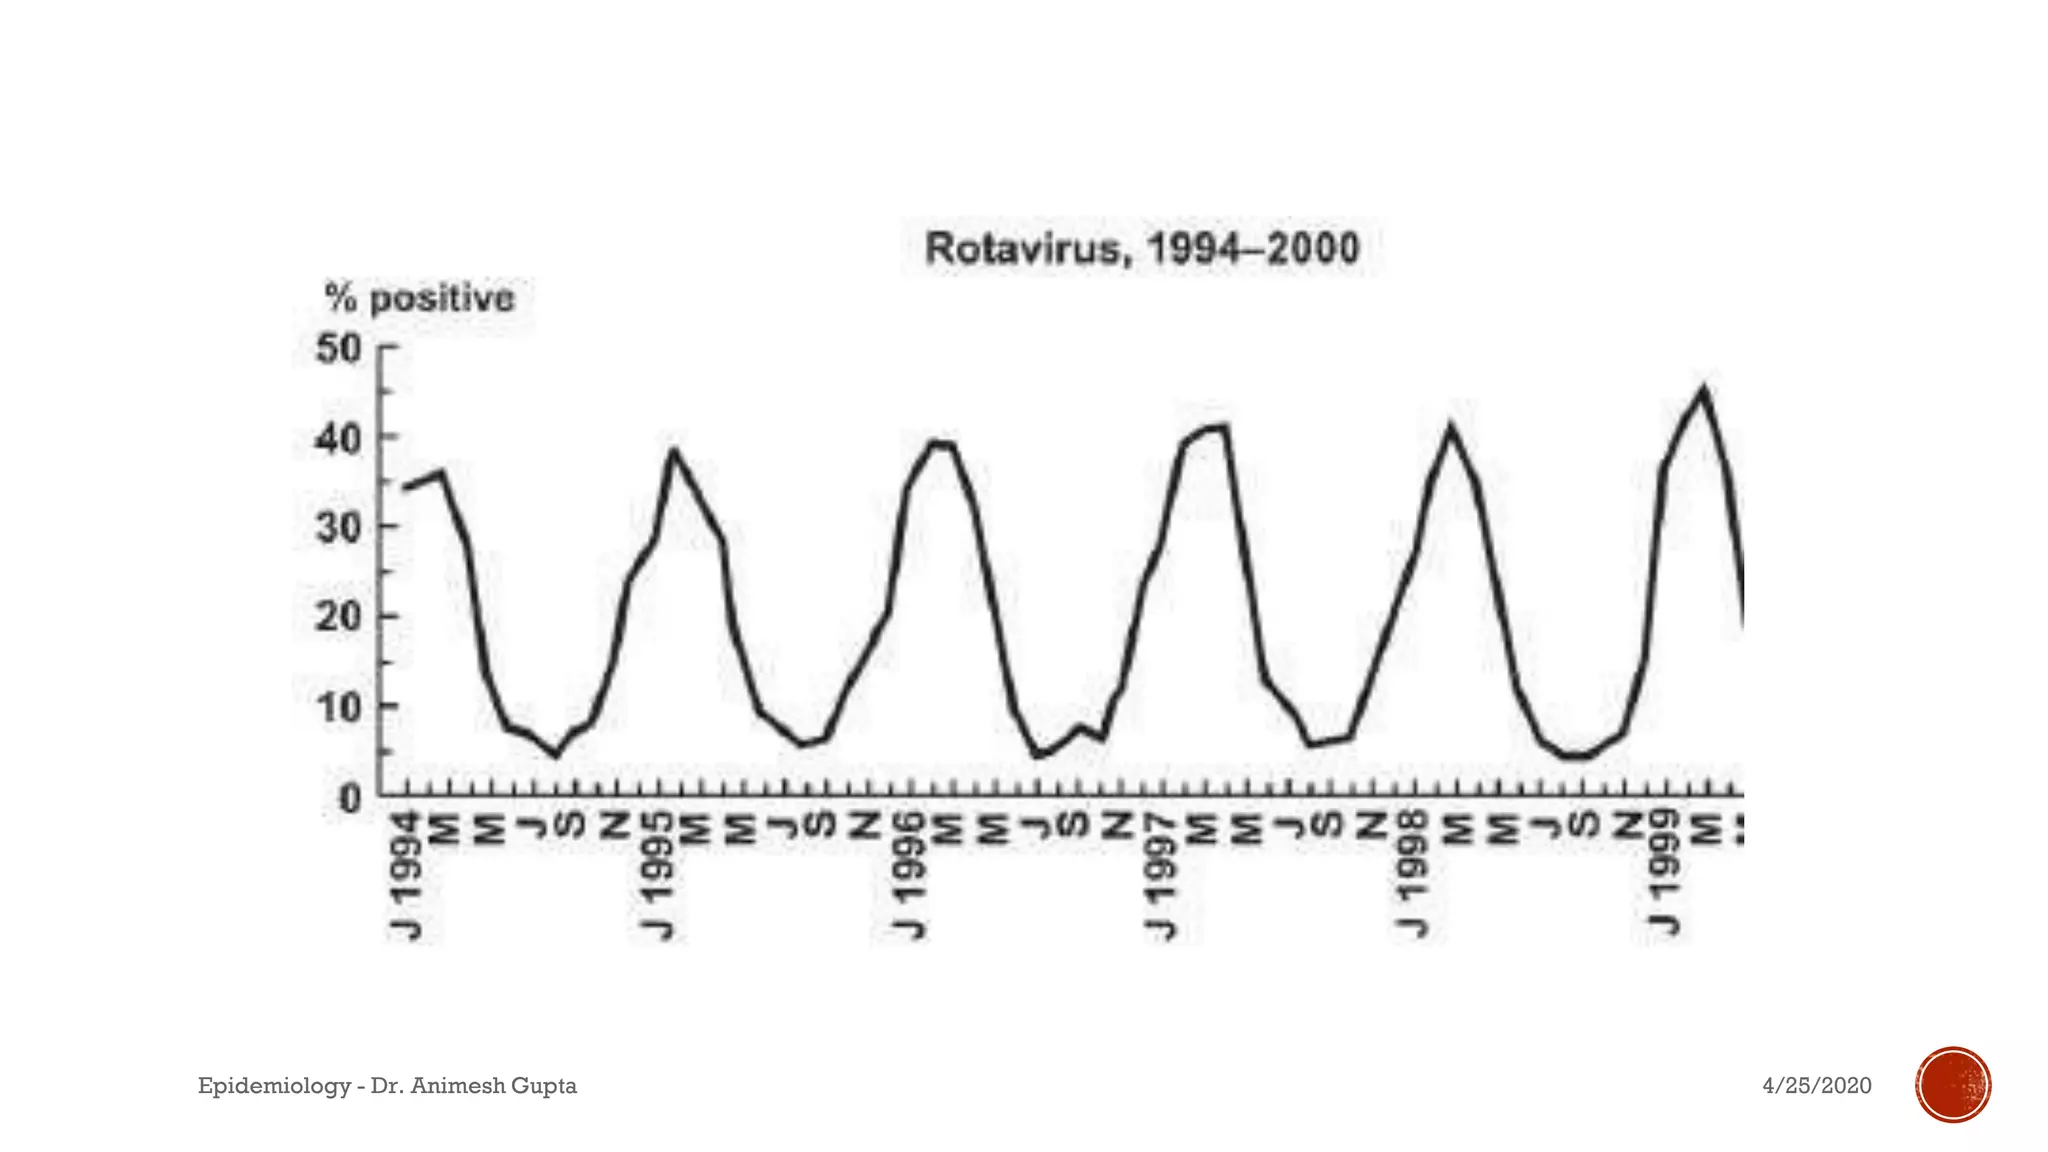
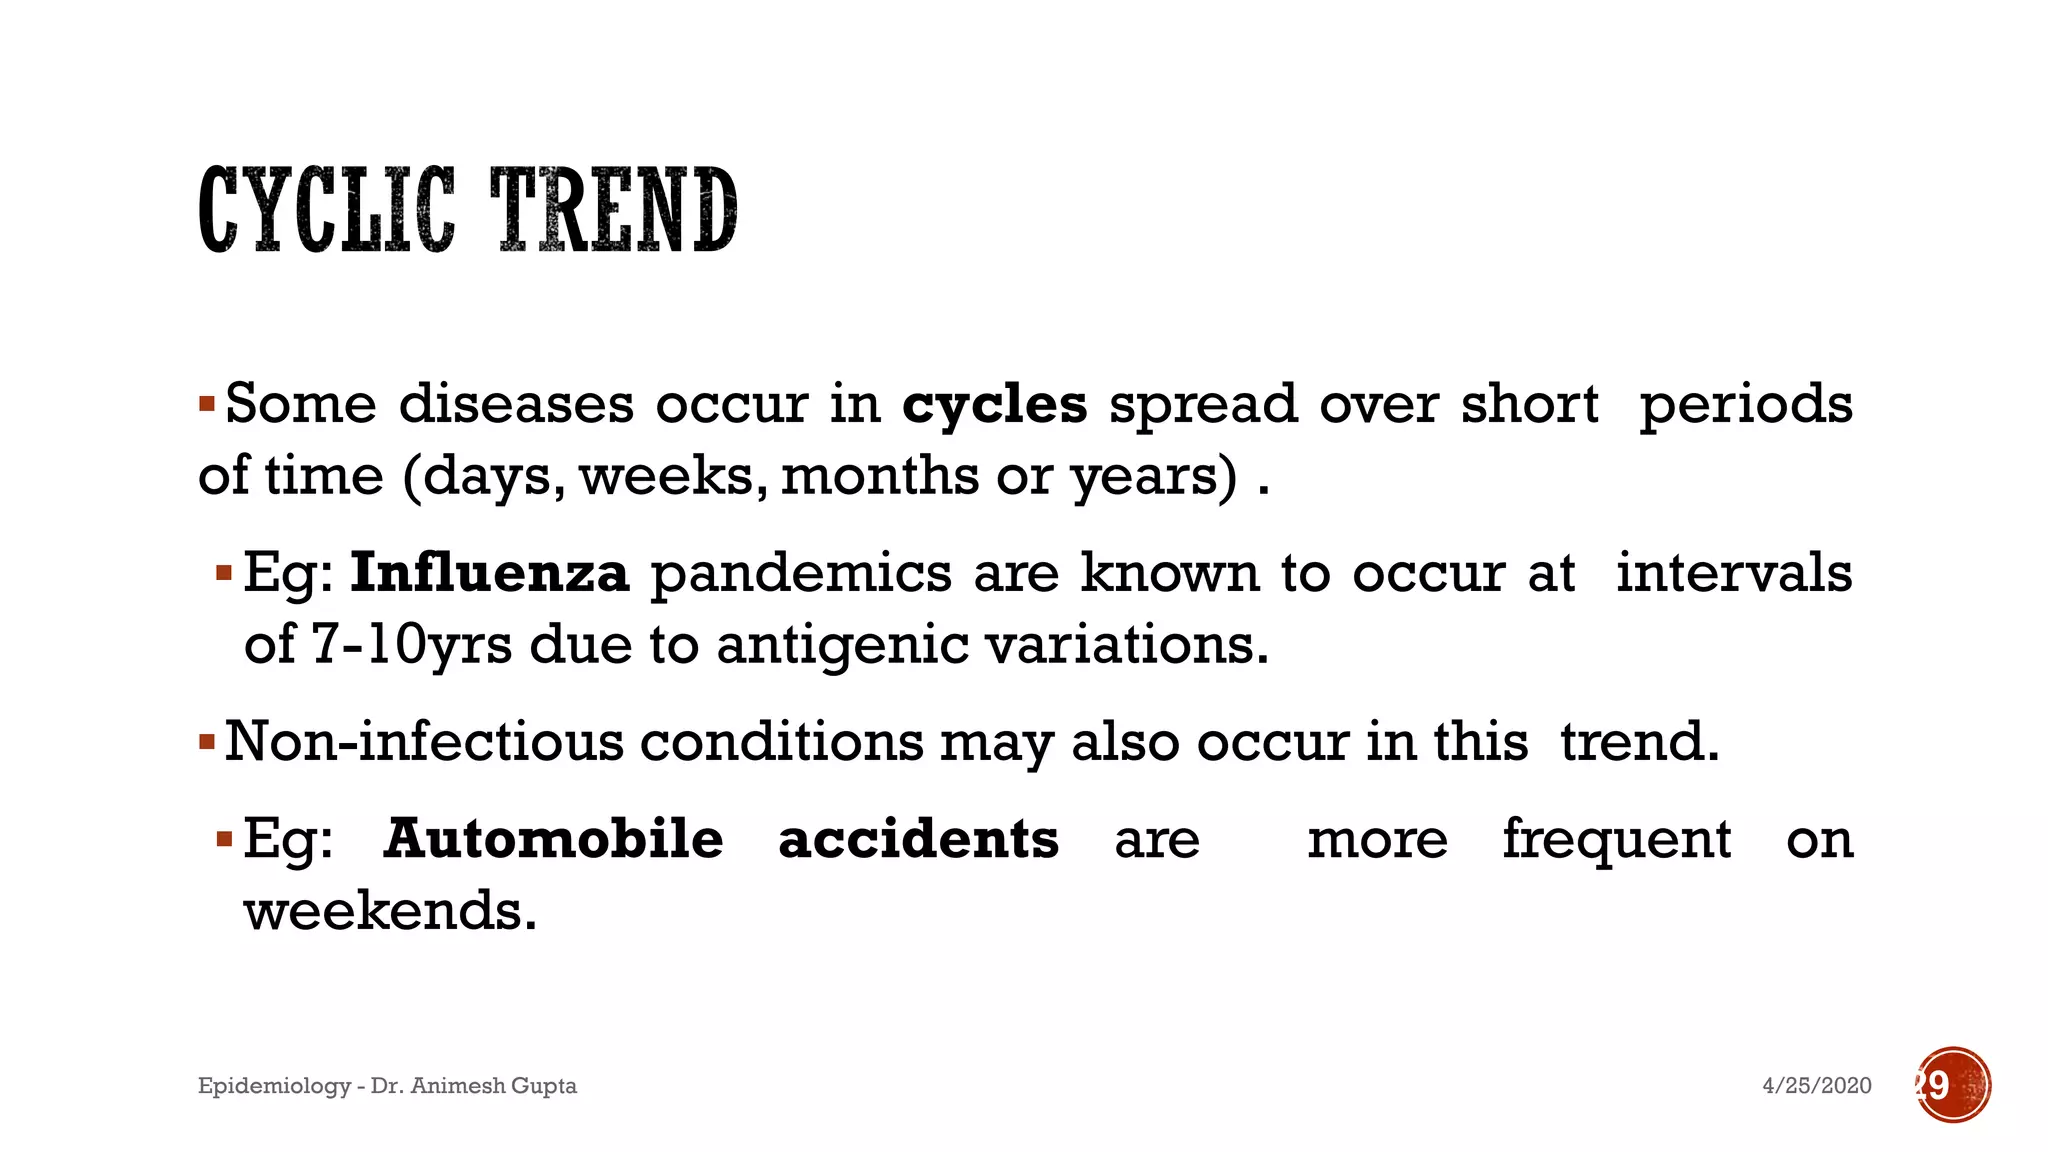
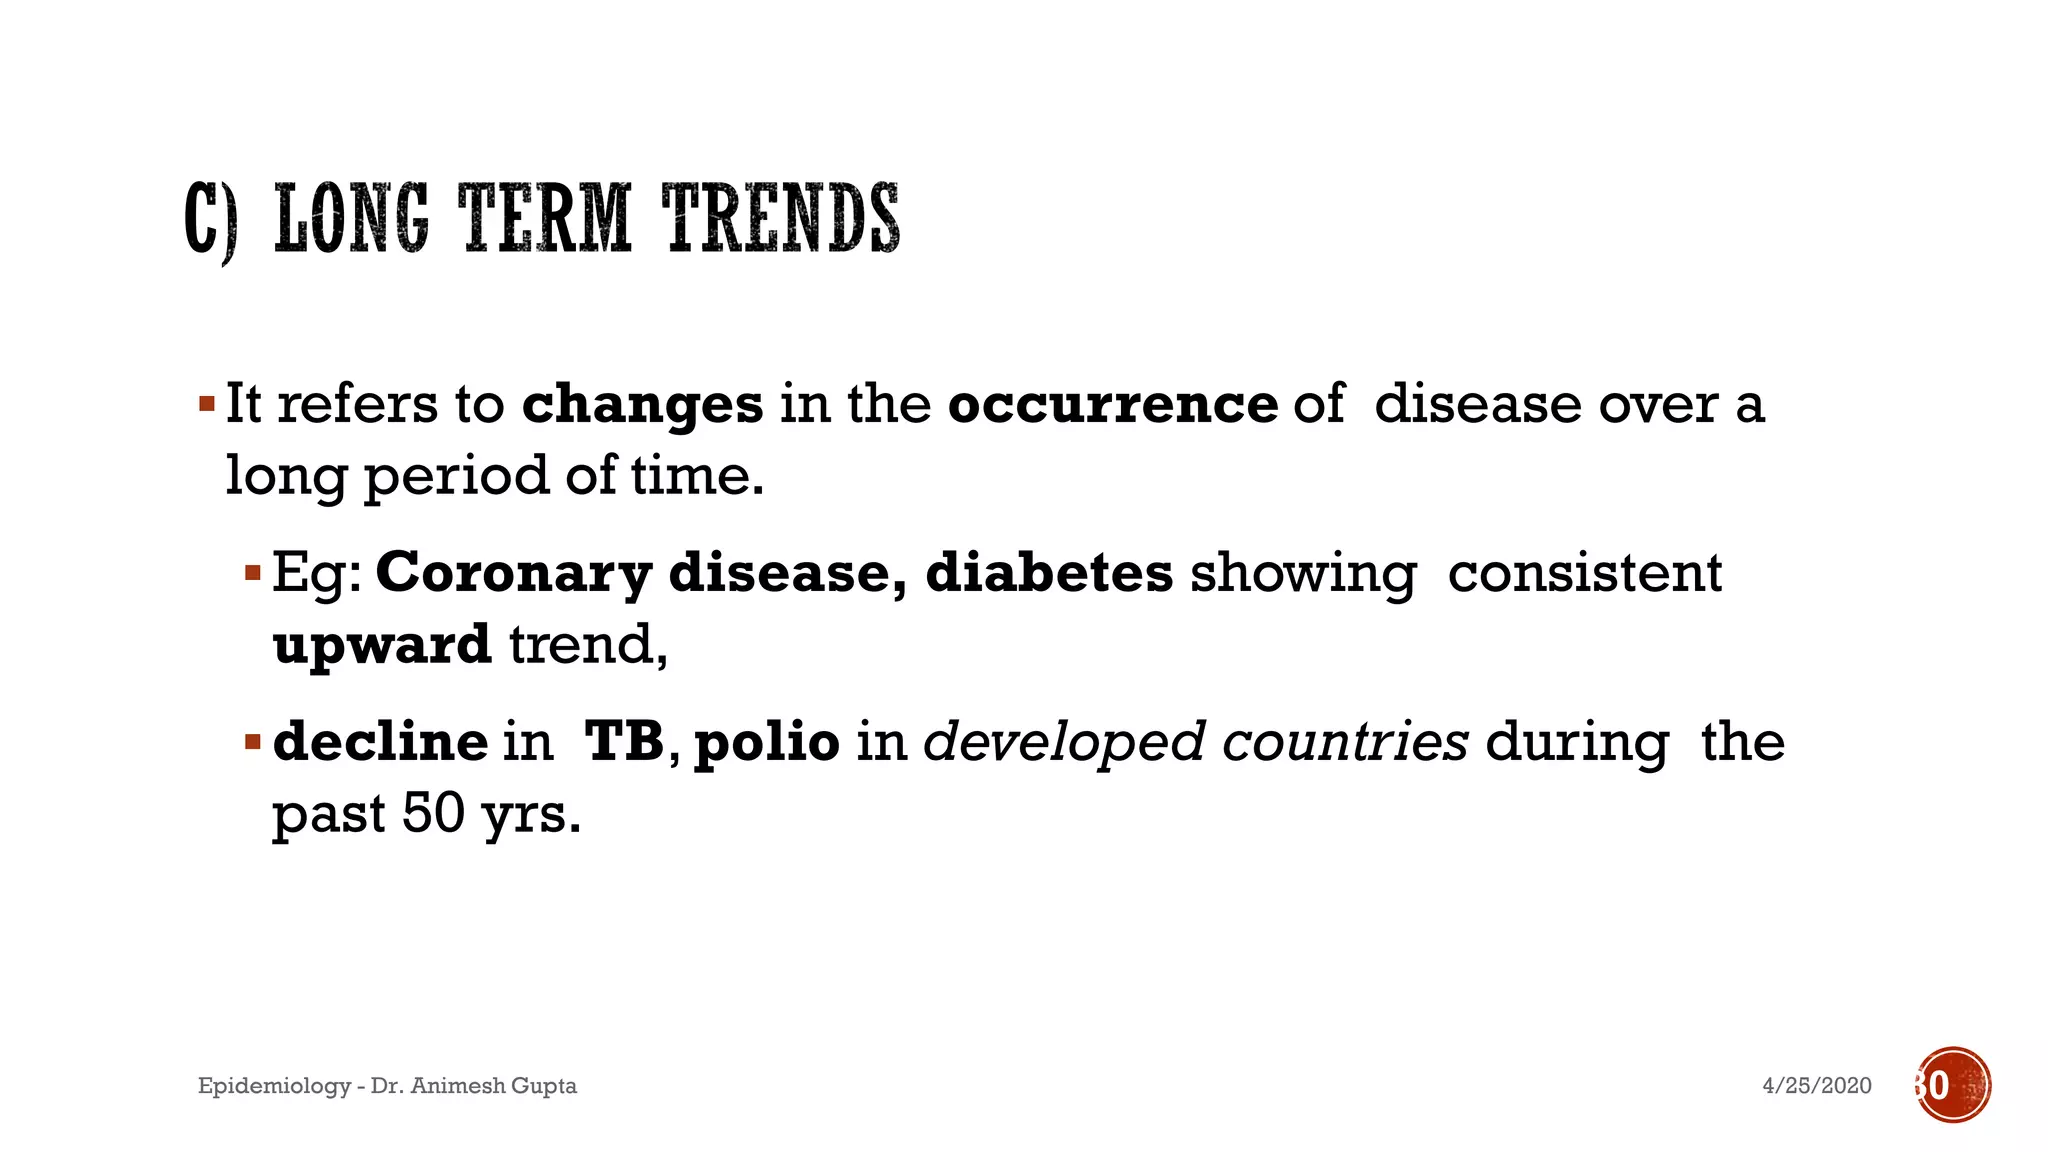
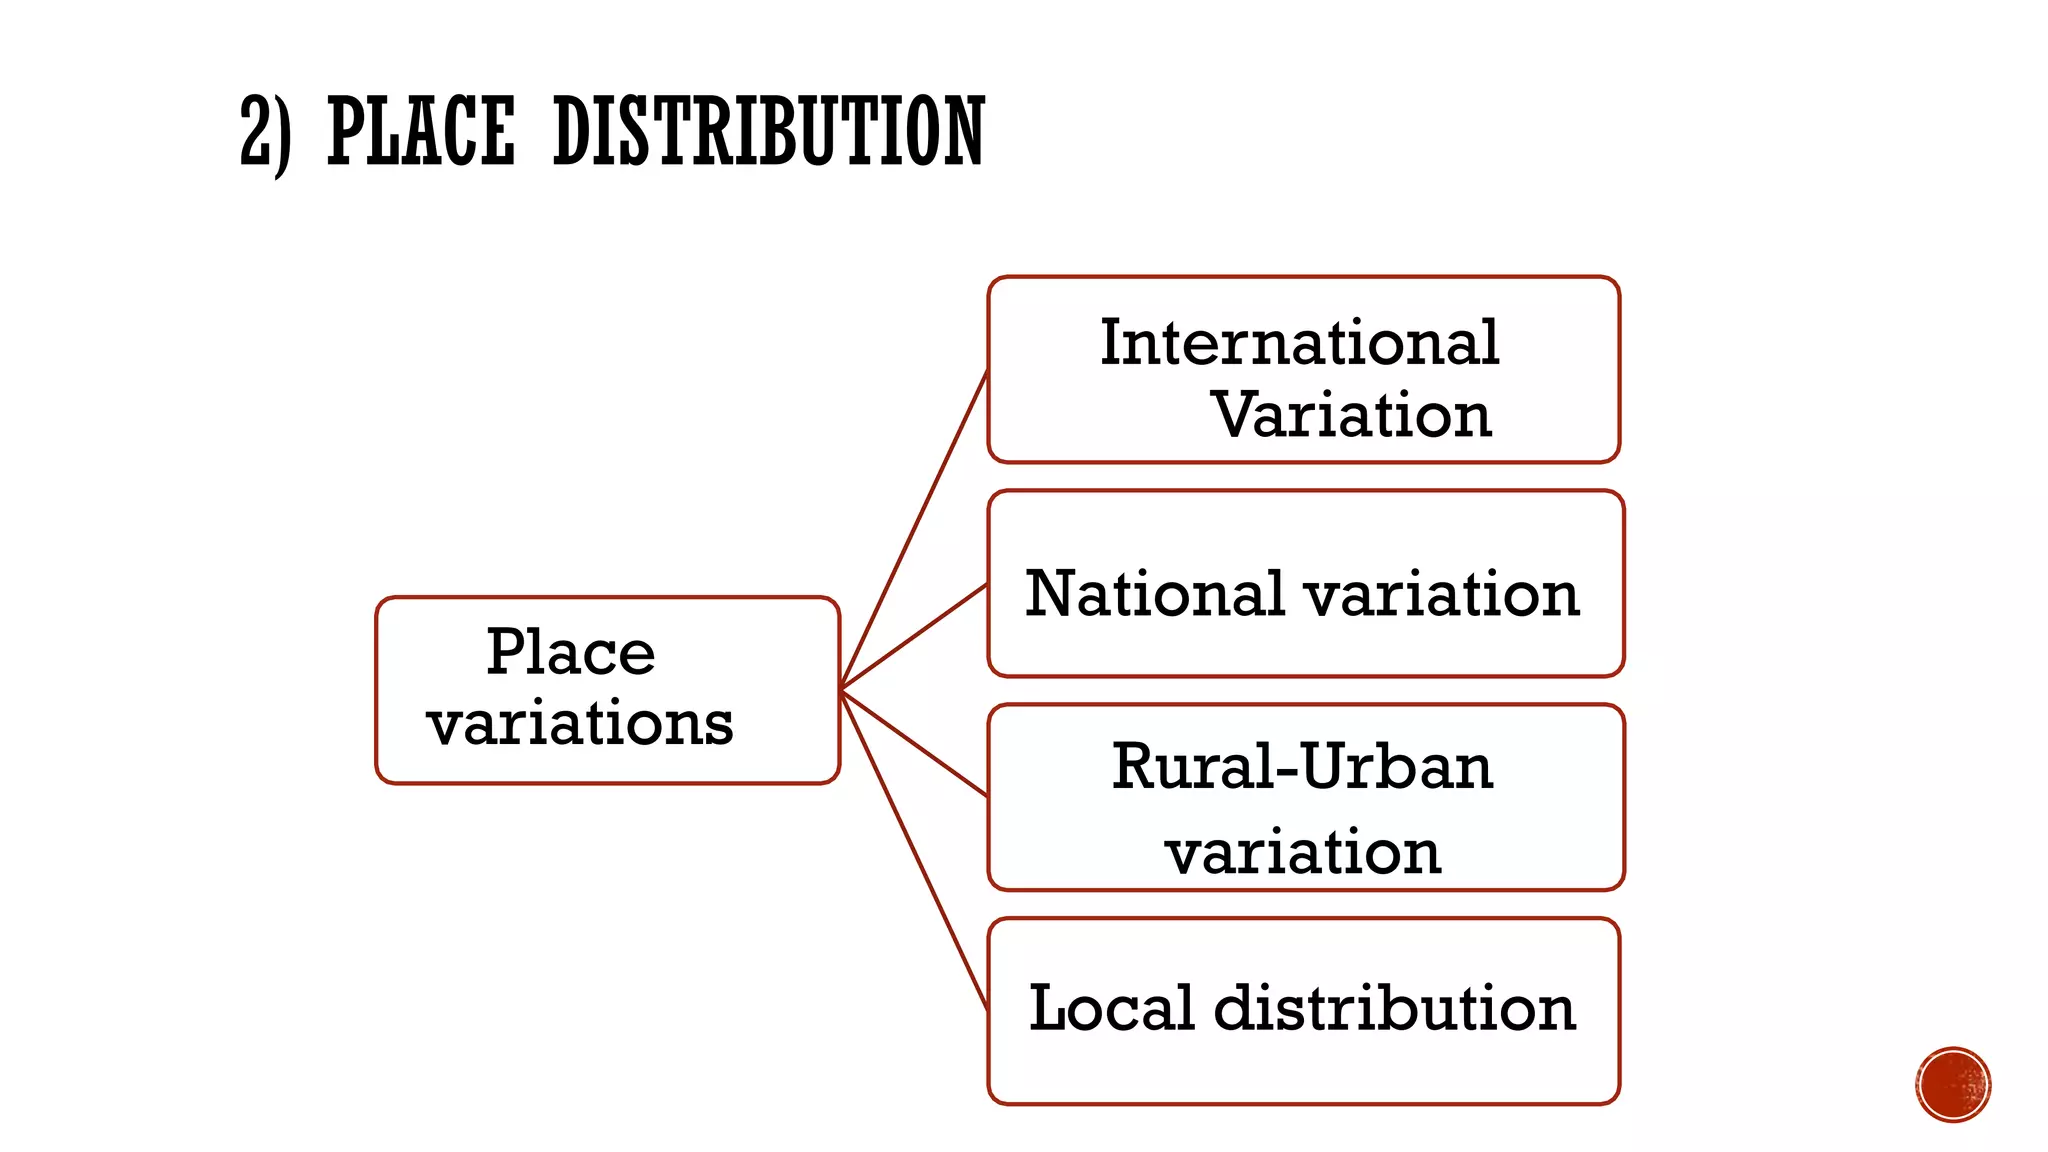
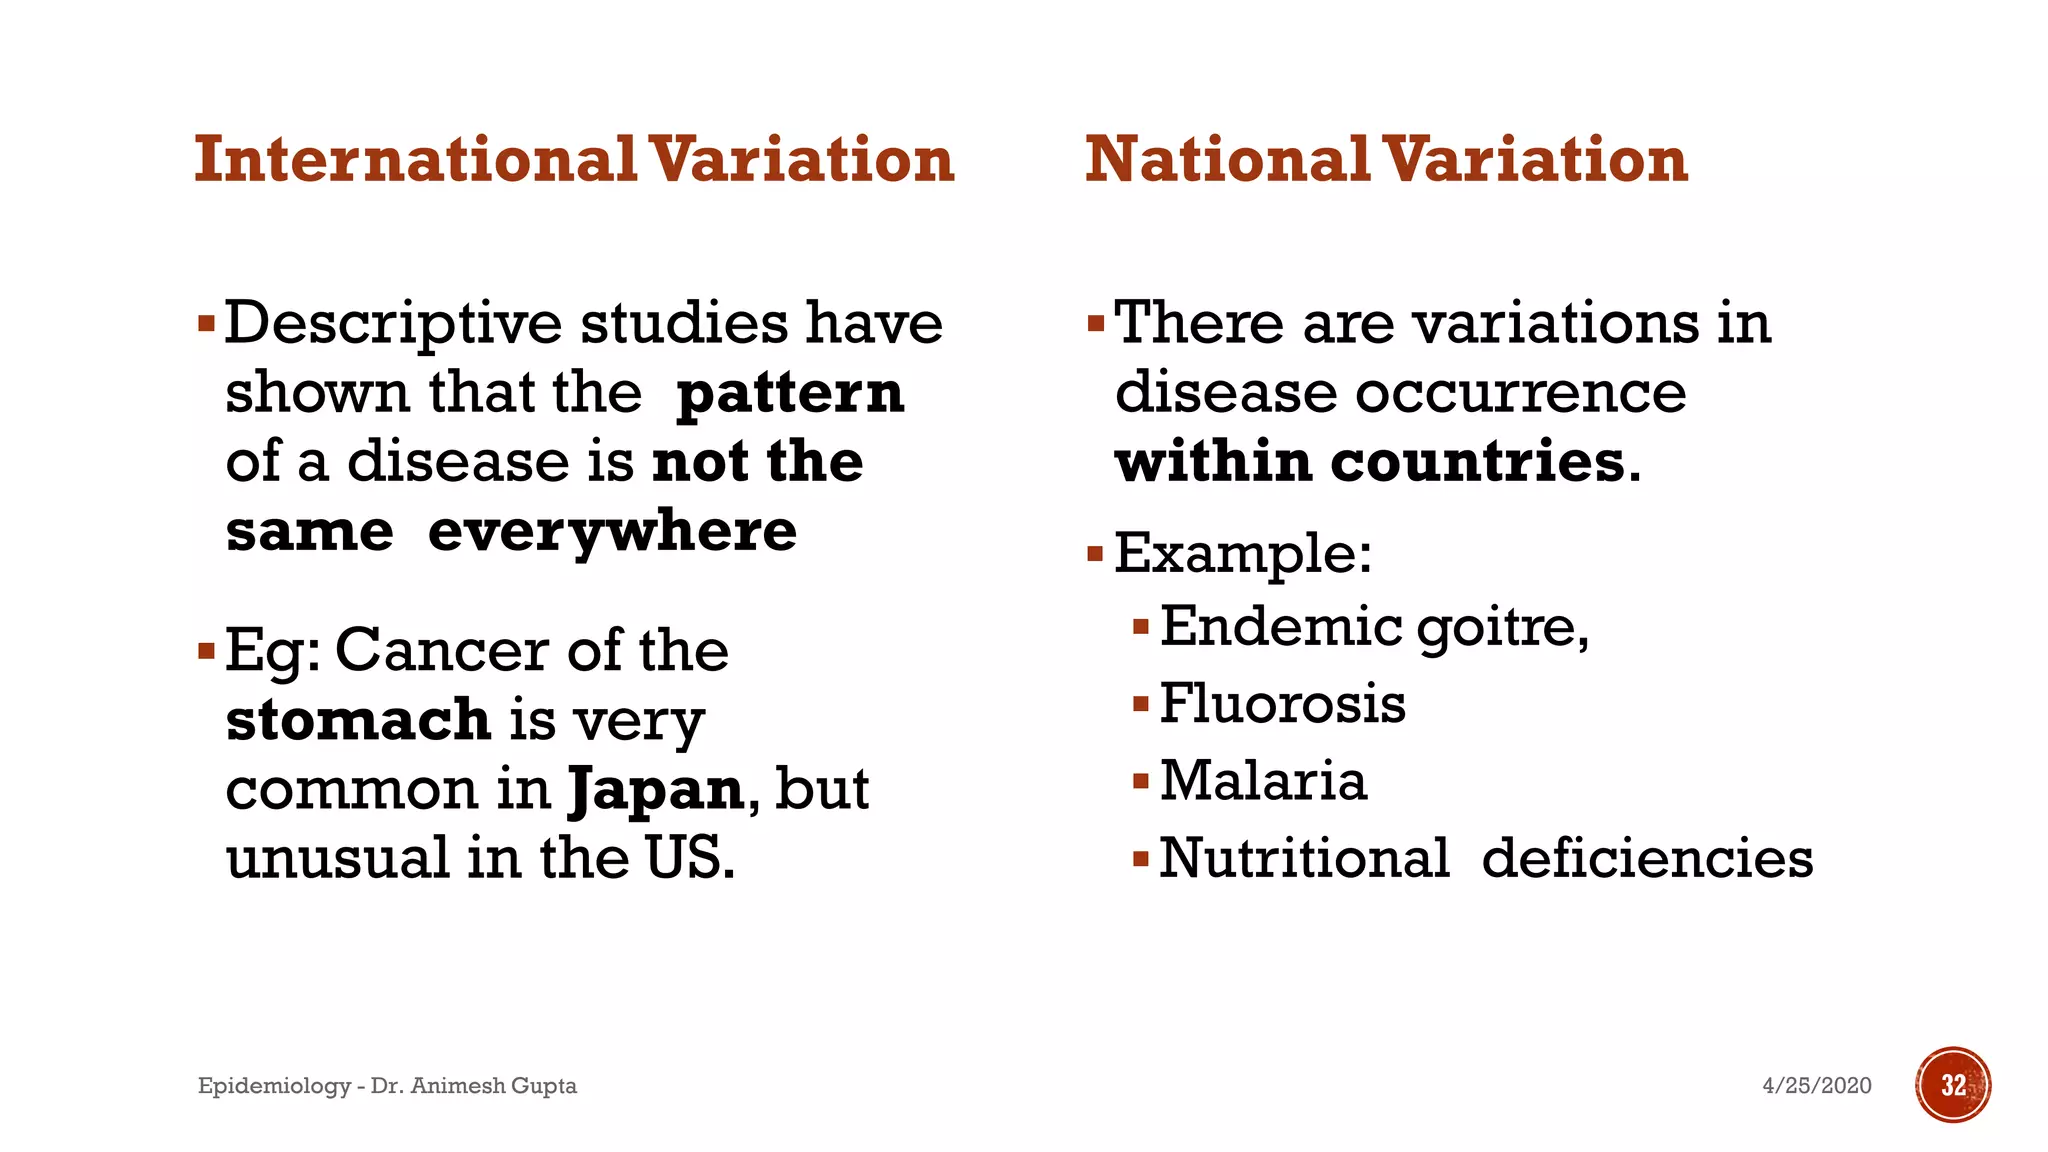
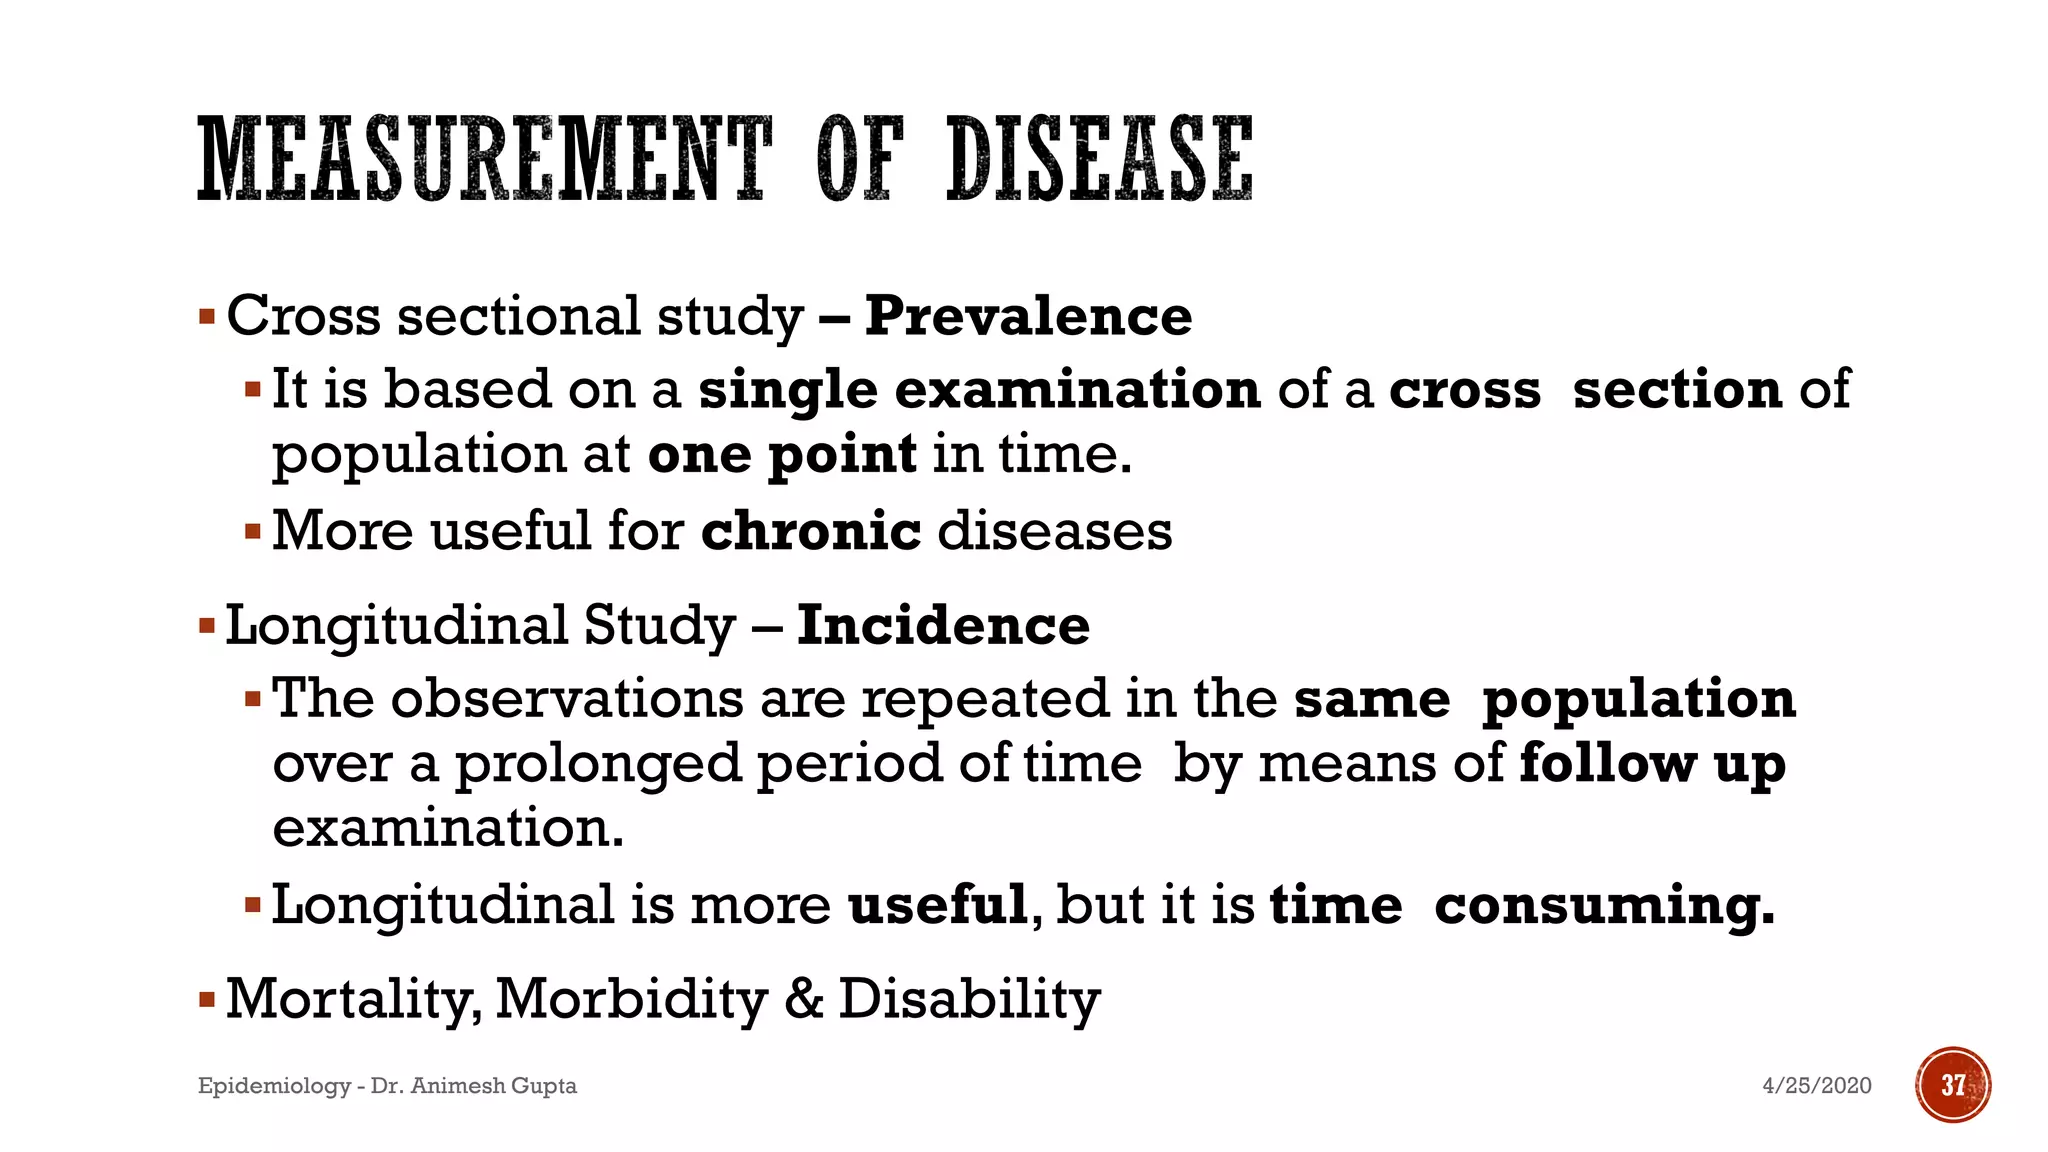
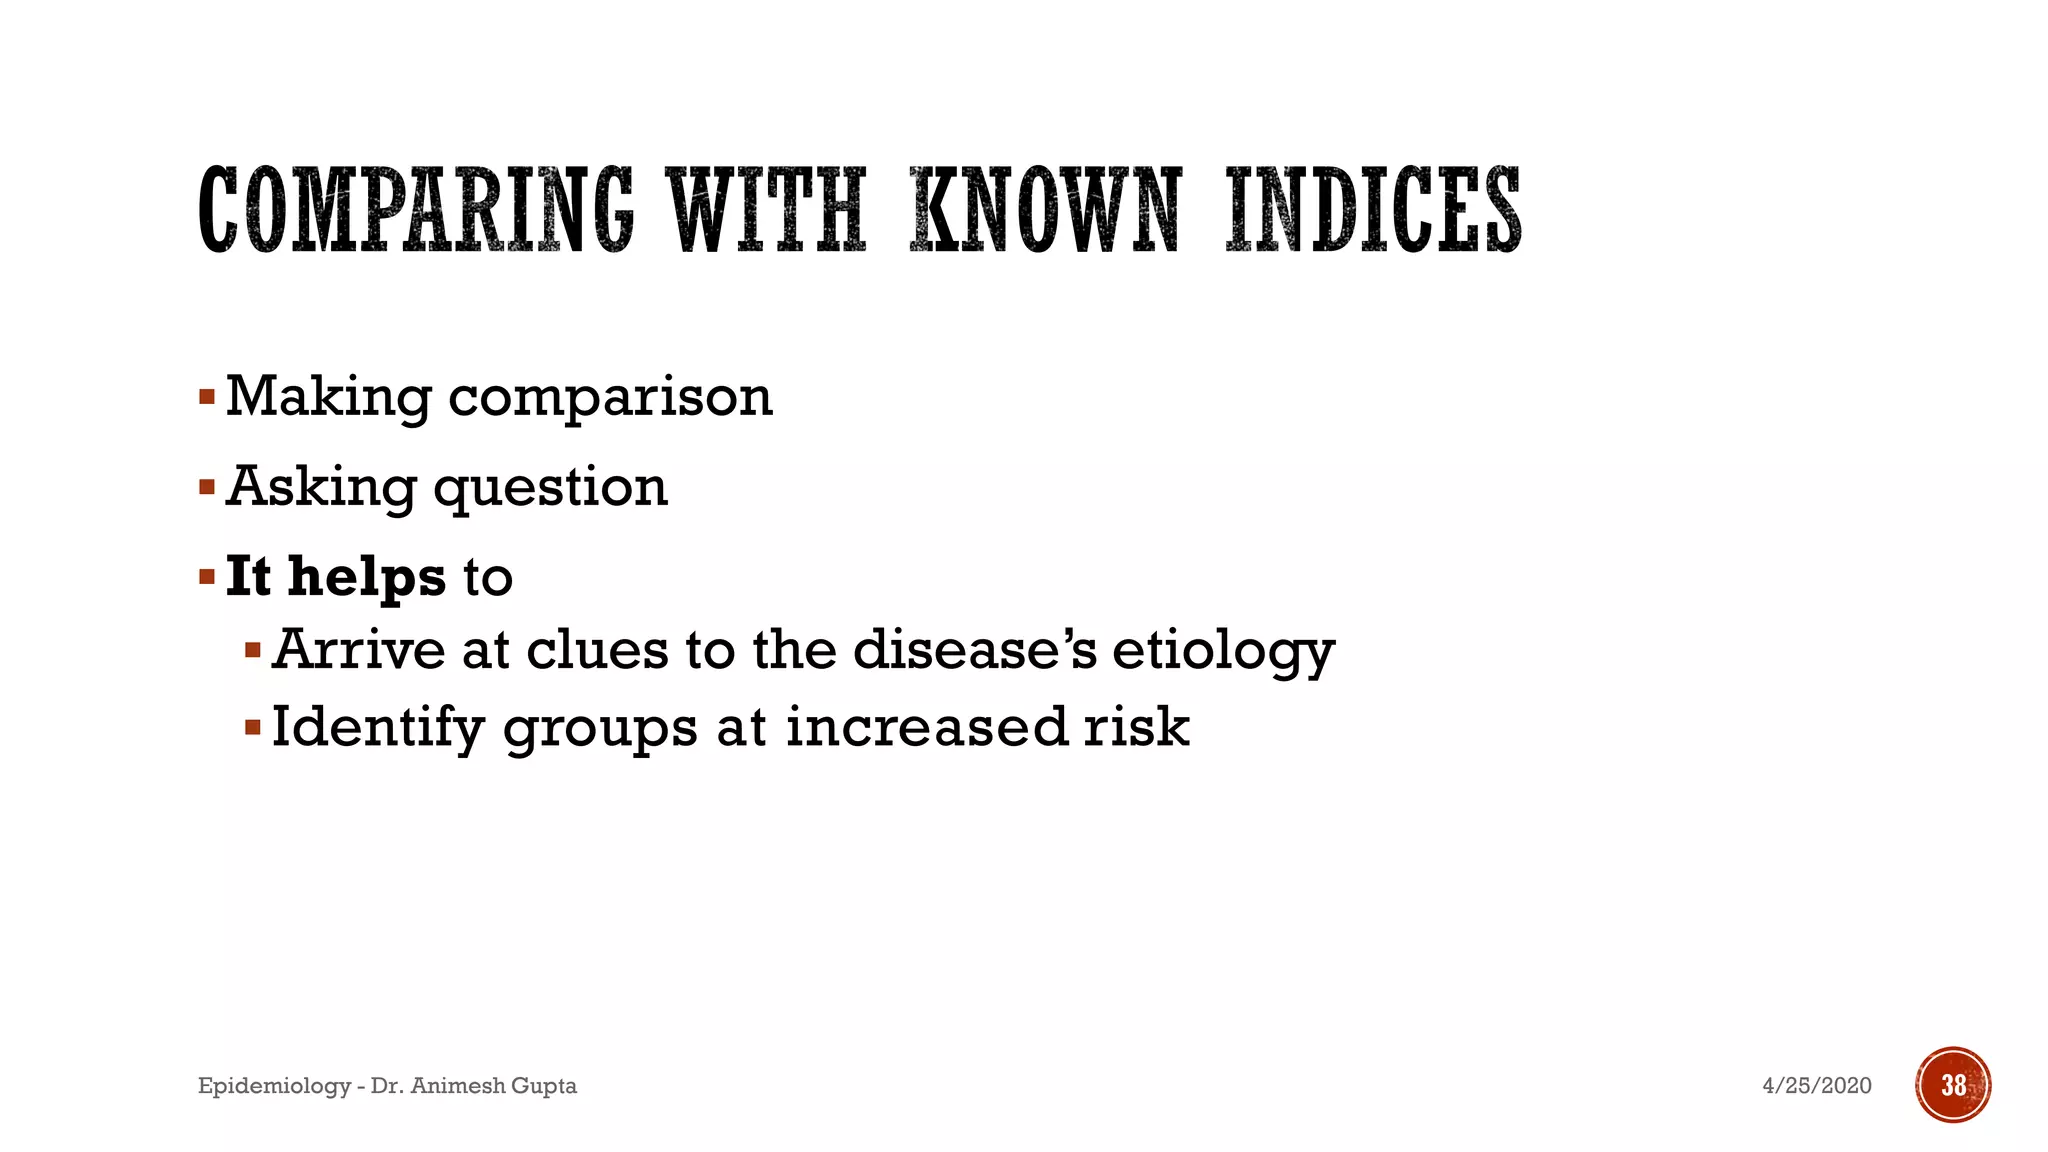
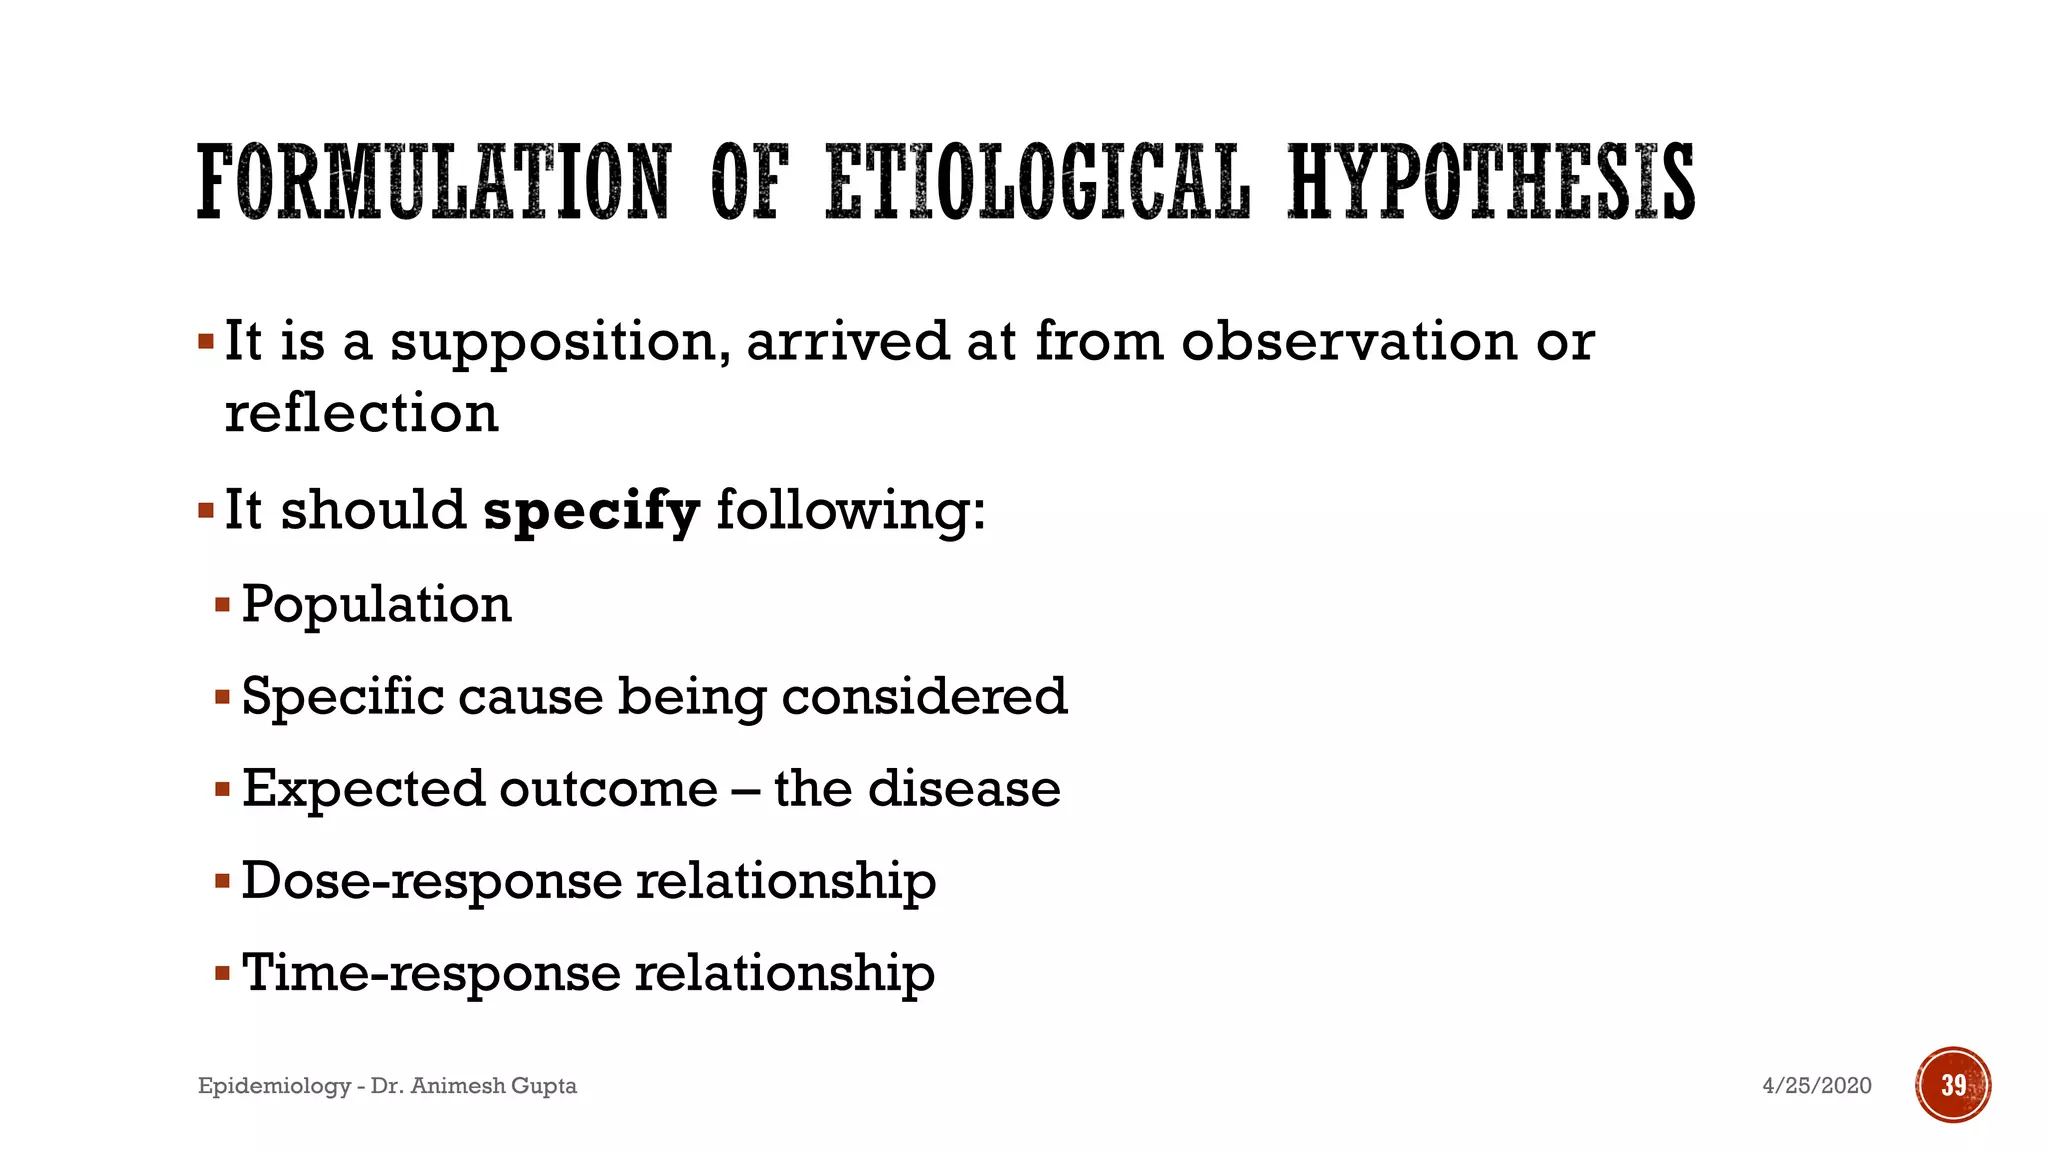
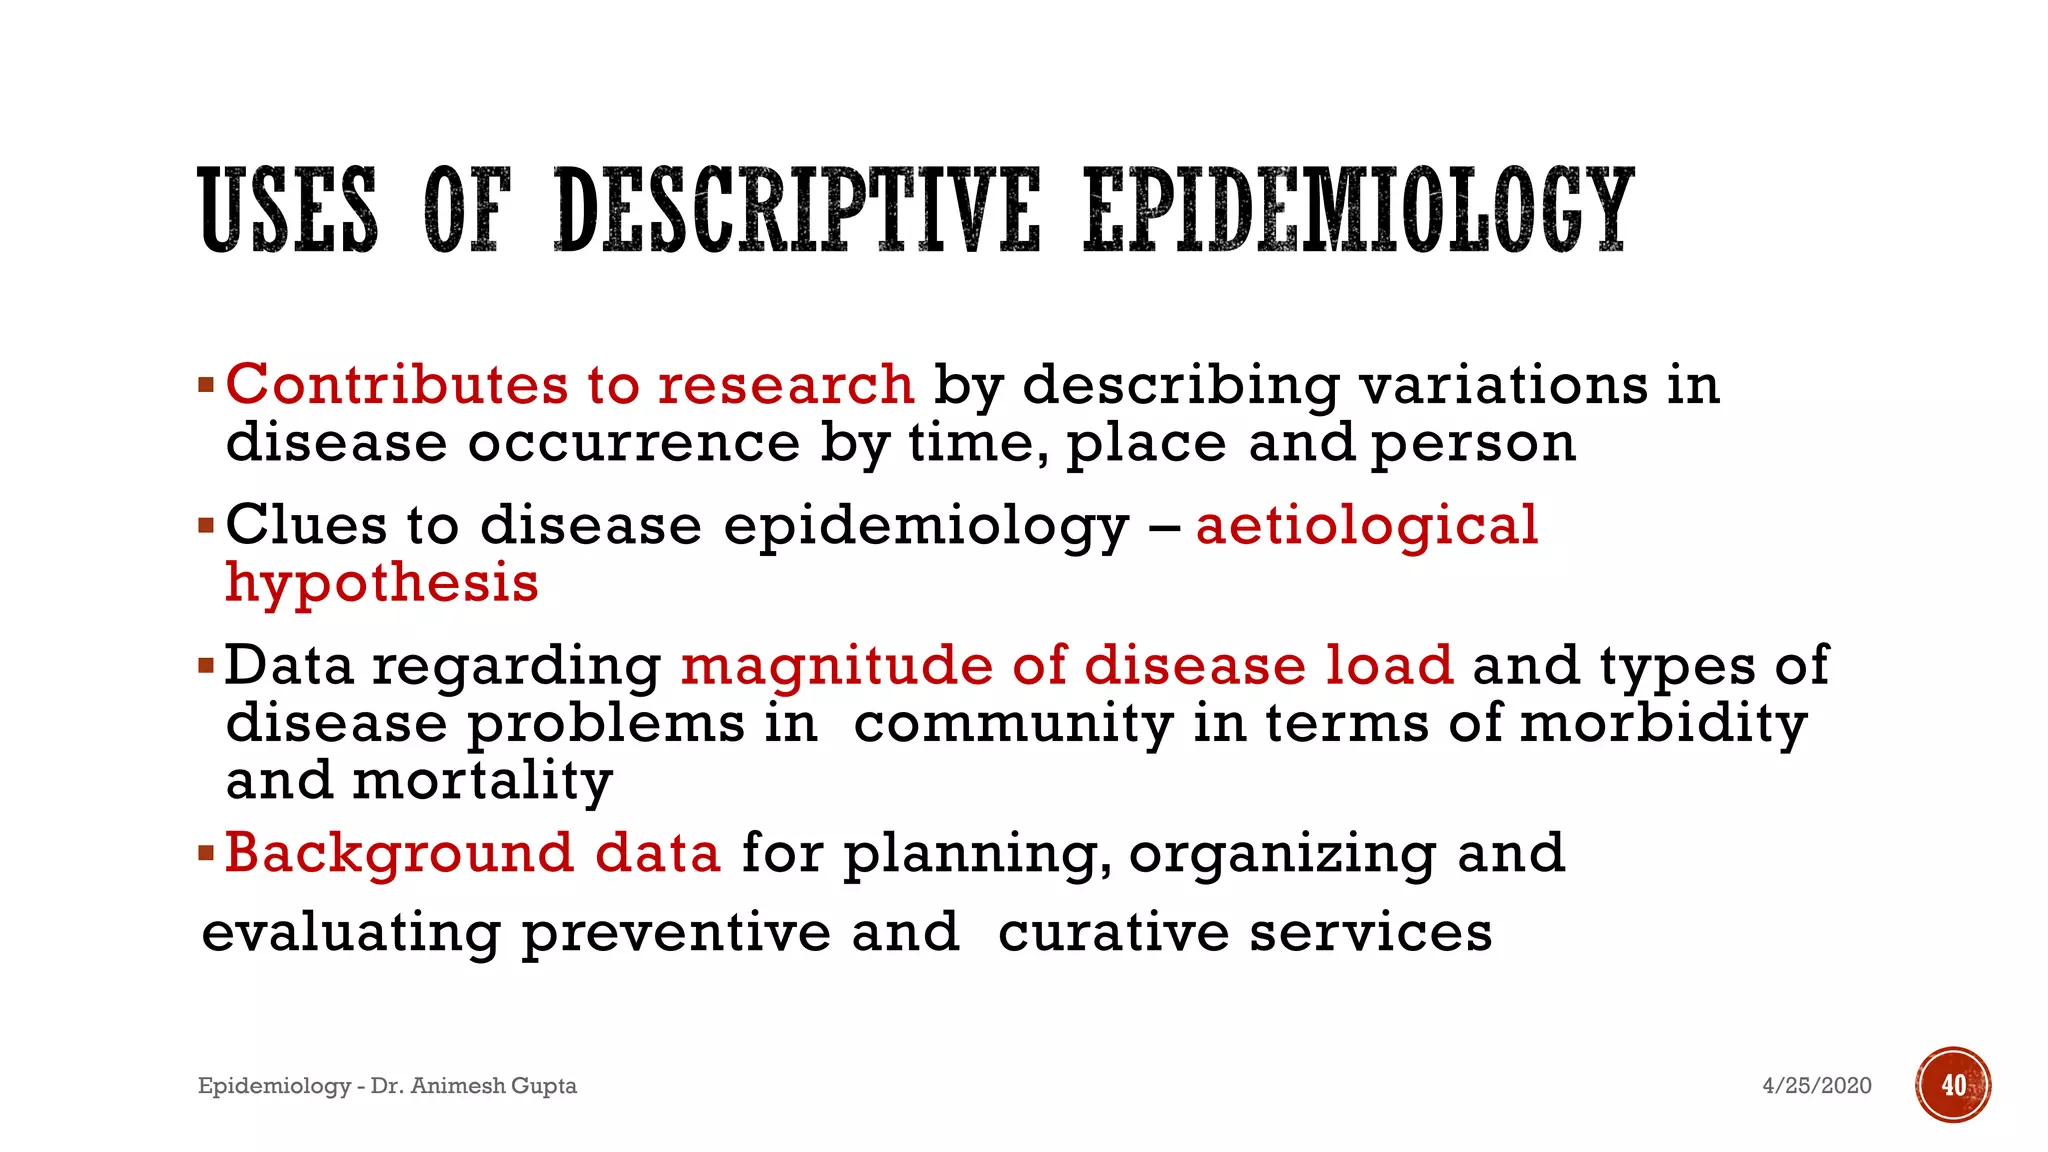
Dr. Animesh Gupta
MBBS,MD,FDM,FAGE
Associate Professor, Dept. of Community Medicine, NMCH, Sasaram (Bihar)
4/25/2020Epidemiology - Dr. Animesh Gupta
1
Measurement of
▪ Mortality
▪ Morbidity
▪ Disability
▪ Presence or absence or distribution of characteristic or
attributes of disease
▪ Health care or health utilization
▪ Demographic variables
4/25/2020Epidemiology - Dr. Animesh Gupta 2
4/25/2020Epidemiology - Dr. Animesh Gupta 3
▪ Incidence – the no. of NEW cases
occurring in a defined population
during a specified period of time".
▪ Prevalence – all current cases (old
and new) existing at a given point in
time, or over a period of time in a
given population.
▪ Prevalence = Incidence * Duration of
illness
4/25/2020Epidemiology - Dr. Animesh Gupta 4
▪Rate
▪ It measures the occurrence of particular event in a population
during given time period.
▪ A rate comprises the following elements - numerator, denominator,
time specification and multiplier.
▪ Example:
Death rate = No. of death in a year/ Mid year population * 1000
4/25/2020Epidemiology - Dr. Animesh Gupta 5
▪Ratio
▪ It expresses a relation in size between two random quantities.
▪ The numerator is not a component of the denominator.
▪Proportion
▪ It is a ratio which indicates the relation in magnitude of a part of the
whole.
▪ The numerator is always included in the denominator.
▪ It is usually expressed as a percentage.
4/25/2020Epidemiology - Dr. Animesh Gupta 6
▪Descriptive
▪Analytic
▪Experimental
▪Study of the occurrence and
distribution of disease
▪Further studies to determine the
validity of a hypothesis concerning
the occurrence of disease.
▪Deliberate manipulation of the cause
is predictably followed by an
alteration in the effect not due to
chance
74/25/2020Epidemiology - Dr. Animesh Gupta
OBSERVATIONAL STUDIES
DESCRIPTIVE STUDY ANALYTICAL STUDIES
✓ TIME
✓ PLACE
✓ PERSON
➢ ECOLOGICAL STUDY
➢ CROSS SECTIONAL STUDY
➢ CASE-CONTROL STUDY
➢ COHORT STUDY
EXPEREMENTAL STUDIES
➢ RANDOMIZED CONTROLLED TRIAL (RCT)
➢FIELD TRIAL
➢COMMUNITY TRIAL 4/25/2020 8Epidemiology - Dr. Animesh Gupta
▪1st phase of an epidemiological investigation
▪Descriptive analysis is limited to a description of the
occurrence of a disease in a population & identifying the
characteristics associated with it
▪Relatively inexpensive and less time-consuming than
analytic studies.
4/25/2020Epidemiology - Dr. Animesh Gupta 9
▪Patterns of disease occurrence, in terms of,
▪When is the disease occurring – time distribution
▪Where is it occurring – place distribution
▪Who is getting a disease – person distribution
4/25/2020Epidemiology - Dr. Animesh Gupta 10
▪ Defining the population to be studied
▪ Defining the disease under study
▪ Describing the disease by
✓ Time
✓ Place
✓ Person
▪ Measurement of disease
▪ Comparing with known indices
▪ Formulation of etiological hypothesis
4/25/2020Epidemiology - Dr. Animesh Gupta 11
▪Define the population in
relation to:
1. Number
2. Age
3. Gender
4. Occupation
5. Cultural and other
characteristics
▪The defined population
can be:
1. Whole population
2. Sample
3. Specially selected
groups
4/25/2020Epidemiology - Dr. Animesh Gupta 12
▪Large enough
▪Stable (no migration)
▪Clear on who belongs to the population
▪Community participation
4/25/2020Epidemiology - Dr. Animesh Gupta 13
▪The epidemiologist defines the disease which can be
measured and identified in the defined population with a
degree of accuracy (operational definition).
▪This is different from the clinician’s definition of a disease.
▪Example - tonsillitis might be defined clinically as an
inflammation of the tonsils caused by infection, usually with
streptococcus pyogenes.
▪OD - presence of enlarged, red tonsils with white exudate,
which on throat swab culture grow predominantly S.
pyogenes.
4/25/2020Epidemiology - Dr. Animesh Gupta 14
TIME PLACE PERSON
Climatic zones Age Birth order
Year, season
Month, week
Country,
region
Gender
Marital state
Family size
Height, weight
Day, hour
Duration
Urban/rural
Towns, cities,
institutions
Occupation
Social status
Education
BP.
Cholesterol,
habits
Objective of descriptive epidemiology?
This involves systemic collection and analysis of data.
4/25/2020Epidemiology - Dr. Animesh Gupta 15
Time
Distribution
Short term
fluctuations
Common
source
Single/Point
exposure
Continuous /
multiple
exposure
propagated
Person to
person
Arthropod
vector
Animal
reservoir
Slow
(modern)
Periodic
fluctuations
Seasonal
trend
Cyclic
trend
Long term or
secular trends
10
4/25/2020Epidemiology - Dr. Animesh Gupta 16
▪An epidemic is the best known short term fluctuation.
▪It is defined as “ The occurrence in a community or region
of cases of an illness or other health related events clearly
in excess of normal expectancy”
4/25/2020Epidemiology - Dr. Animesh Gupta 17
▪ A graph of time distribution ofepidemic cases is called epidemic curve.
4/25/2020Epidemiology - Dr. Animesh Gupta
13
▪ Common source epidemics-
a) Single/Point exposure
b)Continuous/Multiple exposure
▪ Propagated epidemics
a) person to person
b)arthropod vector
c) animal reservoir
▪ Slow(modern) epidemics
4/25/2020Epidemiology - Dr. Animesh Gupta 19
▪ Single exposure
 It can occur due to an infectious agent or as a result of
contamination of the environment and develops within one
incubation period. Eg: Bhopal gas tragedy, Minamata
disease
 The epidemic curve rises and falls rapidly, usually has one
peak
 It tends to be explosive (i.e. clustering of cases within a short
time) 14
4/25/2020Epidemiology - Dr. Animesh Gupta 20
4/25/2020Epidemiology - Dr. Animesh Gupta
▪ Continuous exposure
 It is when the exposure from the same source is prolonged
and the epidemic continues over more than one incubation
period.
 The epidemic reaches a sharp peak, but tails off gradually
over a longer period of time.
 Eg: A well of contaminated water or nationally distributed
vaccine(polio vaccine) or food; water borne cholera.
4/25/2020Epidemiology - Dr. Animesh Gupta
▪The epidemic shows gradual rise and tails off over a much
longer period of time
▪It is more likely to occur where there is
▪large number of susceptible are aggregated
▪regular supply of new susceptible individuals (Births,
Immigrants)
18
4/25/2020Epidemiology - Dr. Animesh Gupta 24
4/25/2020Epidemiology - Dr. Animesh Gupta
COURSE OF A TYPICAL PROPAGATED EPIDEMIC
4/25/2020Epidemiology - Dr. Animesh Gupta
▪Seasonal trend-
▪Seasonal variation is characteristic of many
communicable diseases.
▪Eg: Measles, upper respiratory tract infections(seasonal
rise during winter), Malaria, etc.
▪Non-infectious diseases and conditions may sometimes
exhibit seasonal variation.
▪Example - Sunstroke, hay fever
21
4/25/2020Epidemiology - Dr. Animesh Gupta 27
4/25/2020Epidemiology - Dr. Animesh Gupta
▪Some diseases occur in cycles spread over short periods
of time (days, weeks, months or years) .
▪Eg: Influenza pandemics are known to occur at intervals
of 7-10yrs due to antigenic variations.
▪Non-infectious conditions may also occur in this trend.
▪Eg: Automobile accidents are more frequent on
weekends.
294/25/2020Epidemiology - Dr. Animesh Gupta
▪It refers to changes in the occurrence of disease over a
long period of time.
▪Eg: Coronary disease, diabetes showing consistent
upward trend,
▪decline in TB, polio in developed countries during the
past 50 yrs.
4/25/2020Epidemiology - Dr. Animesh Gupta 30
2) PLACE DISTRIBUTION
Place
variations
International
Variation
National variation
Rural-Urban
variation
Local distribution 25
InternationalVariation
▪Descriptive studies have
shown that the pattern
of a disease is not the
same everywhere
▪Eg: Cancer of the
stomach is very
common in Japan, but
unusual in the US.
NationalVariation
▪There are variations in
disease occurrence
within countries.
▪Example:
▪Endemic goitre,
▪Fluorosis
▪Malaria
▪Nutritional deficiencies
4/25/2020Epidemiology - Dr. Animesh Gupta 32
▪Due to differences in population density, levels of
sanitation, deficiencies of medical care, education and
environment factors, there exists a rural-urban variation
▪Chronic bronchitis, cardiovascular diseases, accidents are
more frequent in urban than rural areas.
▪Skin and zoonotic diseases and soil transmitted helminths
may be more frequent in rural than urban areas
4/25/2020Epidemiology - Dr. Animesh Gupta 33
▪These variations can be
studied with the help of “spot
or shaded” maps.
▪If the map showed clustering,
it may suggest a common
source of infection.
▪Eg: Study of Cholera epidemic
by John Snow in 1854
4/25/2020Epidemiology - Dr. Animesh Gupta 34
▪Way of distinguishing genetic and environmental factors.
▪Study of genetically similar groups but living under
different environmental conditions.
▪ Eg: Twins
▪Study of genetically different groups living in a
similar environment.
▪ Eg: Men of Japanese origin living in USA have higher rate of
coronary heart disease than the Japanese in Japan
4/25/2020Epidemiology - Dr. Animesh Gupta 35
▪Age
▪Gender
▪Marital status
▪Occupation
▪Ethnicity
▪Social factors like customs, Social class
▪Habits
▪Migration
4/25/2020Epidemiology - Dr. Animesh Gupta 36
▪Cross sectional study – Prevalence
▪It is based on a single examination of a cross section of
population at one point in time.
▪More useful for chronic diseases
▪Longitudinal Study – Incidence
▪The observations are repeated in the same population
over a prolonged period of time by means of follow up
examination.
▪Longitudinal is more useful, but it is time consuming.
▪Mortality, Morbidity & Disability
4/25/2020Epidemiology - Dr. Animesh Gupta 37
▪Making comparison
▪Asking question
▪It helps to
▪Arrive at clues to the disease’s etiology
▪Identify groups at increased risk
4/25/2020Epidemiology - Dr. Animesh Gupta 38
▪It is a supposition, arrived at from observation or
reflection
▪It should specify following:
▪ Population
▪ Specific cause being considered
▪ Expected outcome – the disease
▪ Dose-response relationship
▪ Time-response relationship
4/25/2020Epidemiology - Dr. Animesh Gupta 39
▪Contributes to research by describing variations in
disease occurrence by time, place and person
▪Clues to disease epidemiology – aetiological
hypothesis
▪Data regarding magnitude of disease load and types of
disease problems in community in terms of morbidity
and mortality
▪Background data for planning, organizing and
evaluating preventive and curative services
4/25/2020Epidemiology - Dr. Animesh Gupta 40
▪Epidemiological methods (Classification)
▪Descriptive epidemiology
▪Defining the population
▪Defining the disease under study
▪Describing the disease
▪Measurement of disease
▪Comparing with known indices
▪Formulation of etiological hypothesis
▪Uses
4/25/2020Epidemiology - Dr. Animesh Gupta 41
Steps
4/25/2020Epidemiology - Dr. Animesh Gupta 42

Descriptive Epidemiology (including Measurement in epidemiology)

  • 1.
    Dr. Animesh Gupta MBBS,MD,FDM,FAGE AssociateProfessor, Dept. of Community Medicine, NMCH, Sasaram (Bihar) 4/25/2020Epidemiology - Dr. Animesh Gupta 1
  • 2.
    Measurement of ▪ Mortality ▪Morbidity ▪ Disability ▪ Presence or absence or distribution of characteristic or attributes of disease ▪ Health care or health utilization ▪ Demographic variables 4/25/2020Epidemiology - Dr. Animesh Gupta 2
  • 3.
    4/25/2020Epidemiology - Dr.Animesh Gupta 3 ▪ Incidence – the no. of NEW cases occurring in a defined population during a specified period of time". ▪ Prevalence – all current cases (old and new) existing at a given point in time, or over a period of time in a given population. ▪ Prevalence = Incidence * Duration of illness
  • 4.
  • 5.
    ▪Rate ▪ It measuresthe occurrence of particular event in a population during given time period. ▪ A rate comprises the following elements - numerator, denominator, time specification and multiplier. ▪ Example: Death rate = No. of death in a year/ Mid year population * 1000 4/25/2020Epidemiology - Dr. Animesh Gupta 5
  • 6.
    ▪Ratio ▪ It expressesa relation in size between two random quantities. ▪ The numerator is not a component of the denominator. ▪Proportion ▪ It is a ratio which indicates the relation in magnitude of a part of the whole. ▪ The numerator is always included in the denominator. ▪ It is usually expressed as a percentage. 4/25/2020Epidemiology - Dr. Animesh Gupta 6
  • 7.
    ▪Descriptive ▪Analytic ▪Experimental ▪Study of theoccurrence and distribution of disease ▪Further studies to determine the validity of a hypothesis concerning the occurrence of disease. ▪Deliberate manipulation of the cause is predictably followed by an alteration in the effect not due to chance 74/25/2020Epidemiology - Dr. Animesh Gupta
  • 8.
    OBSERVATIONAL STUDIES DESCRIPTIVE STUDYANALYTICAL STUDIES ✓ TIME ✓ PLACE ✓ PERSON ➢ ECOLOGICAL STUDY ➢ CROSS SECTIONAL STUDY ➢ CASE-CONTROL STUDY ➢ COHORT STUDY EXPEREMENTAL STUDIES ➢ RANDOMIZED CONTROLLED TRIAL (RCT) ➢FIELD TRIAL ➢COMMUNITY TRIAL 4/25/2020 8Epidemiology - Dr. Animesh Gupta
  • 9.
    ▪1st phase ofan epidemiological investigation ▪Descriptive analysis is limited to a description of the occurrence of a disease in a population & identifying the characteristics associated with it ▪Relatively inexpensive and less time-consuming than analytic studies. 4/25/2020Epidemiology - Dr. Animesh Gupta 9
  • 10.
    ▪Patterns of diseaseoccurrence, in terms of, ▪When is the disease occurring – time distribution ▪Where is it occurring – place distribution ▪Who is getting a disease – person distribution 4/25/2020Epidemiology - Dr. Animesh Gupta 10
  • 11.
    ▪ Defining thepopulation to be studied ▪ Defining the disease under study ▪ Describing the disease by ✓ Time ✓ Place ✓ Person ▪ Measurement of disease ▪ Comparing with known indices ▪ Formulation of etiological hypothesis 4/25/2020Epidemiology - Dr. Animesh Gupta 11
  • 12.
    ▪Define the populationin relation to: 1. Number 2. Age 3. Gender 4. Occupation 5. Cultural and other characteristics ▪The defined population can be: 1. Whole population 2. Sample 3. Specially selected groups 4/25/2020Epidemiology - Dr. Animesh Gupta 12
  • 13.
    ▪Large enough ▪Stable (nomigration) ▪Clear on who belongs to the population ▪Community participation 4/25/2020Epidemiology - Dr. Animesh Gupta 13
  • 14.
    ▪The epidemiologist definesthe disease which can be measured and identified in the defined population with a degree of accuracy (operational definition). ▪This is different from the clinician’s definition of a disease. ▪Example - tonsillitis might be defined clinically as an inflammation of the tonsils caused by infection, usually with streptococcus pyogenes. ▪OD - presence of enlarged, red tonsils with white exudate, which on throat swab culture grow predominantly S. pyogenes. 4/25/2020Epidemiology - Dr. Animesh Gupta 14
  • 15.
    TIME PLACE PERSON Climaticzones Age Birth order Year, season Month, week Country, region Gender Marital state Family size Height, weight Day, hour Duration Urban/rural Towns, cities, institutions Occupation Social status Education BP. Cholesterol, habits Objective of descriptive epidemiology? This involves systemic collection and analysis of data. 4/25/2020Epidemiology - Dr. Animesh Gupta 15
  • 16.
    Time Distribution Short term fluctuations Common source Single/Point exposure Continuous / multiple exposure propagated Personto person Arthropod vector Animal reservoir Slow (modern) Periodic fluctuations Seasonal trend Cyclic trend Long term or secular trends 10 4/25/2020Epidemiology - Dr. Animesh Gupta 16
  • 17.
    ▪An epidemic isthe best known short term fluctuation. ▪It is defined as “ The occurrence in a community or region of cases of an illness or other health related events clearly in excess of normal expectancy” 4/25/2020Epidemiology - Dr. Animesh Gupta 17
  • 18.
    ▪ A graphof time distribution ofepidemic cases is called epidemic curve. 4/25/2020Epidemiology - Dr. Animesh Gupta
  • 19.
    13 ▪ Common sourceepidemics- a) Single/Point exposure b)Continuous/Multiple exposure ▪ Propagated epidemics a) person to person b)arthropod vector c) animal reservoir ▪ Slow(modern) epidemics 4/25/2020Epidemiology - Dr. Animesh Gupta 19
  • 20.
    ▪ Single exposure It can occur due to an infectious agent or as a result of contamination of the environment and develops within one incubation period. Eg: Bhopal gas tragedy, Minamata disease  The epidemic curve rises and falls rapidly, usually has one peak  It tends to be explosive (i.e. clustering of cases within a short time) 14 4/25/2020Epidemiology - Dr. Animesh Gupta 20
  • 21.
  • 22.
    ▪ Continuous exposure It is when the exposure from the same source is prolonged and the epidemic continues over more than one incubation period.  The epidemic reaches a sharp peak, but tails off gradually over a longer period of time.  Eg: A well of contaminated water or nationally distributed vaccine(polio vaccine) or food; water borne cholera. 4/25/2020Epidemiology - Dr. Animesh Gupta
  • 23.
  • 24.
    ▪The epidemic showsgradual rise and tails off over a much longer period of time ▪It is more likely to occur where there is ▪large number of susceptible are aggregated ▪regular supply of new susceptible individuals (Births, Immigrants) 18 4/25/2020Epidemiology - Dr. Animesh Gupta 24
  • 25.
  • 26.
    COURSE OF ATYPICAL PROPAGATED EPIDEMIC 4/25/2020Epidemiology - Dr. Animesh Gupta
  • 27.
    ▪Seasonal trend- ▪Seasonal variationis characteristic of many communicable diseases. ▪Eg: Measles, upper respiratory tract infections(seasonal rise during winter), Malaria, etc. ▪Non-infectious diseases and conditions may sometimes exhibit seasonal variation. ▪Example - Sunstroke, hay fever 21 4/25/2020Epidemiology - Dr. Animesh Gupta 27
  • 28.
  • 29.
    ▪Some diseases occurin cycles spread over short periods of time (days, weeks, months or years) . ▪Eg: Influenza pandemics are known to occur at intervals of 7-10yrs due to antigenic variations. ▪Non-infectious conditions may also occur in this trend. ▪Eg: Automobile accidents are more frequent on weekends. 294/25/2020Epidemiology - Dr. Animesh Gupta
  • 30.
    ▪It refers tochanges in the occurrence of disease over a long period of time. ▪Eg: Coronary disease, diabetes showing consistent upward trend, ▪decline in TB, polio in developed countries during the past 50 yrs. 4/25/2020Epidemiology - Dr. Animesh Gupta 30
  • 31.
    2) PLACE DISTRIBUTION Place variations International Variation Nationalvariation Rural-Urban variation Local distribution 25
  • 32.
    InternationalVariation ▪Descriptive studies have shownthat the pattern of a disease is not the same everywhere ▪Eg: Cancer of the stomach is very common in Japan, but unusual in the US. NationalVariation ▪There are variations in disease occurrence within countries. ▪Example: ▪Endemic goitre, ▪Fluorosis ▪Malaria ▪Nutritional deficiencies 4/25/2020Epidemiology - Dr. Animesh Gupta 32
  • 33.
    ▪Due to differencesin population density, levels of sanitation, deficiencies of medical care, education and environment factors, there exists a rural-urban variation ▪Chronic bronchitis, cardiovascular diseases, accidents are more frequent in urban than rural areas. ▪Skin and zoonotic diseases and soil transmitted helminths may be more frequent in rural than urban areas 4/25/2020Epidemiology - Dr. Animesh Gupta 33
  • 34.
    ▪These variations canbe studied with the help of “spot or shaded” maps. ▪If the map showed clustering, it may suggest a common source of infection. ▪Eg: Study of Cholera epidemic by John Snow in 1854 4/25/2020Epidemiology - Dr. Animesh Gupta 34
  • 35.
    ▪Way of distinguishinggenetic and environmental factors. ▪Study of genetically similar groups but living under different environmental conditions. ▪ Eg: Twins ▪Study of genetically different groups living in a similar environment. ▪ Eg: Men of Japanese origin living in USA have higher rate of coronary heart disease than the Japanese in Japan 4/25/2020Epidemiology - Dr. Animesh Gupta 35
  • 36.
    ▪Age ▪Gender ▪Marital status ▪Occupation ▪Ethnicity ▪Social factorslike customs, Social class ▪Habits ▪Migration 4/25/2020Epidemiology - Dr. Animesh Gupta 36
  • 37.
    ▪Cross sectional study– Prevalence ▪It is based on a single examination of a cross section of population at one point in time. ▪More useful for chronic diseases ▪Longitudinal Study – Incidence ▪The observations are repeated in the same population over a prolonged period of time by means of follow up examination. ▪Longitudinal is more useful, but it is time consuming. ▪Mortality, Morbidity & Disability 4/25/2020Epidemiology - Dr. Animesh Gupta 37
  • 38.
    ▪Making comparison ▪Asking question ▪Ithelps to ▪Arrive at clues to the disease’s etiology ▪Identify groups at increased risk 4/25/2020Epidemiology - Dr. Animesh Gupta 38
  • 39.
    ▪It is asupposition, arrived at from observation or reflection ▪It should specify following: ▪ Population ▪ Specific cause being considered ▪ Expected outcome – the disease ▪ Dose-response relationship ▪ Time-response relationship 4/25/2020Epidemiology - Dr. Animesh Gupta 39
  • 40.
    ▪Contributes to researchby describing variations in disease occurrence by time, place and person ▪Clues to disease epidemiology – aetiological hypothesis ▪Data regarding magnitude of disease load and types of disease problems in community in terms of morbidity and mortality ▪Background data for planning, organizing and evaluating preventive and curative services 4/25/2020Epidemiology - Dr. Animesh Gupta 40
  • 41.
    ▪Epidemiological methods (Classification) ▪Descriptiveepidemiology ▪Defining the population ▪Defining the disease under study ▪Describing the disease ▪Measurement of disease ▪Comparing with known indices ▪Formulation of etiological hypothesis ▪Uses 4/25/2020Epidemiology - Dr. Animesh Gupta 41 Steps
  • 42.