Download to read offline

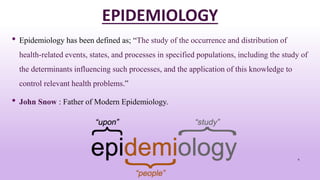
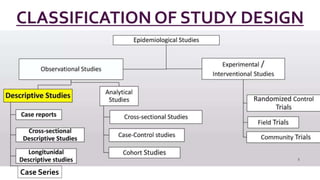
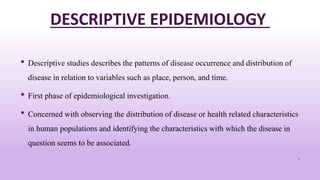
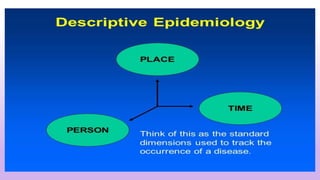


The document presents a comprehensive overview of descriptive epidemiology, defining its role in public health, study designs, and procedures involved in descriptive studies. It highlights the importance of understanding disease patterns in relation to time, place, and person, as well as the significance of hypothesis formulation and the limitations of descriptive epidemiology. Various types of descriptive studies are discussed, including case reports, cross-sectional studies, and longitudinal studies, underscoring their utility in identifying health trends and disease associations.


