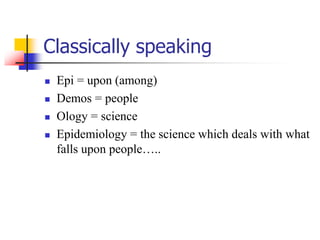
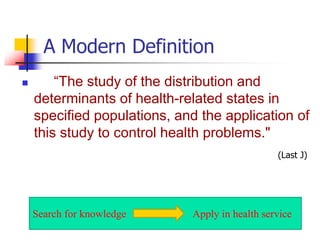
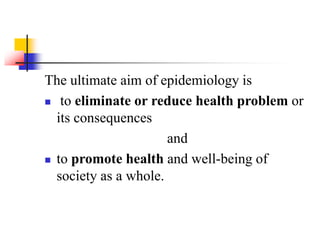
This document provides an overview of epidemiology. It begins by defining epidemiology as the study of what falls upon populations in terms of health and disease. A modern definition is provided that describes epidemiology as studying the distribution and determinants of health states in populations.
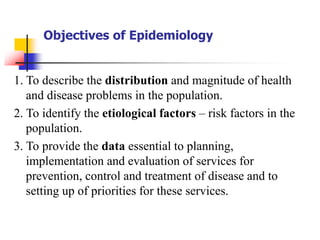
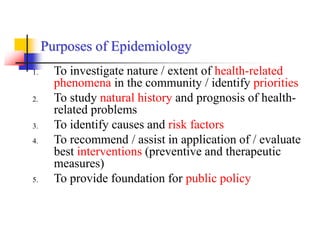
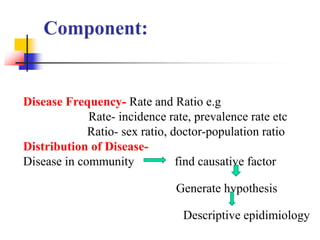
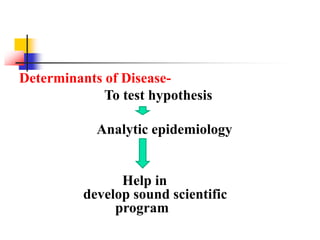
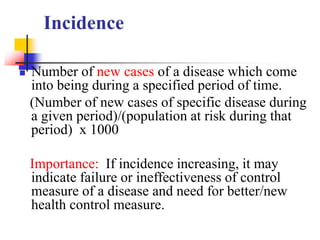
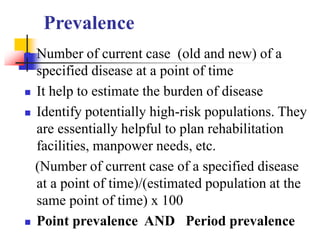
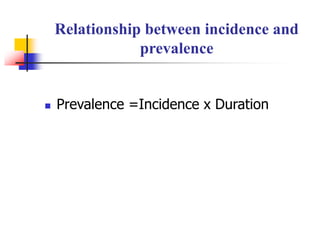
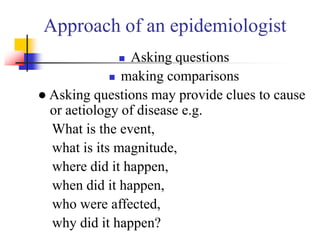
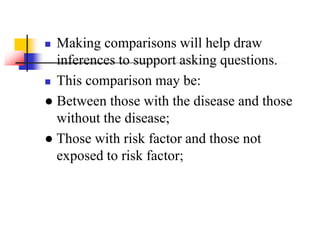
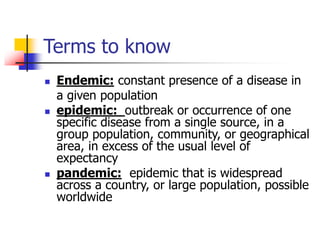
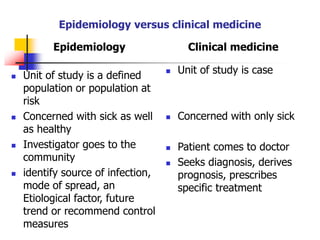
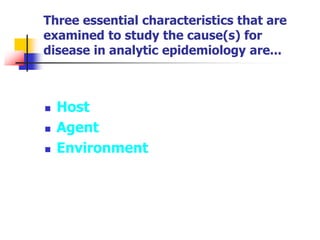
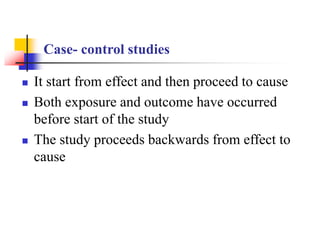
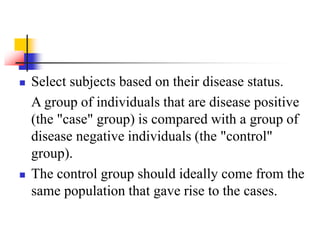
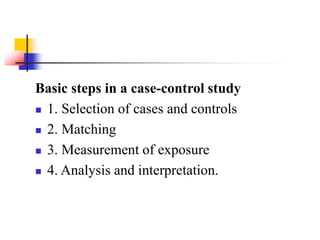
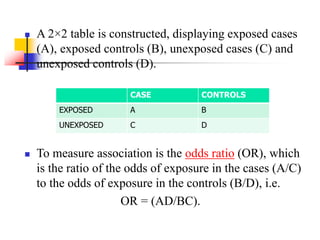
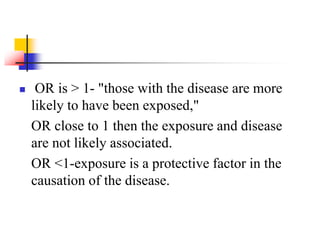
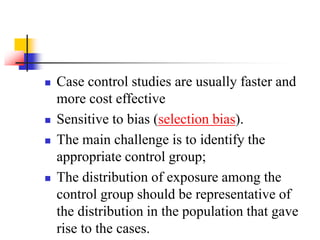
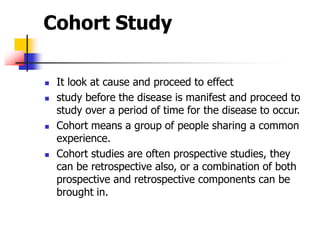
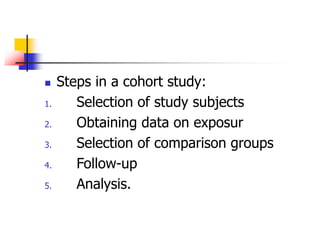
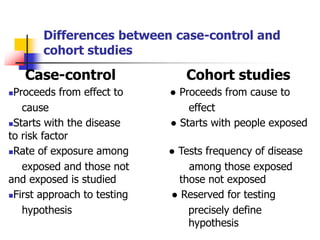
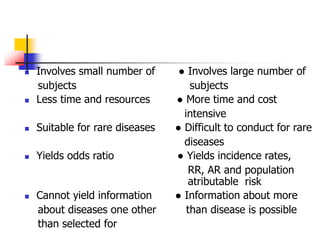
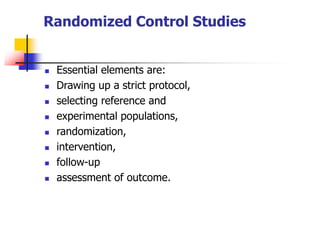
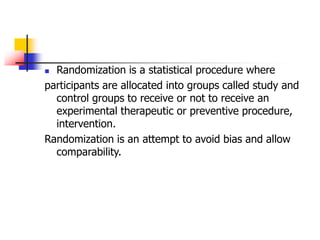
The objectives and purposes of epidemiology are then outlined, which include describing disease distribution and magnitude, identifying risk factors, providing data for prevention/control programs, and recommending interventions. Key epidemiological terms like incidence, prevalence, endemic, epidemic, and pandemic are also defined. Descriptive and analytical study designs commonly used in epidemiology like cross-sectional and case-control studies are described. The document concludes by contrasting the approaches of epidemiology versus clinical medicine