Download to read offline

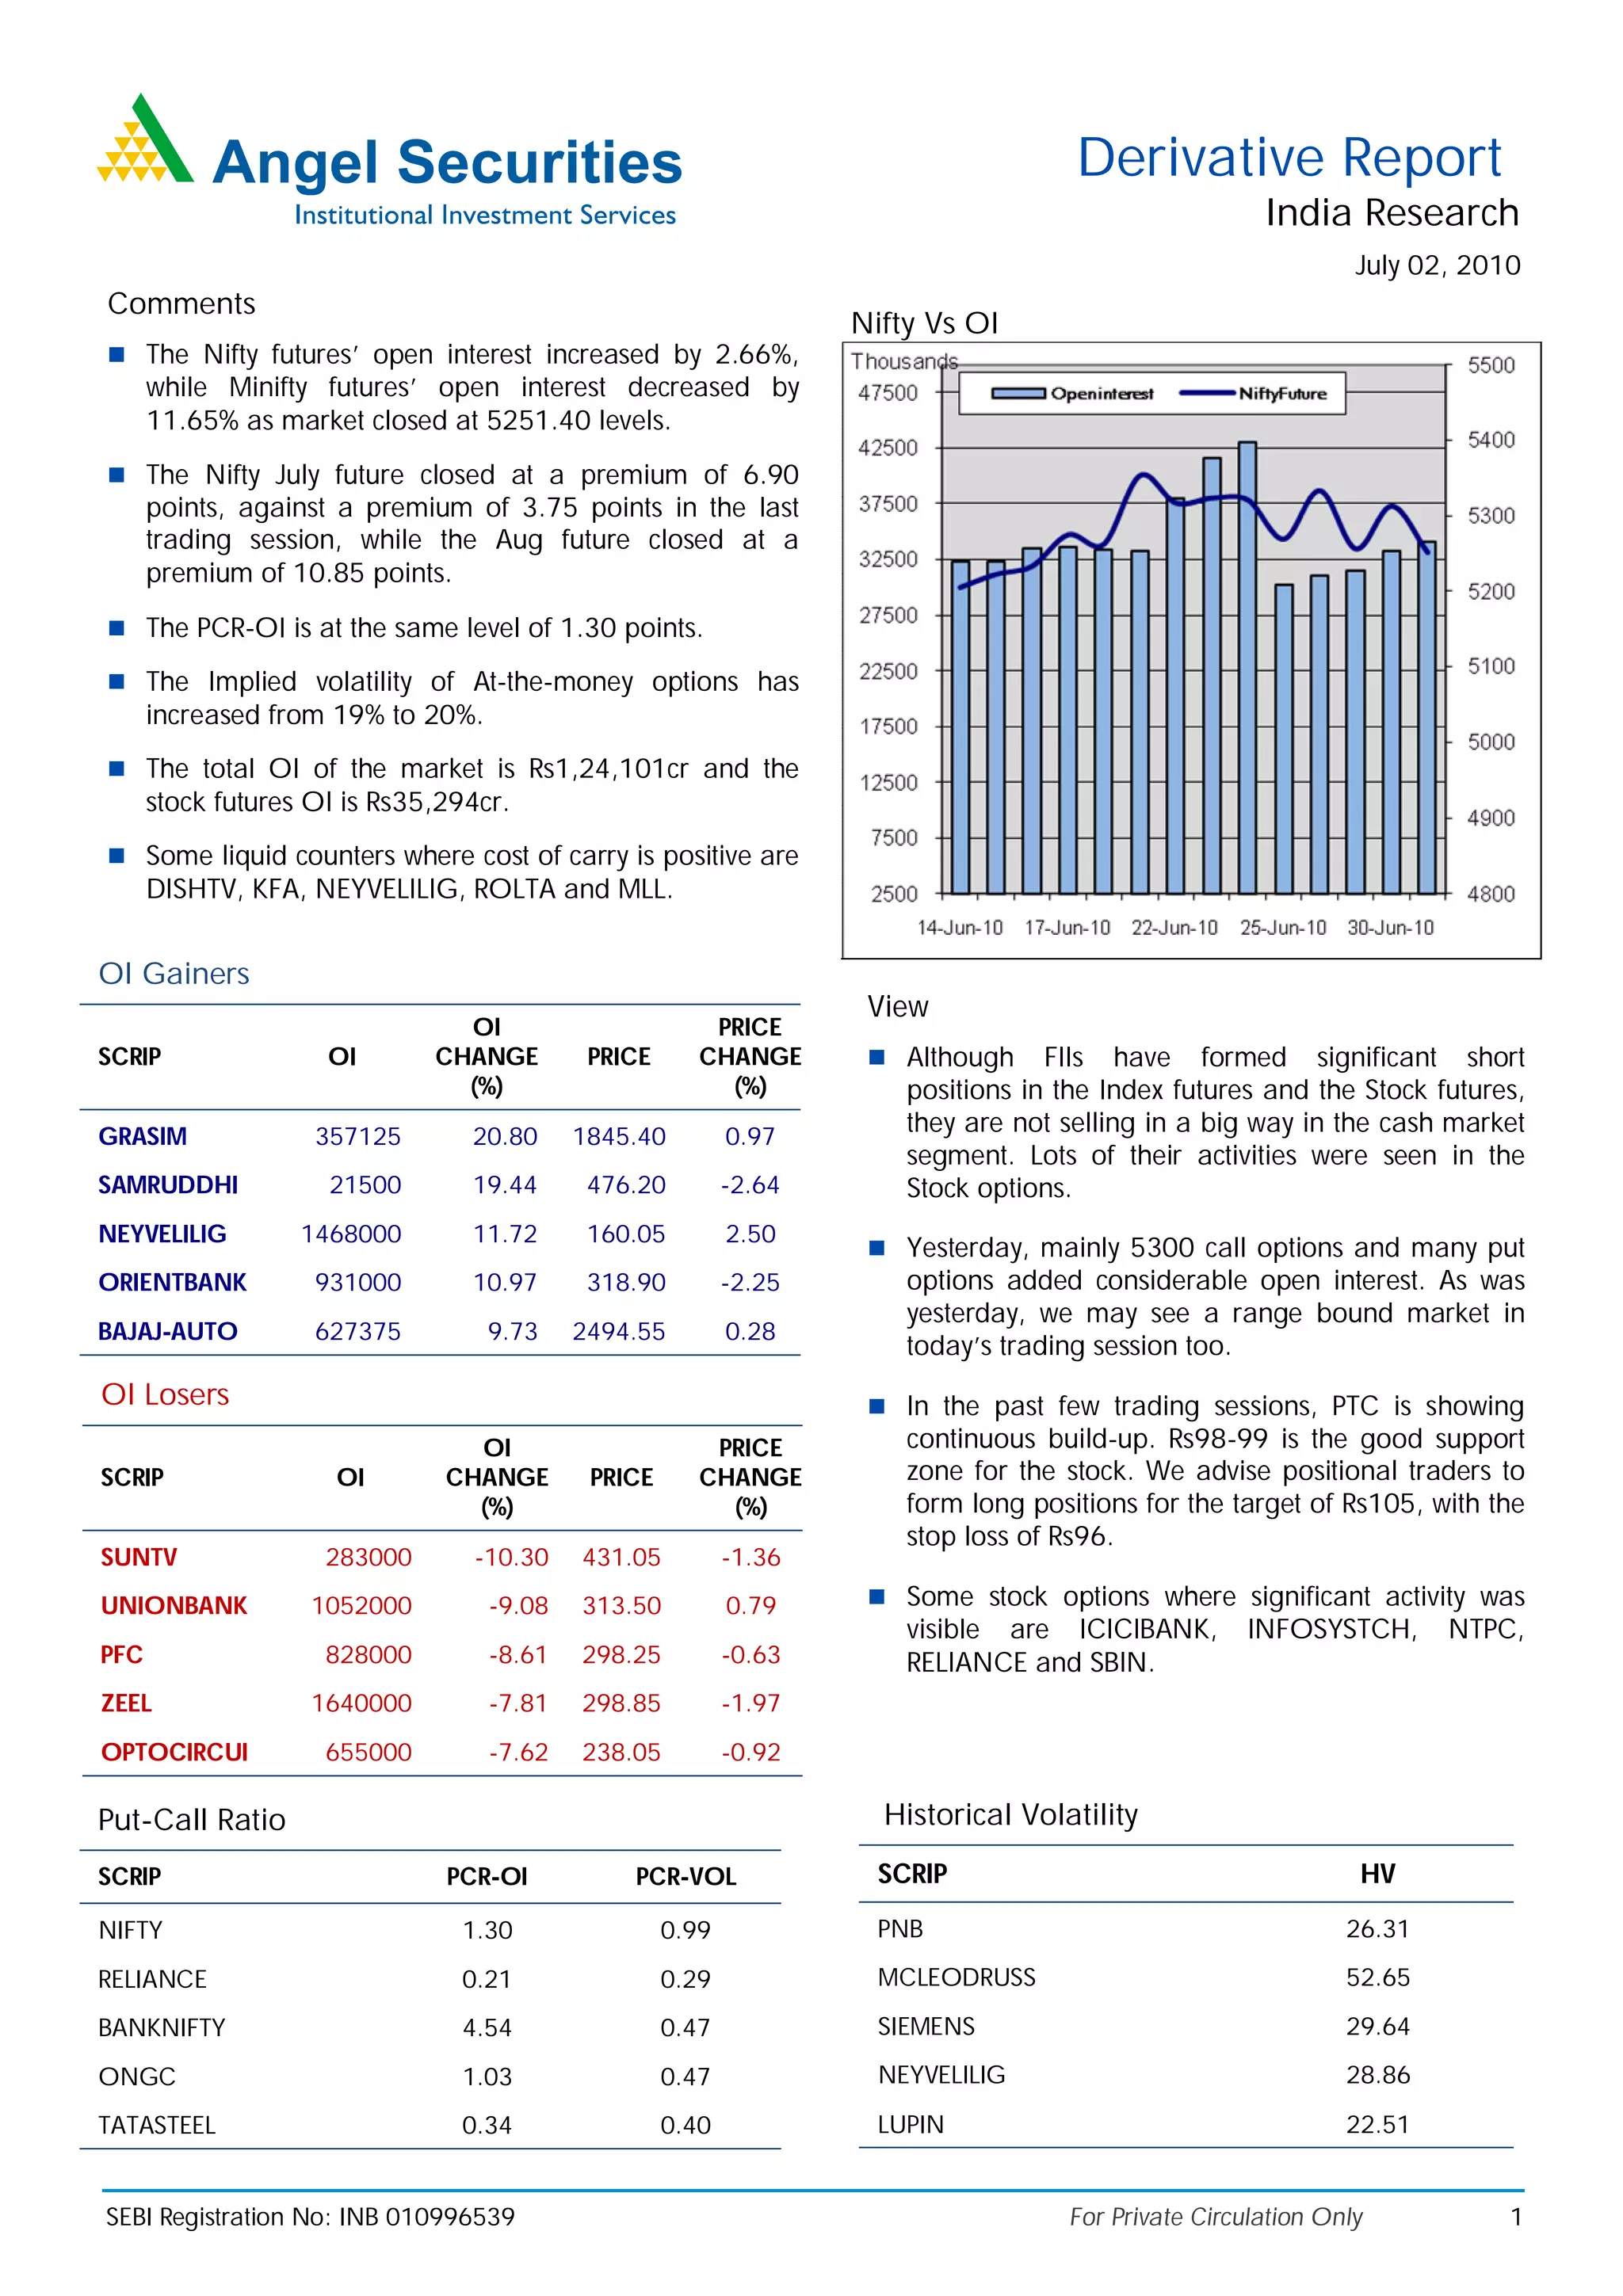

The document provides a summary of derivative market activity in India for July 02, 2010. Open interest in Nifty futures increased slightly while decreasing for Mini Nifty futures. The Nifty July future traded at a premium. Put-call ratios were stable and implied volatility increased. Several individual stocks saw increases or decreases in open interest.


