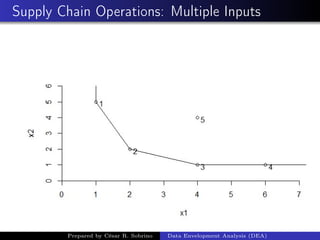
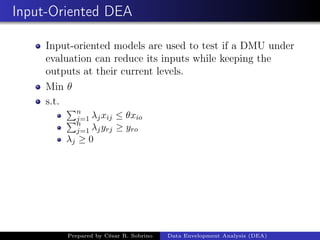
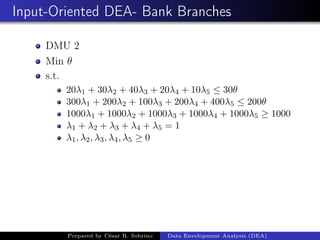
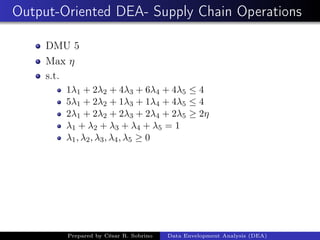
Data Envelopment Analysis (DEA)
Prepared by César R. Sobrino
Universidad del Turabo
November 3, 2018
Prepared by César R. Sobrino Data Envelopment Analysis (DEA)
Outline
1 Introduction
2 Assumptions
3 DEA Technique and Notation
4 Cases:
Five Bank Branches
Supply Chain Operations
Clothing Shops
5 Input-Oriented Models: Linear Programming
Formulation
6 Output-Oriented Models: Linear Programming
Formulation
7 CRS: Constant Returns to Scale
8 VRS: Variable Returns to Scale
Prepared by César R. Sobrino Data Envelopment Analysis (DEA)
Introduction
1 A benchmarking technique originally developed by
Charnes, Cooper and Rhodes (1978).
2 It is a non parametric technique
3 It is non-stochastic approach.
4 Used for comparing the performances of similar units
of an organization.
5 Units are called Decision-Making Units (DMU).
E.g. Compare all the McDonald’s outlets operating in
Pittsburgh to find out which outlet is not doing good
and then recommend some actions to perform better.
6 Applications in all industries including hospitals,
banks, universities, etc..
Prepared by César R. Sobrino Data Envelopment Analysis (DEA)
DEA Assumptions
1 Orientation: Input-based or Output-based Analysis
2 Frontier Search: Piece-wise Linear Method.
3 CRS: Constant Returns to Scale.
4 VRS: Variable Returns to Scale
5 No assumption about Input-Output Function
6 No limits to the number of inputs and outputs
7 Not required to weight restrictions
Prepared by César R. Sobrino Data Envelopment Analysis (DEA)
DEA technique
1 Use multiple inputs and multiple outputs
2 DEA calculates the efficiencies of all DMUs by taking
a set of input and output variables and then set a
benchmark. .
3 A(relative efficiency) piece -wise linear frontier is built
by enveloping all the observed input-output vectors.
4 Efficiency of each DMU is measured by the distance of
its input-vectors to the frontier.
5 Linear programming (LP) used to construct a non
parametric piece-wise surface over the data.
6 Need to solve one LP for each DMU involved.
7 TE = distance each DMU is below the surface.
8 Unknown relationships between inputs and outputs.
Prepared by César R. Sobrino Data Envelopment Analysis (DEA)
DEA Notation
1 (X,Y ) Input, Output Matrix
2 u, v : Output and Inputs weights, respectively (row
vector).
3 λ = (λ1, λ2, .., λn)T
Non - negativity vector.
4 θ, η : Efficiency rates (real variables)
Prepared by César R. Sobrino Data Envelopment Analysis (DEA)
Efficiencies
1 Technical efficiency (TE) is the effectiveness with
which a given set of inputs is used to produce an
output. A firm is said to be technically efficient if a
firm is producing the maximum output from the
minimum quantity of inputs, such as labour, capital,
and technology.
2 A unit is scale efficient (SE) when its size of
operations is optimal so that any modifications on its
size will render the unit less efficient.
Prepared by César R. Sobrino Data Envelopment Analysis (DEA)
One Input - One Output Example
DMU Sales (Y ) # Workers (X) (Y /X) Relative
Efficiency
DUM1 $1,391,280 1,870 744 0.5952
DUM2 1,329,848 1,346 988 0.7904
DUM3 1,079,680 1,120 964 0.7712
DUM4 1,400,000 1,120 1,250 1
The most important advantage of DEA is that it can
handle the multiple input and output variables which
are generally not comparable to each other.
Prepared by César R. Sobrino Data Envelopment Analysis (DEA)
Five Bank Branches: Multiple Inputs
Service Y1 X1 X2
Unit
Bank 1 1000 20 $300
Bank 2 1000 30 200
Bank 3 1000 40 100
Bank 4 1000 20 200
Bank 5 1000 10 400
Y1: Transactions
X1: Teller hours
X2: Supply dollars
Prepared by César R. Sobrino Data Envelopment Analysis (DEA)
Five Bank Branches: Multiple Inputs
Prepared by César R. Sobrino Data Envelopment Analysis (DEA)
Supply Chain Operations: Multiple Inputs
DMU X1 X2 Y1
DMU1 1 5 2
DMU2 2 2 2
DUM3 4 1 2
DUM4 6 1 2
DUM5 4 4 2
Y1: Profit (in thousands dollars)
X1: Cost (in hundred dollars)
X2: Supply chain response time (days)
Prepared by César R. Sobrino Data Envelopment Analysis (DEA)
Supply Chain Operations: Multiple Inputs
Prepared by César R. Sobrino Data Envelopment Analysis (DEA)
Clothing Shops: Multiple Outputs and Inputs
Store X1 X2 Y1 Y2
Location
Pittsburgh 51 38 169 119
Philadelphia 60 45 243 167
Harrisburg 43 33 173 158
Columbus 53 43 216 138
Cleveland 43 38 155 161
Baltimore 44 35 169 157
Y1: Dresses sold per week
Y2: Accessories sold per week
X1: Number of employees.
X2: Management in weeks
Prepared by César R. Sobrino Data Envelopment Analysis (DEA)
Input-Oriented DEA
Input-oriented models are used to test if a DMU under
evaluation can reduce its inputs while keeping the
outputs at their current levels.
Min θ
s.t.
n
j=1 λjxij ≤ θxio
n
j=1 λjyrj ≥ yro
λj ≥ 0
Prepared by César R. Sobrino Data Envelopment Analysis (DEA)
Input-Oriented DEA- Bank Branches
DMU 2
Min θ
s.t.
20λ1 + 30λ2 + 40λ3 + 20λ4 + 10λ5 ≤ 30θ
300λ1 + 200λ2 + 100λ3 + 200λ4 + 400λ5 ≤ 200θ
1000λ1 + 1000λ2 + 1000λ3 + 1000λ4 + 1000λ5 ≥ 1000
λ1 + λ2 + λ3 + λ4 + λ5 = 1
λ1, λ2, λ3, λ4, λ5 ≥ 0
Prepared by César R. Sobrino Data Envelopment Analysis (DEA)
Input-Oriented DEA- Supply Chain Operations
DMU 5
Min θ
s.t.
1λ1 + 2λ2 + 4λ3 + 6λ4 + 4λ5 ≤ 4θ
5λ1 + 2λ2 + 1λ3 + 1λ4 + 4λ5 ≤ 4θ
2λ1 + 2λ2 + 2λ3 + 2λ4 + 2λ5 ≥ 2
λ1 + λ2 + λ3 + λ4 + λ5 = 1
λ1, λ2, λ3, λ4, λ5 ≥ 0
Prepared by César R. Sobrino Data Envelopment Analysis (DEA)
Input-Oriented DEA- Clothing Shops
Pittsburgh (DMU1)
Min θ
s.t.
51λ1 + 60λ2 + 43λ3 + 53λ4 + 43λ5 + 44λ6 ≤ 51θ
38λ1 + 45λ2 + 33λ3 + 43λ4 + 38λ5 + 35λ6 ≤ 38θ
169λ1 + 243λ2 + 173λ3 + 216λ4 + 155λ5 + 169λ6 ≥ 169
119λ1 + 167λ2 + 158λ3 + 138λ4 + 161λ5 + 157λ6 ≥ 119
λ1 + λ2 + λ3 + λ4 + λ5 + λ6 = 1
λ1, λ2, λ3, λ4, λ5, λ6 ≥ 0
Prepared by César R. Sobrino Data Envelopment Analysis (DEA)
Output-Oriented DEA
Output-oriented models are used to test if a DMU
under evaluation can increase its outputs while keeping
the inputs at their current levels.
Max η
s.t.
n
j=1 λjxij ≤ xio
n
j=1 λjyrj ≥ ηyro
λj ≥ 0
Prepared by César R. Sobrino Data Envelopment Analysis (DEA)
Output-Oriented DEA- Bank Branches
DMU 2
Max η
s.t.
20λ1 + 30λ2 + 40λ3 + 20λ4 + 10λ5 ≤ 30
300λ1 + 200λ2 + 100λ3 + 200λ4 + 400λ5 ≤ 200
1000λ1 + 1000λ2 + 1000λ3 + 1000λ4 + 1000λ5 ≥ 1000η
λ1 + λ2 + λ3 + λ4 + λ5 = 1
λ1, λ2, λ3, λ4, λ5 ≥ 0
Prepared by César R. Sobrino Data Envelopment Analysis (DEA)
Output-Oriented DEA- Supply Chain Operations
DMU 5
Max η
s.t.
1λ1 + 2λ2 + 4λ3 + 6λ4 + 4λ5 ≤ 4
5λ1 + 2λ2 + 1λ3 + 1λ4 + 4λ5 ≤ 4
2λ1 + 2λ2 + 2λ3 + 2λ4 + 2λ5 ≥ 2η
λ1 + λ2 + λ3 + λ4 + λ5 = 1
λ1, λ2, λ3, λ4, λ5 ≥ 0
Prepared by César R. Sobrino Data Envelopment Analysis (DEA)
Output-Oriented DEA- Clothing Shops
Pittsburgh (DMU1)
Max η
s.t.
51λ1 + 60λ2 + 43λ3 + 53λ4 + 43λ5 + 44λ6 ≤ 51
38λ1 + 45λ2 + 33λ3 + 43λ4 + 38λ5 + 35λ6 ≤ 38
169λ1 +243λ2 +173λ3 +216λ4 +155λ5 +169λ6 ≥ 169η
119λ1 +167λ2 +158λ3 +138λ4 +161λ5 +157λ6 ≥ 119η
λ1 + λ2 + λ3 + λ4 + λ5 + λ6 = 1
λ1, λ2, λ3, λ4, λ5, λ6 ≥ 0
Prepared by César R. Sobrino Data Envelopment Analysis (DEA)
CRS: Constant Returns to Scale
Appropiate when all DMUs are operating at an
optimal scale.
The minimum efficient scale is defined as the lowest
production point at which long-run total average costs
are minimized.
The more efficient DMUs to be the reference of other
DMUs with very different characteristics compared to
the production scale.
Problem: No all DMUs are scale efficient.
Prepared by César R. Sobrino Data Envelopment Analysis (DEA)
VRS: Variable Returns to Scale
Banker, Charnes & Cooper(1984) propose VRS.
It permits the calculation of TE devoid those SE
effects.
Build a more flexible frontier, adapted to the different
scales of production of each DMU, which identifies its
inefficiency.
SE can be calculated by estimating both CRS and
VRS models and looking at the differences in scores.
Prepared by César R. Sobrino Data Envelopment Analysis (DEA)
CRS vs. VRS
Prepared by César R. Sobrino Data Envelopment Analysis (DEA)
References
Farrell M. J. (1957), The measurement of productive
efficiency. J. Roy. Statist. Soc. Set. A, III, 253-290.
Charnes, A., W.W. Cooper and E. Rhodes (1978).
Measuring the efficiency of decisionmaking units.
European Journal of Operational Research, 2, 429-444.
Banker, A. Charnes, W. , and, W. Cooper (1984) Some
Models for Estimating Technical and Scale
Inefficiencies in Data Envelopment Analysis,
Management Science, Vol. 30, No. 9, 1078-1092
Prepared by César R. Sobrino Data Envelopment Analysis (DEA)

Data Envelopment Analysis

  • 1.
    Data Envelopment Analysis(DEA) Prepared by César R. Sobrino Universidad del Turabo November 3, 2018 Prepared by César R. Sobrino Data Envelopment Analysis (DEA)
  • 2.
    Outline 1 Introduction 2 Assumptions 3DEA Technique and Notation 4 Cases: Five Bank Branches Supply Chain Operations Clothing Shops 5 Input-Oriented Models: Linear Programming Formulation 6 Output-Oriented Models: Linear Programming Formulation 7 CRS: Constant Returns to Scale 8 VRS: Variable Returns to Scale Prepared by César R. Sobrino Data Envelopment Analysis (DEA)
  • 3.
    Introduction 1 A benchmarkingtechnique originally developed by Charnes, Cooper and Rhodes (1978). 2 It is a non parametric technique 3 It is non-stochastic approach. 4 Used for comparing the performances of similar units of an organization. 5 Units are called Decision-Making Units (DMU). E.g. Compare all the McDonald’s outlets operating in Pittsburgh to find out which outlet is not doing good and then recommend some actions to perform better. 6 Applications in all industries including hospitals, banks, universities, etc.. Prepared by César R. Sobrino Data Envelopment Analysis (DEA)
  • 4.
    DEA Assumptions 1 Orientation:Input-based or Output-based Analysis 2 Frontier Search: Piece-wise Linear Method. 3 CRS: Constant Returns to Scale. 4 VRS: Variable Returns to Scale 5 No assumption about Input-Output Function 6 No limits to the number of inputs and outputs 7 Not required to weight restrictions Prepared by César R. Sobrino Data Envelopment Analysis (DEA)
  • 5.
    DEA technique 1 Usemultiple inputs and multiple outputs 2 DEA calculates the efficiencies of all DMUs by taking a set of input and output variables and then set a benchmark. . 3 A(relative efficiency) piece -wise linear frontier is built by enveloping all the observed input-output vectors. 4 Efficiency of each DMU is measured by the distance of its input-vectors to the frontier. 5 Linear programming (LP) used to construct a non parametric piece-wise surface over the data. 6 Need to solve one LP for each DMU involved. 7 TE = distance each DMU is below the surface. 8 Unknown relationships between inputs and outputs. Prepared by César R. Sobrino Data Envelopment Analysis (DEA)
  • 6.
    DEA Notation 1 (X,Y) Input, Output Matrix 2 u, v : Output and Inputs weights, respectively (row vector). 3 λ = (λ1, λ2, .., λn)T Non - negativity vector. 4 θ, η : Efficiency rates (real variables) Prepared by César R. Sobrino Data Envelopment Analysis (DEA)
  • 7.
    Efficiencies 1 Technical efficiency(TE) is the effectiveness with which a given set of inputs is used to produce an output. A firm is said to be technically efficient if a firm is producing the maximum output from the minimum quantity of inputs, such as labour, capital, and technology. 2 A unit is scale efficient (SE) when its size of operations is optimal so that any modifications on its size will render the unit less efficient. Prepared by César R. Sobrino Data Envelopment Analysis (DEA)
  • 8.
    One Input -One Output Example DMU Sales (Y ) # Workers (X) (Y /X) Relative Efficiency DUM1 $1,391,280 1,870 744 0.5952 DUM2 1,329,848 1,346 988 0.7904 DUM3 1,079,680 1,120 964 0.7712 DUM4 1,400,000 1,120 1,250 1 The most important advantage of DEA is that it can handle the multiple input and output variables which are generally not comparable to each other. Prepared by César R. Sobrino Data Envelopment Analysis (DEA)
  • 9.
    Five Bank Branches:Multiple Inputs Service Y1 X1 X2 Unit Bank 1 1000 20 $300 Bank 2 1000 30 200 Bank 3 1000 40 100 Bank 4 1000 20 200 Bank 5 1000 10 400 Y1: Transactions X1: Teller hours X2: Supply dollars Prepared by César R. Sobrino Data Envelopment Analysis (DEA)
  • 10.
    Five Bank Branches:Multiple Inputs Prepared by César R. Sobrino Data Envelopment Analysis (DEA)
  • 11.
    Supply Chain Operations:Multiple Inputs DMU X1 X2 Y1 DMU1 1 5 2 DMU2 2 2 2 DUM3 4 1 2 DUM4 6 1 2 DUM5 4 4 2 Y1: Profit (in thousands dollars) X1: Cost (in hundred dollars) X2: Supply chain response time (days) Prepared by César R. Sobrino Data Envelopment Analysis (DEA)
  • 12.
    Supply Chain Operations:Multiple Inputs Prepared by César R. Sobrino Data Envelopment Analysis (DEA)
  • 13.
    Clothing Shops: MultipleOutputs and Inputs Store X1 X2 Y1 Y2 Location Pittsburgh 51 38 169 119 Philadelphia 60 45 243 167 Harrisburg 43 33 173 158 Columbus 53 43 216 138 Cleveland 43 38 155 161 Baltimore 44 35 169 157 Y1: Dresses sold per week Y2: Accessories sold per week X1: Number of employees. X2: Management in weeks Prepared by César R. Sobrino Data Envelopment Analysis (DEA)
  • 14.
    Input-Oriented DEA Input-oriented modelsare used to test if a DMU under evaluation can reduce its inputs while keeping the outputs at their current levels. Min θ s.t. n j=1 λjxij ≤ θxio n j=1 λjyrj ≥ yro λj ≥ 0 Prepared by César R. Sobrino Data Envelopment Analysis (DEA)
  • 15.
    Input-Oriented DEA- BankBranches DMU 2 Min θ s.t. 20λ1 + 30λ2 + 40λ3 + 20λ4 + 10λ5 ≤ 30θ 300λ1 + 200λ2 + 100λ3 + 200λ4 + 400λ5 ≤ 200θ 1000λ1 + 1000λ2 + 1000λ3 + 1000λ4 + 1000λ5 ≥ 1000 λ1 + λ2 + λ3 + λ4 + λ5 = 1 λ1, λ2, λ3, λ4, λ5 ≥ 0 Prepared by César R. Sobrino Data Envelopment Analysis (DEA)
  • 16.
    Input-Oriented DEA- SupplyChain Operations DMU 5 Min θ s.t. 1λ1 + 2λ2 + 4λ3 + 6λ4 + 4λ5 ≤ 4θ 5λ1 + 2λ2 + 1λ3 + 1λ4 + 4λ5 ≤ 4θ 2λ1 + 2λ2 + 2λ3 + 2λ4 + 2λ5 ≥ 2 λ1 + λ2 + λ3 + λ4 + λ5 = 1 λ1, λ2, λ3, λ4, λ5 ≥ 0 Prepared by César R. Sobrino Data Envelopment Analysis (DEA)
  • 17.
    Input-Oriented DEA- ClothingShops Pittsburgh (DMU1) Min θ s.t. 51λ1 + 60λ2 + 43λ3 + 53λ4 + 43λ5 + 44λ6 ≤ 51θ 38λ1 + 45λ2 + 33λ3 + 43λ4 + 38λ5 + 35λ6 ≤ 38θ 169λ1 + 243λ2 + 173λ3 + 216λ4 + 155λ5 + 169λ6 ≥ 169 119λ1 + 167λ2 + 158λ3 + 138λ4 + 161λ5 + 157λ6 ≥ 119 λ1 + λ2 + λ3 + λ4 + λ5 + λ6 = 1 λ1, λ2, λ3, λ4, λ5, λ6 ≥ 0 Prepared by César R. Sobrino Data Envelopment Analysis (DEA)
  • 18.
    Output-Oriented DEA Output-oriented modelsare used to test if a DMU under evaluation can increase its outputs while keeping the inputs at their current levels. Max η s.t. n j=1 λjxij ≤ xio n j=1 λjyrj ≥ ηyro λj ≥ 0 Prepared by César R. Sobrino Data Envelopment Analysis (DEA)
  • 19.
    Output-Oriented DEA- BankBranches DMU 2 Max η s.t. 20λ1 + 30λ2 + 40λ3 + 20λ4 + 10λ5 ≤ 30 300λ1 + 200λ2 + 100λ3 + 200λ4 + 400λ5 ≤ 200 1000λ1 + 1000λ2 + 1000λ3 + 1000λ4 + 1000λ5 ≥ 1000η λ1 + λ2 + λ3 + λ4 + λ5 = 1 λ1, λ2, λ3, λ4, λ5 ≥ 0 Prepared by César R. Sobrino Data Envelopment Analysis (DEA)
  • 20.
    Output-Oriented DEA- SupplyChain Operations DMU 5 Max η s.t. 1λ1 + 2λ2 + 4λ3 + 6λ4 + 4λ5 ≤ 4 5λ1 + 2λ2 + 1λ3 + 1λ4 + 4λ5 ≤ 4 2λ1 + 2λ2 + 2λ3 + 2λ4 + 2λ5 ≥ 2η λ1 + λ2 + λ3 + λ4 + λ5 = 1 λ1, λ2, λ3, λ4, λ5 ≥ 0 Prepared by César R. Sobrino Data Envelopment Analysis (DEA)
  • 21.
    Output-Oriented DEA- ClothingShops Pittsburgh (DMU1) Max η s.t. 51λ1 + 60λ2 + 43λ3 + 53λ4 + 43λ5 + 44λ6 ≤ 51 38λ1 + 45λ2 + 33λ3 + 43λ4 + 38λ5 + 35λ6 ≤ 38 169λ1 +243λ2 +173λ3 +216λ4 +155λ5 +169λ6 ≥ 169η 119λ1 +167λ2 +158λ3 +138λ4 +161λ5 +157λ6 ≥ 119η λ1 + λ2 + λ3 + λ4 + λ5 + λ6 = 1 λ1, λ2, λ3, λ4, λ5, λ6 ≥ 0 Prepared by César R. Sobrino Data Envelopment Analysis (DEA)
  • 22.
    CRS: Constant Returnsto Scale Appropiate when all DMUs are operating at an optimal scale. The minimum efficient scale is defined as the lowest production point at which long-run total average costs are minimized. The more efficient DMUs to be the reference of other DMUs with very different characteristics compared to the production scale. Problem: No all DMUs are scale efficient. Prepared by César R. Sobrino Data Envelopment Analysis (DEA)
  • 23.
    VRS: Variable Returnsto Scale Banker, Charnes & Cooper(1984) propose VRS. It permits the calculation of TE devoid those SE effects. Build a more flexible frontier, adapted to the different scales of production of each DMU, which identifies its inefficiency. SE can be calculated by estimating both CRS and VRS models and looking at the differences in scores. Prepared by César R. Sobrino Data Envelopment Analysis (DEA)
  • 24.
    CRS vs. VRS Preparedby César R. Sobrino Data Envelopment Analysis (DEA)
  • 25.
    References Farrell M. J.(1957), The measurement of productive efficiency. J. Roy. Statist. Soc. Set. A, III, 253-290. Charnes, A., W.W. Cooper and E. Rhodes (1978). Measuring the efficiency of decisionmaking units. European Journal of Operational Research, 2, 429-444. Banker, A. Charnes, W. , and, W. Cooper (1984) Some Models for Estimating Technical and Scale Inefficiencies in Data Envelopment Analysis, Management Science, Vol. 30, No. 9, 1078-1092 Prepared by César R. Sobrino Data Envelopment Analysis (DEA)