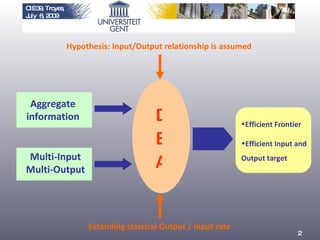
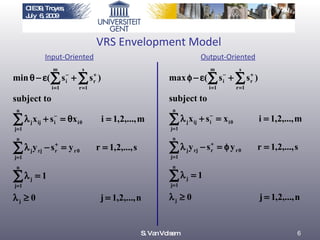
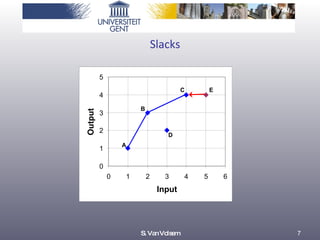
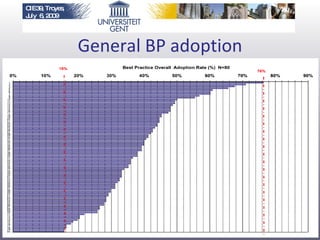
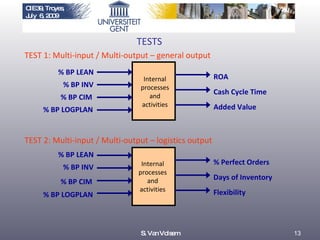
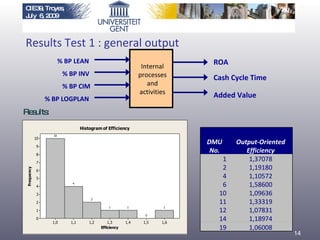
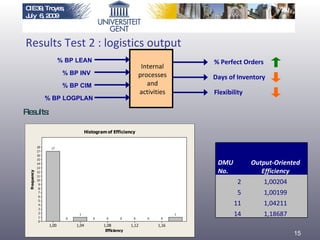
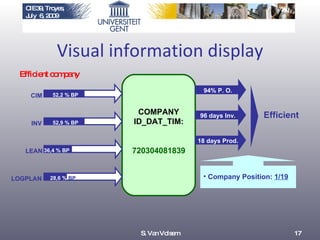
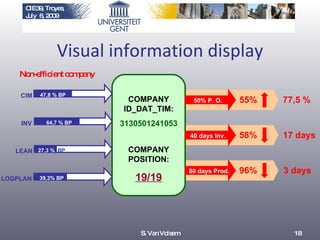
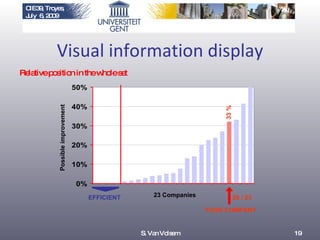
Using Data Envelopment Analysis  to benchmark logistic performance  in Belgian manufacturing companies   Sofie Van Volsem, Hendrik Van Landeghem Department of Industrial Management, Ghent University, Belgium  (sofie.vanvolsem@ugent.be)
Aggregate information Multi-Input Multi-Output DEA Efficient Frontier Efficient Input and Output target Extending classical Output / Input rate Hypothesis: Input/Output relationship is assumed
Identification  Best-Practice Frontier S. Van Volsem INEFFICIENT
Type of Frontier VRS: Variable Return to Scale. Removing the constraint With the constraint: ∑ λ j  = 1 With the constraint: ∑ λ j  ≤ 1 With the constraint: ∑ λ j  ≥ 1 NDRS: Non-Decreasing Return to Scale. CRS: Constant Return to Scale. NIRS: Non-Increasing Return to Scale. VRS: Variable Return to Scale CRS: Constant Return to Scale NIRS: Non-Increasing Return to Scale NDRS: Non-Decreasing Return to Scale CIE39, Troyes, 6-8 July 2009 S. Van Volsem
Input-oriented approach Output-oriented approach Two alternative approaches 1,5 D’ D’ 3,5 CIE39, Troyes, July  6, 2009
VRS Envelopment Model Input-Oriented Output-Oriented S. Van Volsem CIE39, Troyes, July  6, 2009
Slacks S. Van Volsem
Undesirable Measures Model Undesirable Outputs may be present: outputs we wish to decrease Internal processes and activities % BP LEAN % BP INV % BP CIM % BP LOGPLAN % Perfect Orders Days of Inventory Flexibility S. Van Volsem CIE39, Troyes, July  6, 2009 Days needed to increase productivity by 20%
Undesirable Measures Model Output-Oriented Model with Undesirables Measures:  and where Efficient target for DMU 0 CIE39, Troyes, July  6, 2009
DEA Models in  Spreadsheets Joe Zhu “ Quantitative Models for Performance Evaluation and Benchmarking” 2003 Excel Spreadsheets Solver Visual Basic + S. Van Volsem CIE39, Troyes, July  6, 2009
Benchmarking applied on logistics  Case 80 Belgium companies Best Practices Data General Best Practice rate Human Resources, Assets, Design, quality control, Inventory,… Best Practices related with logistics Logistic plan (LOGPLAN) Inventory (INV) Lean (LEAN) Monitorizaton (CIM) S. Van Volsem CIE39, Troyes, July  6, 2009
General BP adoption
Internal processes and activities % BP LEAN % BP INV % BP CIM % BP LOGPLAN ROA Cash Cycle Time Added Value TEST 1: Multi-input / Multi-output – general output  % BP LEAN % BP INV % BP CIM % BP LOGPLAN TEST 2: Multi-input / Multi-output – logistics output  TESTS % Perfect Orders Days of Inventory Flexibility Internal processes and activities S. Van Volsem CIE39, Troyes, July  6, 2009
Internal processes and activities % BP LEAN % BP INV % BP CIM % BP LOGPLAN Results Test 1 : general output Results: ROA Cash Cycle Time Added Value CIE39, Troyes, July  6, 2009 DMU No. Output-Oriented Efficiency 1 1,37078 2 1,19180 4 1,10572 6 1,58600 10 1,09636 11 1,33319 12 1,07831 14 1,18974 19 1,06008
% BP LEAN % BP INV % BP CIM % BP LOGPLAN % Perfect Orders Days of Inventory Flexibility Results Test 2 : logistics output Results: Internal processes and activities CIE39, Troyes, July  6, 2009   DMU No. Output-Oriented Efficiency 2 1,00204 5 1,00199 11 1,04211 14 1,18687
What can we offer to companies? A benchmarking tool Identification of Efficient Frontier Relative efficiency in the set of companies Visual information For this, we only need aggregate data => low information cost S. Van Volsem
Visual information display Efficient company 52,2 % BP CIM 52,9 % BP INV 36,4 % BP LEAN 28,6 %  BP LOGPLAN COMPANY ID_DAT_TIM: 720304081839 96 days Inv. Company Position:  1/19 18 days Prod. 94% P. O. Efficient S. Van Volsem
Visual information display Non-efficient company 47,8 % BP CIM 64,7 % BP INV 27,3 %  BP LEAN 39,3% BP LOGPLAN COMPANY ID_DAT_TIM: 3130501241053 40 days Inv. 17 days 80 days Prod. 3 days 50% P. O. 77,5 % 96% 58% 55% COMPANY POSITION: 19/19 S. Van Volsem
Visual information display Relative position in the whole set Possible  improvement 23 Companies EFFICIENT YOUR COMPANY 20 / 23 33 % S. Van Volsem
Conclusions: Data Envelopment Analysis as a benchmarking tool Identification of efficient companies and output efficient targets No information about how to improve internal performance to reach the efficiency Relationship Input-Output is assumed Quality of a DEA benchmarking does highly depend on the available data  Visual information display available S. Van Volsem

CIE39 Troyes

  • 1.
    Using Data EnvelopmentAnalysis to benchmark logistic performance in Belgian manufacturing companies   Sofie Van Volsem, Hendrik Van Landeghem Department of Industrial Management, Ghent University, Belgium (sofie.vanvolsem@ugent.be)
  • 2.
    Aggregate information Multi-InputMulti-Output DEA Efficient Frontier Efficient Input and Output target Extending classical Output / Input rate Hypothesis: Input/Output relationship is assumed
  • 3.
    Identification Best-PracticeFrontier S. Van Volsem INEFFICIENT
  • 4.
    Type of FrontierVRS: Variable Return to Scale. Removing the constraint With the constraint: ∑ λ j = 1 With the constraint: ∑ λ j ≤ 1 With the constraint: ∑ λ j ≥ 1 NDRS: Non-Decreasing Return to Scale. CRS: Constant Return to Scale. NIRS: Non-Increasing Return to Scale. VRS: Variable Return to Scale CRS: Constant Return to Scale NIRS: Non-Increasing Return to Scale NDRS: Non-Decreasing Return to Scale CIE39, Troyes, 6-8 July 2009 S. Van Volsem
  • 5.
    Input-oriented approach Output-orientedapproach Two alternative approaches 1,5 D’ D’ 3,5 CIE39, Troyes, July 6, 2009
  • 6.
    VRS Envelopment ModelInput-Oriented Output-Oriented S. Van Volsem CIE39, Troyes, July 6, 2009
  • 7.
  • 8.
    Undesirable Measures ModelUndesirable Outputs may be present: outputs we wish to decrease Internal processes and activities % BP LEAN % BP INV % BP CIM % BP LOGPLAN % Perfect Orders Days of Inventory Flexibility S. Van Volsem CIE39, Troyes, July 6, 2009 Days needed to increase productivity by 20%
  • 9.
    Undesirable Measures ModelOutput-Oriented Model with Undesirables Measures: and where Efficient target for DMU 0 CIE39, Troyes, July 6, 2009
  • 10.
    DEA Models in Spreadsheets Joe Zhu “ Quantitative Models for Performance Evaluation and Benchmarking” 2003 Excel Spreadsheets Solver Visual Basic + S. Van Volsem CIE39, Troyes, July 6, 2009
  • 11.
    Benchmarking applied onlogistics Case 80 Belgium companies Best Practices Data General Best Practice rate Human Resources, Assets, Design, quality control, Inventory,… Best Practices related with logistics Logistic plan (LOGPLAN) Inventory (INV) Lean (LEAN) Monitorizaton (CIM) S. Van Volsem CIE39, Troyes, July 6, 2009
  • 12.
  • 13.
    Internal processes andactivities % BP LEAN % BP INV % BP CIM % BP LOGPLAN ROA Cash Cycle Time Added Value TEST 1: Multi-input / Multi-output – general output % BP LEAN % BP INV % BP CIM % BP LOGPLAN TEST 2: Multi-input / Multi-output – logistics output TESTS % Perfect Orders Days of Inventory Flexibility Internal processes and activities S. Van Volsem CIE39, Troyes, July 6, 2009
  • 14.
    Internal processes andactivities % BP LEAN % BP INV % BP CIM % BP LOGPLAN Results Test 1 : general output Results: ROA Cash Cycle Time Added Value CIE39, Troyes, July 6, 2009 DMU No. Output-Oriented Efficiency 1 1,37078 2 1,19180 4 1,10572 6 1,58600 10 1,09636 11 1,33319 12 1,07831 14 1,18974 19 1,06008
  • 15.
    % BP LEAN% BP INV % BP CIM % BP LOGPLAN % Perfect Orders Days of Inventory Flexibility Results Test 2 : logistics output Results: Internal processes and activities CIE39, Troyes, July 6, 2009   DMU No. Output-Oriented Efficiency 2 1,00204 5 1,00199 11 1,04211 14 1,18687
  • 16.
    What can weoffer to companies? A benchmarking tool Identification of Efficient Frontier Relative efficiency in the set of companies Visual information For this, we only need aggregate data => low information cost S. Van Volsem
  • 17.
    Visual information displayEfficient company 52,2 % BP CIM 52,9 % BP INV 36,4 % BP LEAN 28,6 % BP LOGPLAN COMPANY ID_DAT_TIM: 720304081839 96 days Inv. Company Position: 1/19 18 days Prod. 94% P. O. Efficient S. Van Volsem
  • 18.
    Visual information displayNon-efficient company 47,8 % BP CIM 64,7 % BP INV 27,3 % BP LEAN 39,3% BP LOGPLAN COMPANY ID_DAT_TIM: 3130501241053 40 days Inv. 17 days 80 days Prod. 3 days 50% P. O. 77,5 % 96% 58% 55% COMPANY POSITION: 19/19 S. Van Volsem
  • 19.
    Visual information displayRelative position in the whole set Possible improvement 23 Companies EFFICIENT YOUR COMPANY 20 / 23 33 % S. Van Volsem
  • 20.
    Conclusions: Data EnvelopmentAnalysis as a benchmarking tool Identification of efficient companies and output efficient targets No information about how to improve internal performance to reach the efficiency Relationship Input-Output is assumed Quality of a DEA benchmarking does highly depend on the available data Visual information display available S. Van Volsem