Downloaded 49 times
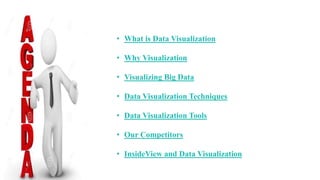
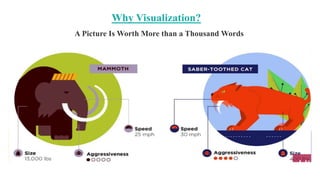
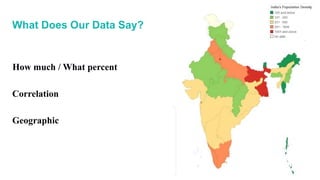
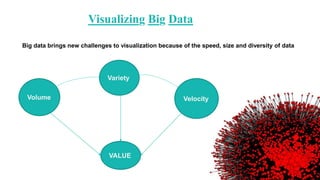
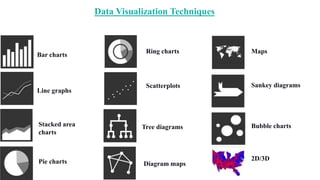
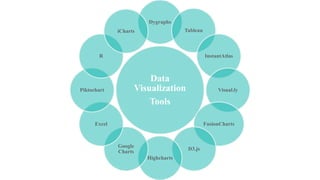


This document discusses data visualization, including why it is useful, techniques for visualizing big data, common data visualization techniques like bar charts and maps, tools for data visualization like Tableau and D3.js, and how InsideView uses data visualization. It notes that visualization is important because images can convey large amounts of information more easily than text, and that visualizing data allows people to see patterns, correlations, and geographic relationships in the data. Big data brings new challenges to visualization due to the speed, size, and diversity of large datasets.


![[DSC Europe 25] Laila Kakar - Leveraging AI for Strategic Excellence: Enhanci...](https://cdn.slidesharecdn.com/ss_thumbnails/eykmhrtsqmaaftwkexh7-dsc-lailakakar-1-260119101520-5f3b5616-thumbnail.jpg?width=640&height=640&fit=bounds)


![[DSC Europe 25] Josip Saban - Career building for data professionals.pptx](https://cdn.slidesharecdn.com/ss_thumbnails/zroflcttkm1vmli0txea-josip-saban-career-building-for-data-professionals-260123083019-587cdb8c-thumbnail.jpg?width=640&height=640&fit=bounds)


![[DSC Europe 25] Tamas Srancsik - How To Teach Your AI Football? An Argument f...](https://cdn.slidesharecdn.com/ss_thumbnails/bcjh1m9xtbosv20ucftb-tamas-srancsik-how-to-teach-your-ai-football-260121115910-08b53e9e-thumbnail.jpg?width=640&height=640&fit=bounds)
![[DSC Europe 25] Bojan Banjac - AI is always right when it comes to the matter...](https://cdn.slidesharecdn.com/ss_thumbnails/syoxtqierpydwxm5srcb-4-bojan-banjac-ai-is-always-right-when-it-comes-to-the-matters-of-taste-260119101519-694ee7d7-thumbnail.jpg?width=640&height=640&fit=bounds)


