Download as PDF, PPTX

![(Michael) -[:WORKS_ON]-> (Neo4j)
ME
Spring Cloud
Community
Cypher
console
community
graph
Server
3
Samstag, 31. August 13](https://image.slidesharecdn.com/webinardatamodelingnew-130830215355-phpapp02/75/Data-Modeling-with-Neo4j-3-2048.jpg)


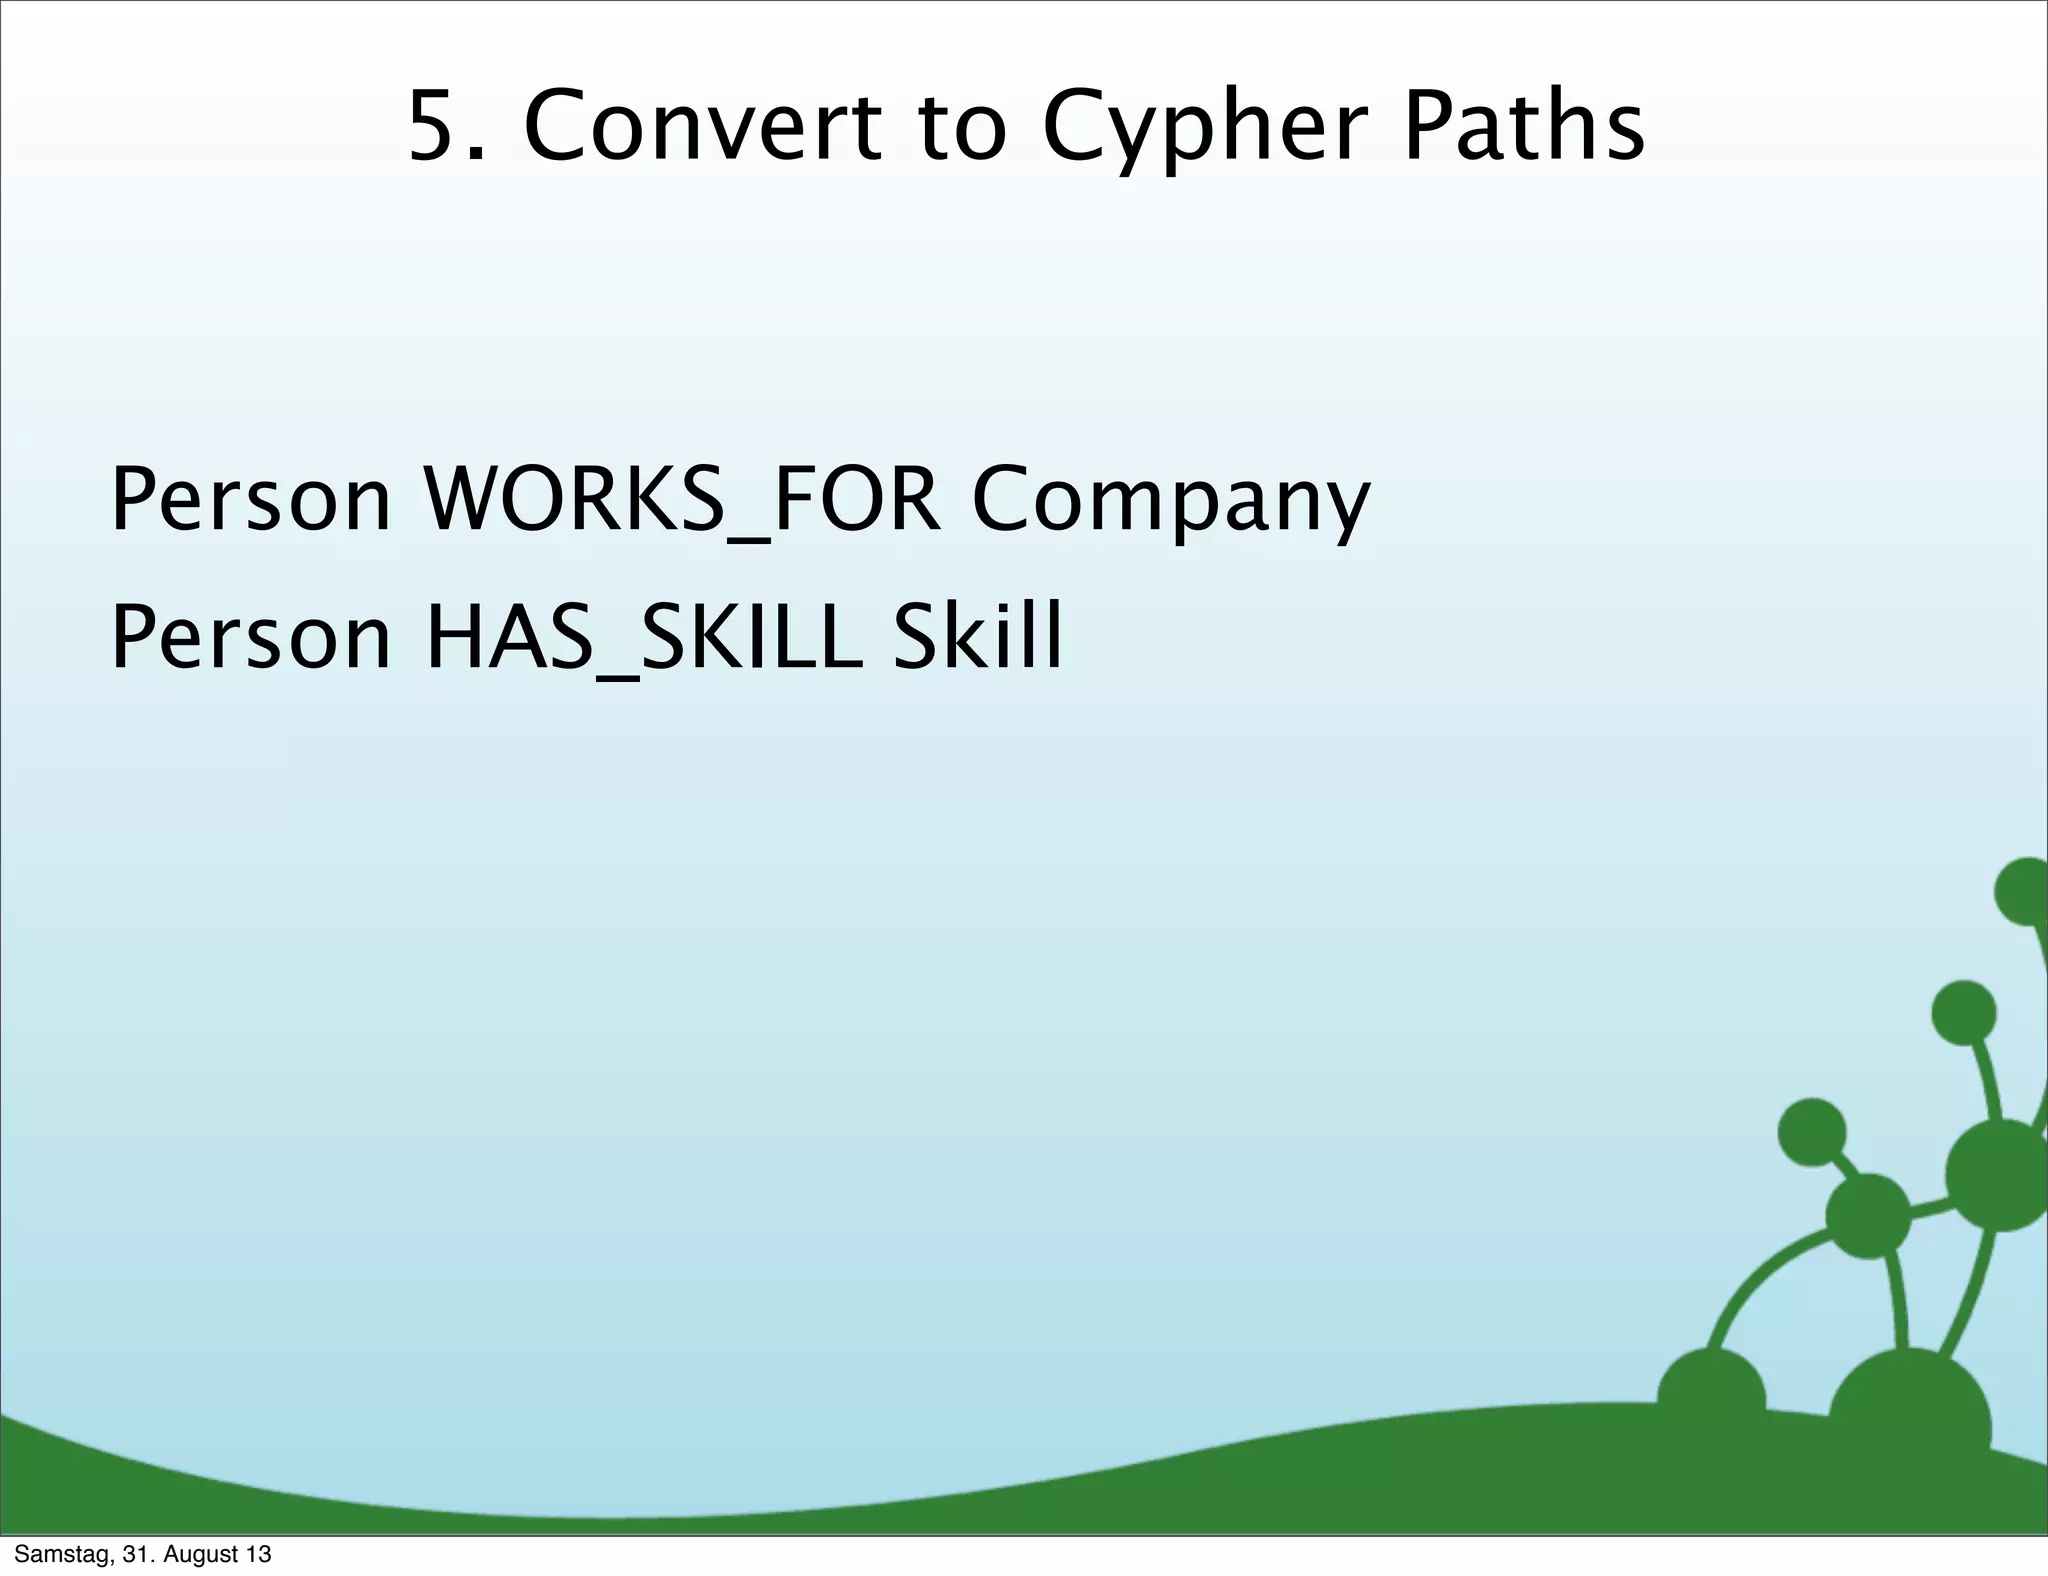
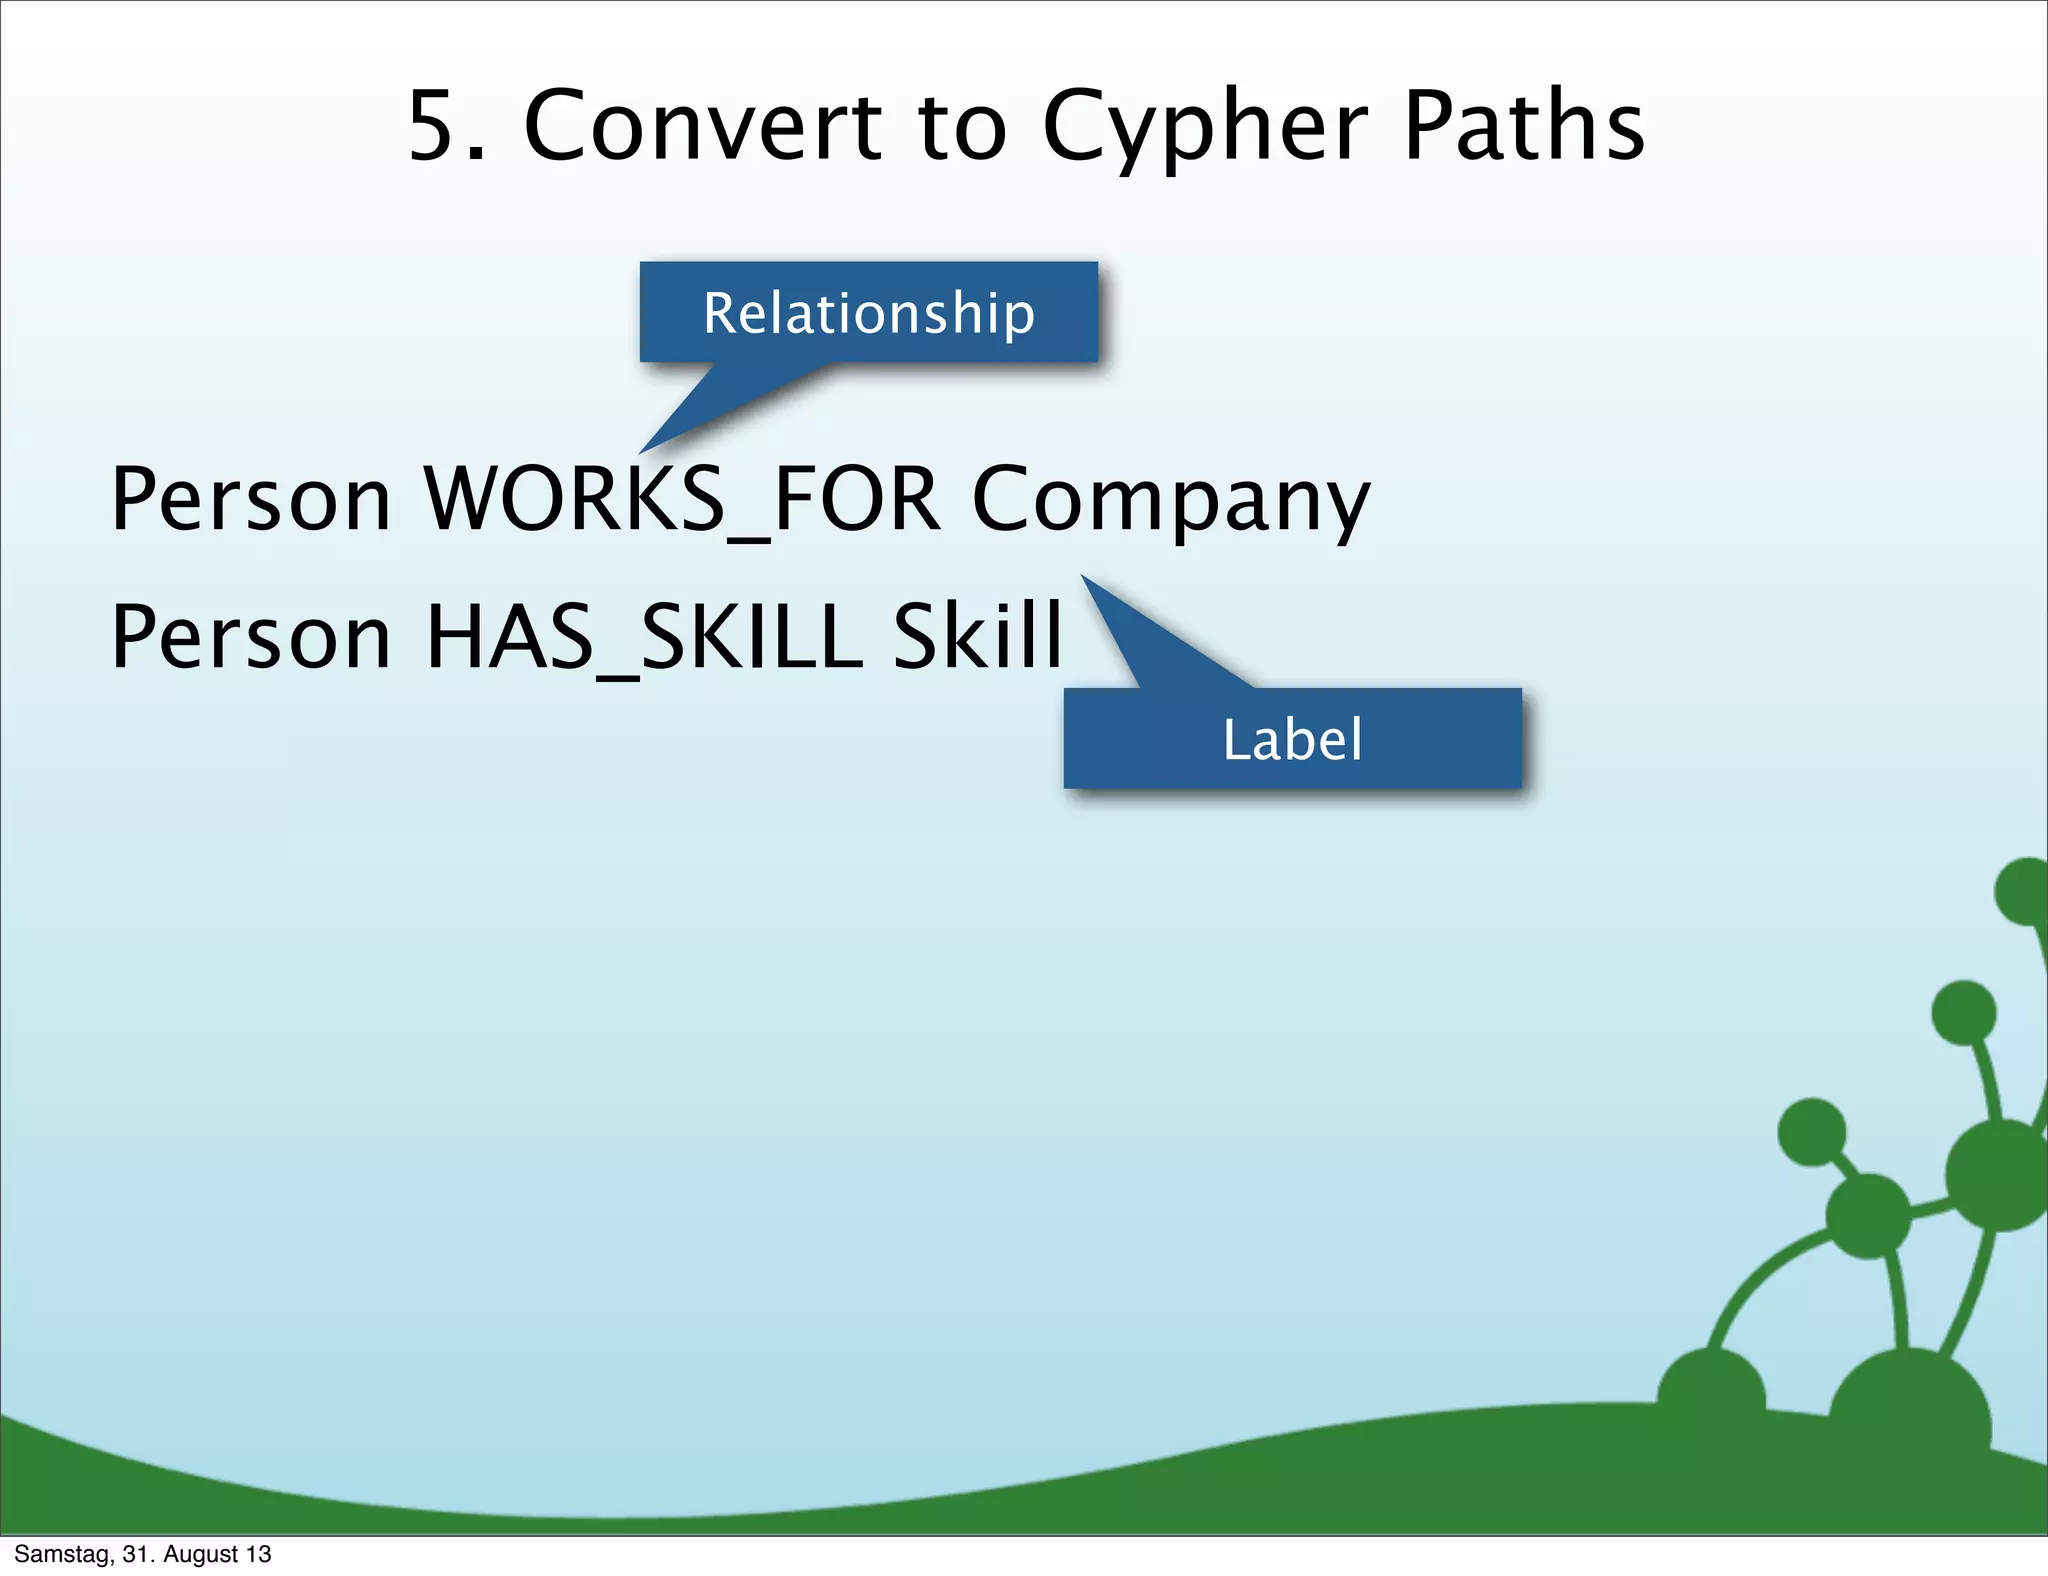
![5. Convert to Cypher Paths
Person WORKS_FOR Company
Person HAS_SKILL Skill
Relationship
Label
(:Person)-[:WORKS_FOR]->(:Company),
(:Person)-[:HAS_SKILL]->(:Skill)
Samstag, 31. August 13](https://image.slidesharecdn.com/webinardatamodelingnew-130830215355-phpapp02/75/Data-Modeling-with-Neo4j-62-2048.jpg)
![Consolidate Paths
(:Person)-[:WORKS_FOR]->(:Company),
(:Person)-[:HAS_SKILL]->(:Skill)
Samstag, 31. August 13](https://image.slidesharecdn.com/webinardatamodelingnew-130830215355-phpapp02/75/Data-Modeling-with-Neo4j-63-2048.jpg)
![Consolidate Paths
(:Person)-[:WORKS_FOR]->(:Company),
(:Person)-[:HAS_SKILL]->(:Skill)
(:Company)<-[:WORKS_FOR]-(:Person)-[:HAS_SKILL]->(:Skill)
Samstag, 31. August 13](https://image.slidesharecdn.com/webinardatamodelingnew-130830215355-phpapp02/75/Data-Modeling-with-Neo4j-64-2048.jpg)
![Consolidate Paths
(:Person)-[:WORKS_FOR]->(:Company),
(:Person)-[:HAS_SKILL]->(:Skill)
(:Company)<-[:WORKS_FOR]-(:Person)-[:HAS_SKILL]->(:Skill)
Samstag, 31. August 13](https://image.slidesharecdn.com/webinardatamodelingnew-130830215355-phpapp02/75/Data-Modeling-with-Neo4j-65-2048.jpg)
![Candidate Data Model
(:Company)<-[:WORKS_FOR]-(:Person)-[:HAS_SKILL]->(:Skill)
Samstag, 31. August 13](https://image.slidesharecdn.com/webinardatamodelingnew-130830215355-phpapp02/75/Data-Modeling-with-Neo4j-66-2048.jpg)
![Cypher Query
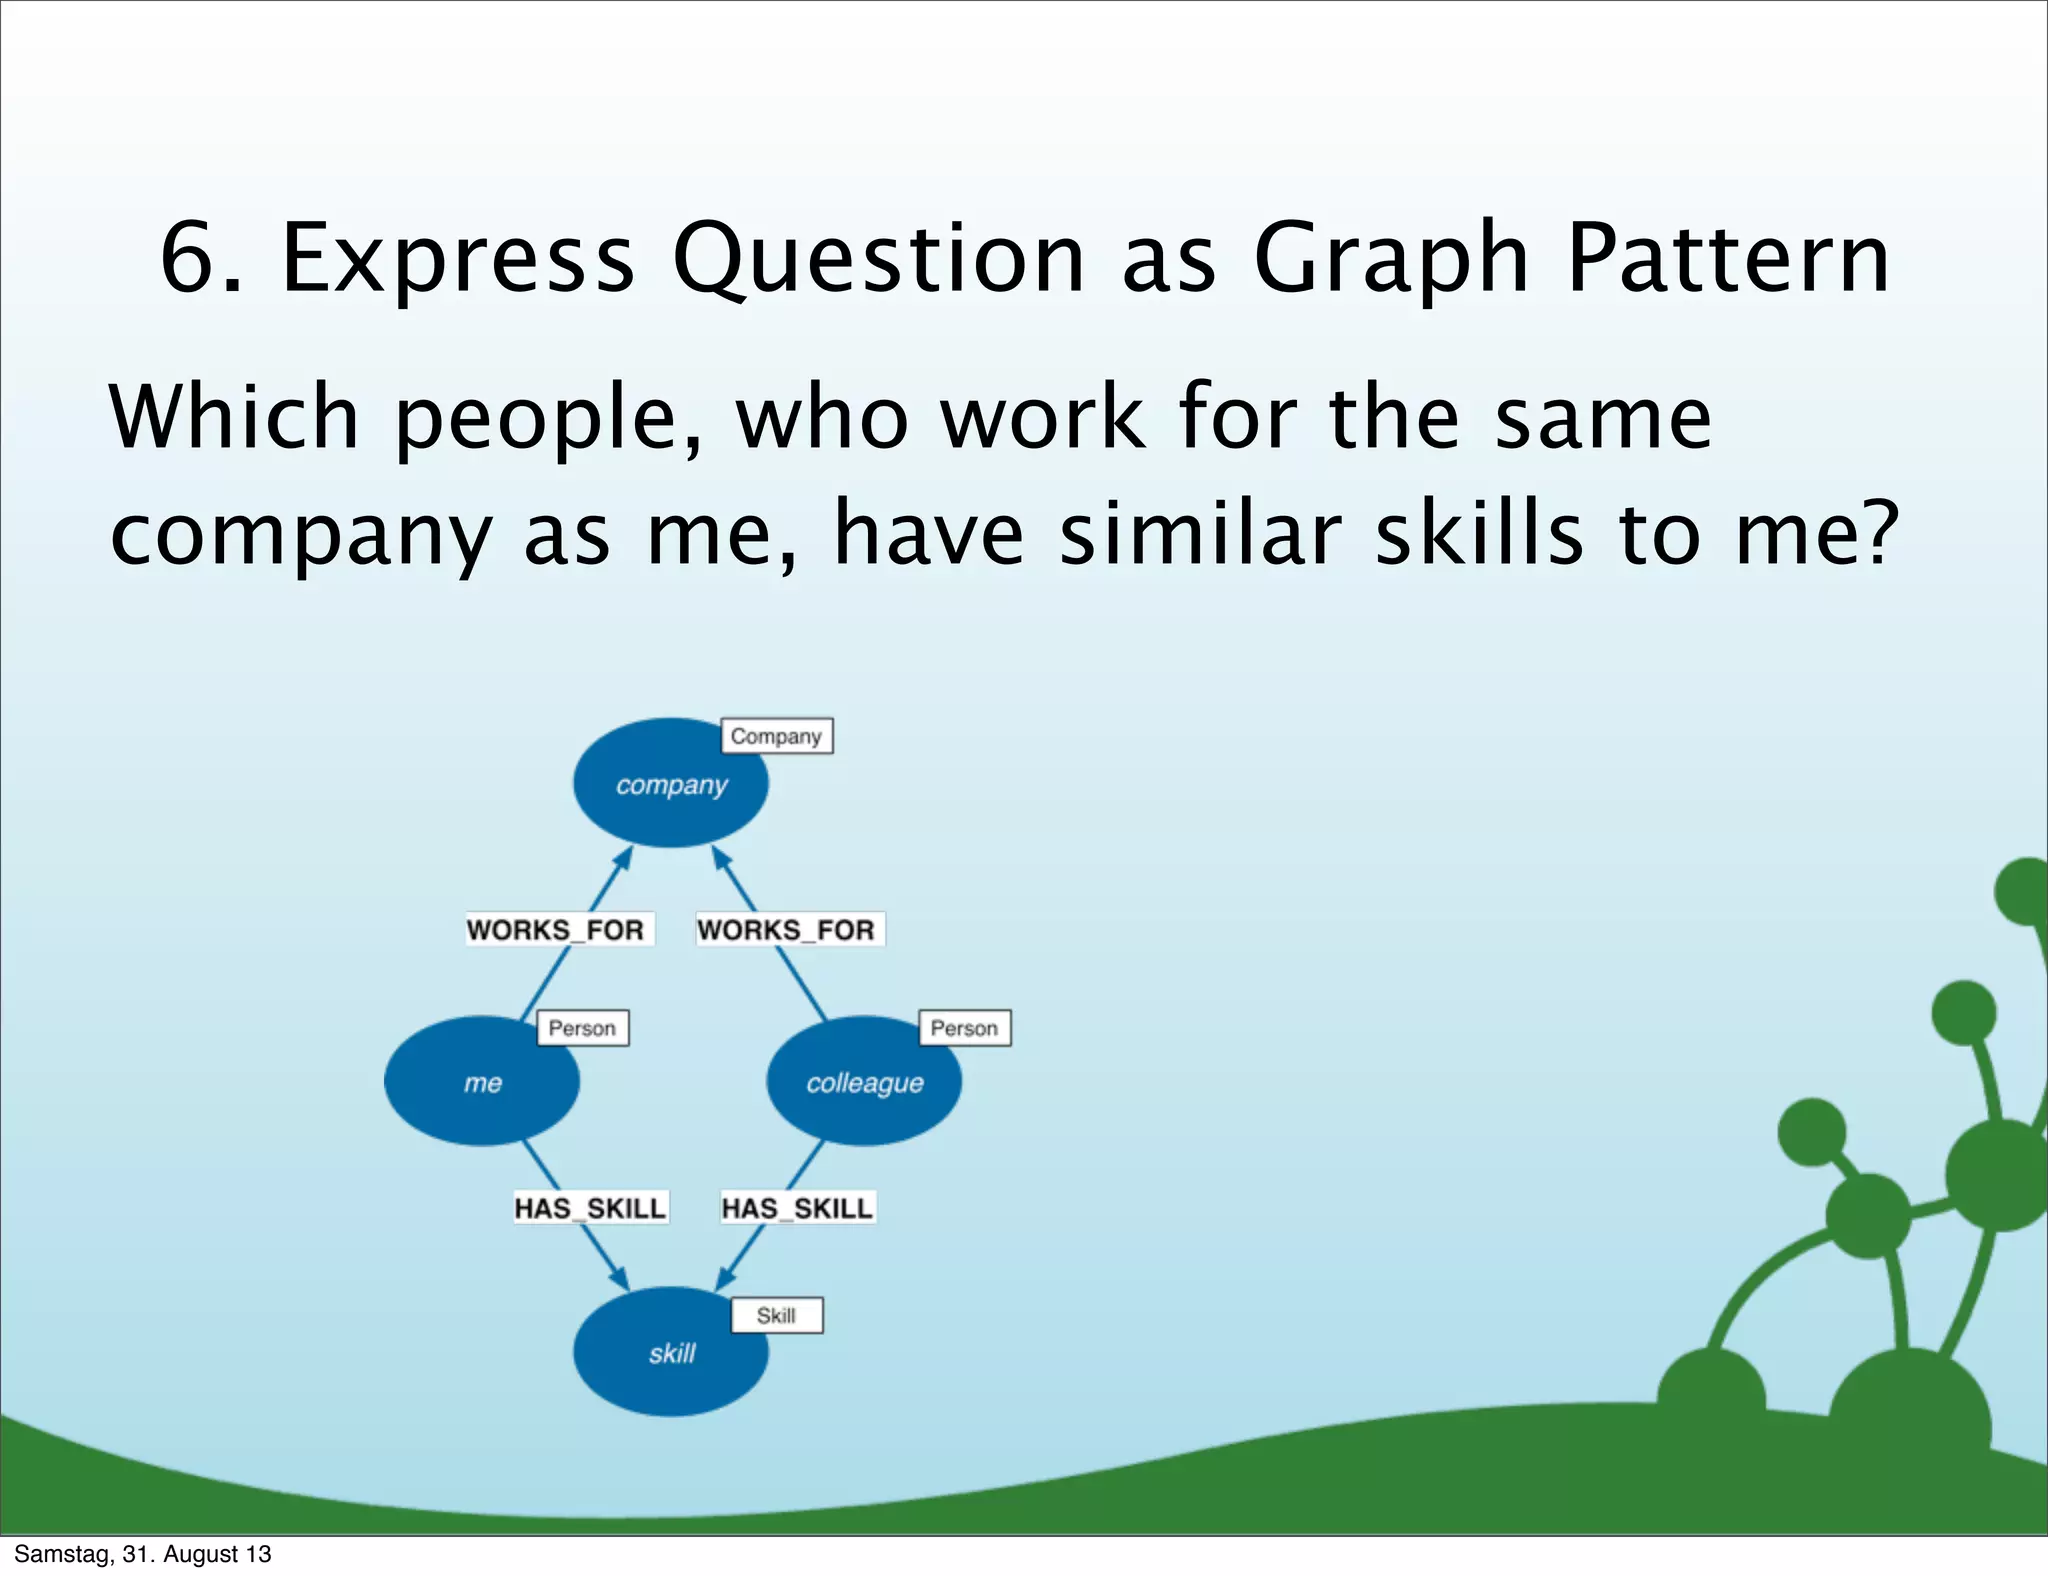
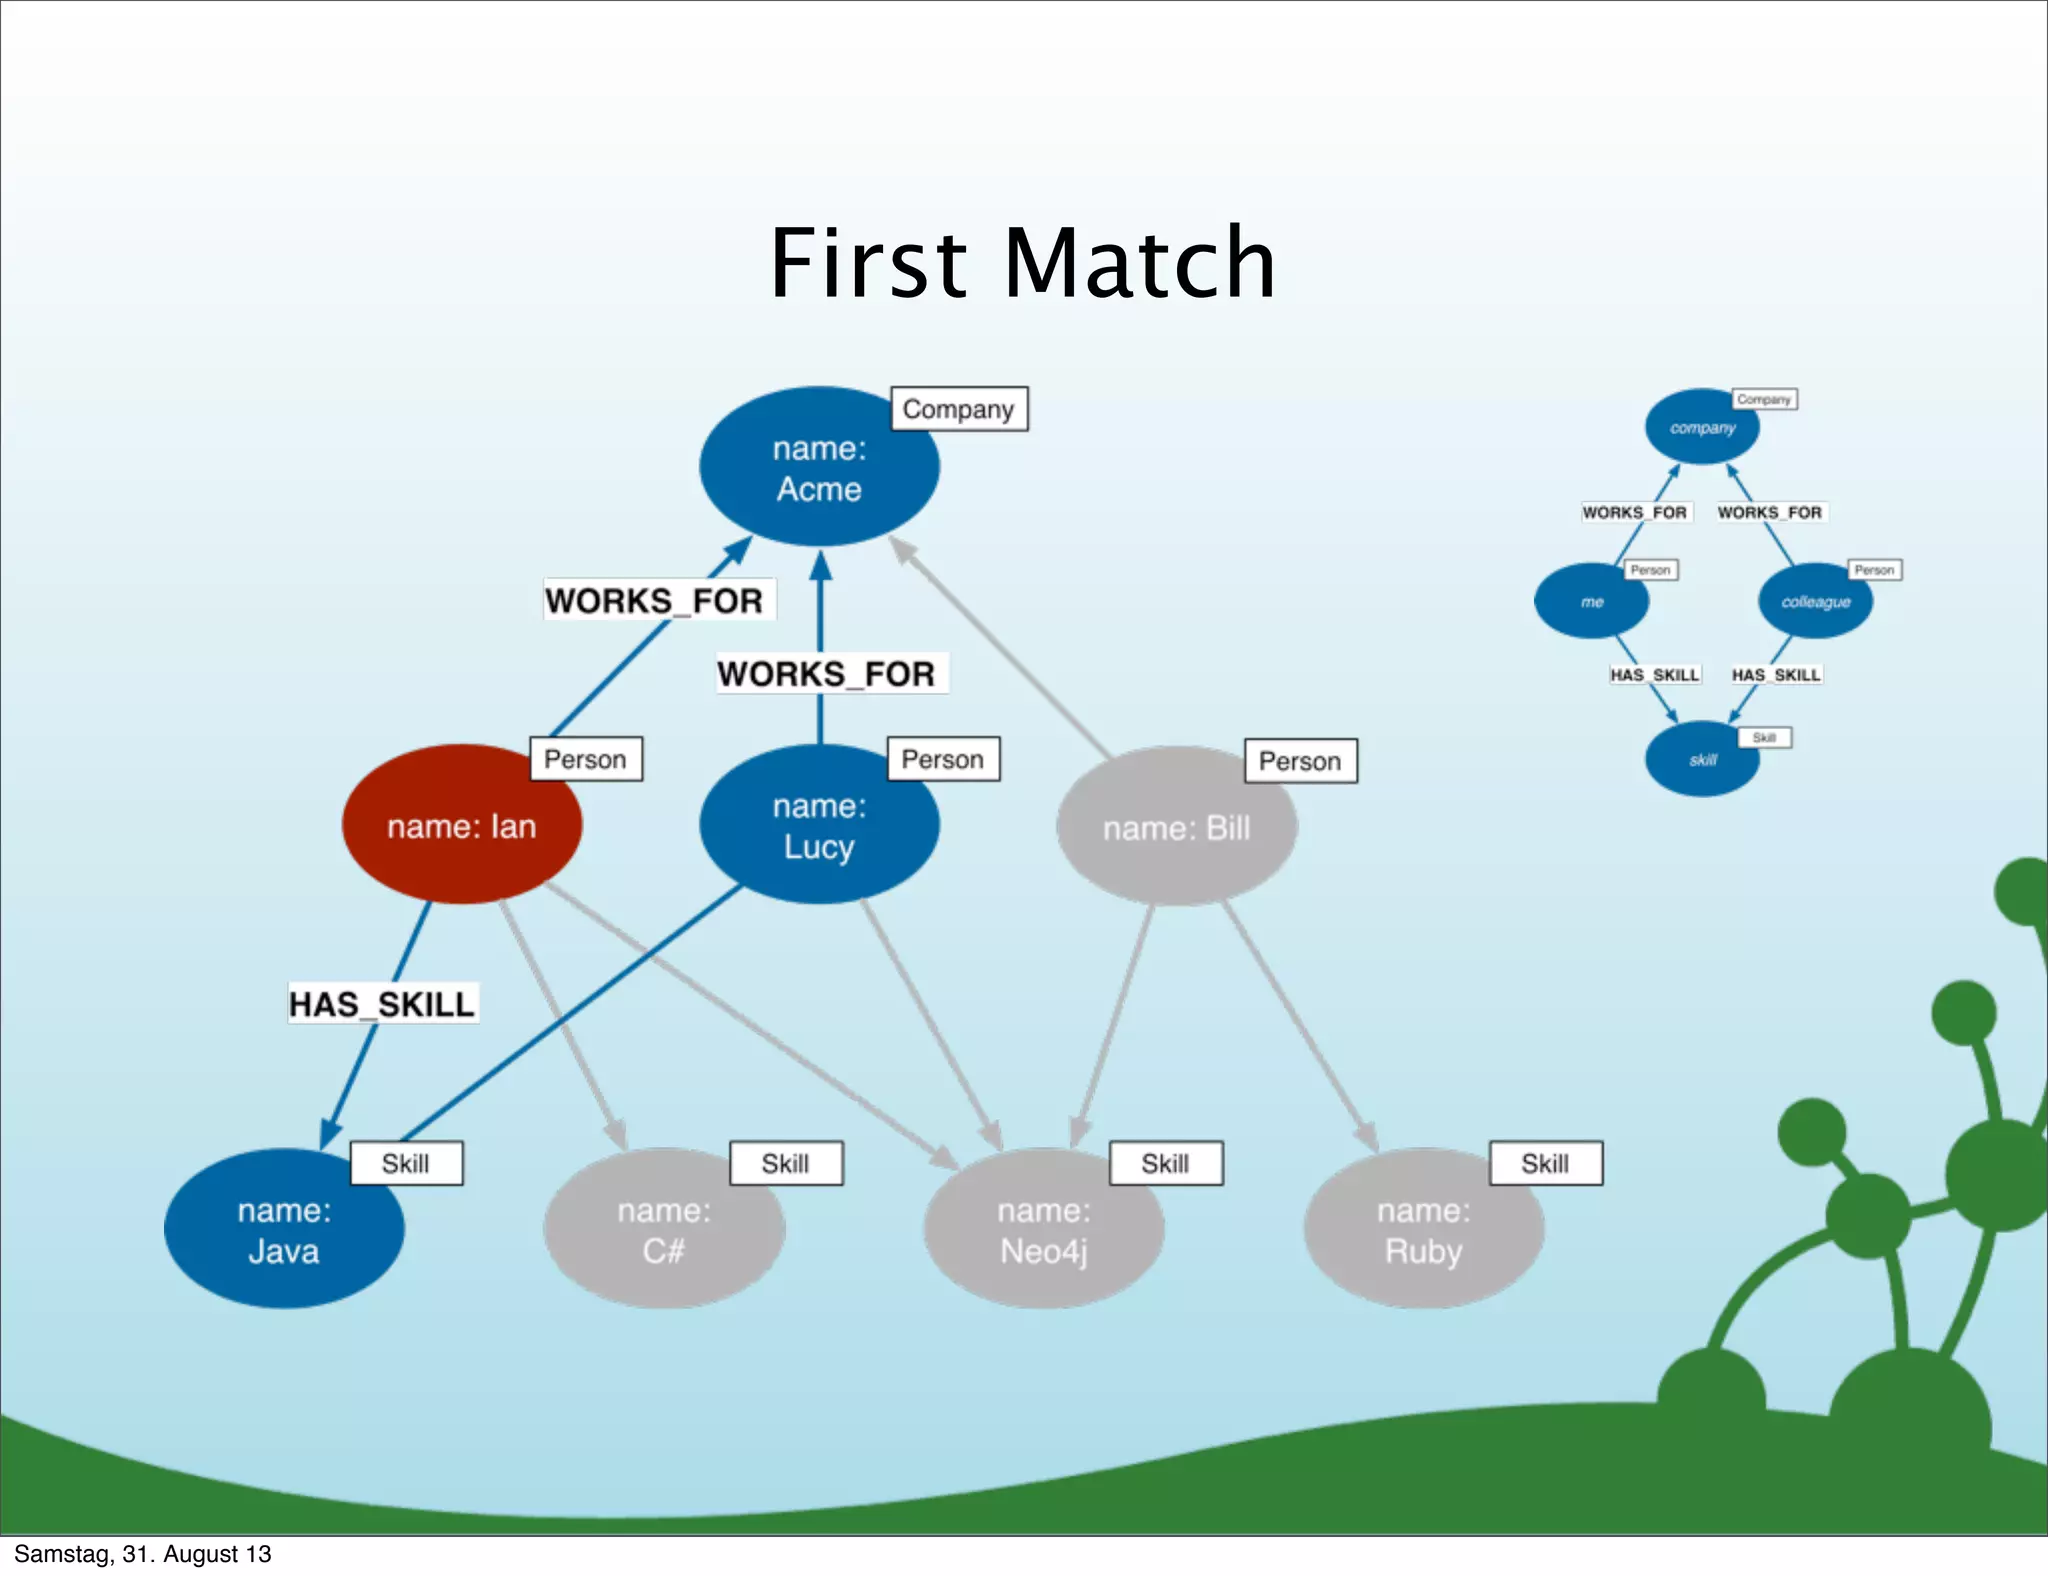
Which people, who work for the same
company as me, have similar skills to me?
MATCH (company)<-[:WORKS_FOR]-(me:Person)-[:HAS_SKILL]->(skill),
(company)<-[:WORKS_FOR]-(colleague)-[:HAS_SKILL]->(skill)
WHERE me.name = {name}
RETURN colleague.name AS name,
count(skill) AS score,
collect(skill.name) AS skills
ORDER BY score DESC
Samstag, 31. August 13](https://image.slidesharecdn.com/webinardatamodelingnew-130830215355-phpapp02/75/Data-Modeling-with-Neo4j-68-2048.jpg)
![Which people, who work for the same
company as me, have similar skills to me?
MATCH (company)<-[:WORKS_FOR]-(me:Person)-[:HAS_SKILL]->(skill),
(company)<-[:WORKS_FOR]-(colleague)-[:HAS_SKILL]->(skill)
WHERE me.name = {name}
RETURN colleague.name AS name,
count(skill) AS score,
collect(skill.name) AS skills
ORDER BY score DESC
Graph Pattern
Samstag, 31. August 13](https://image.slidesharecdn.com/webinardatamodelingnew-130830215355-phpapp02/75/Data-Modeling-with-Neo4j-69-2048.jpg)
![Which people, who work for the same
company as me, have similar skills to me?
MATCH (company)<-[:WORKS_FOR]-(me:Person)-[:HAS_SKILL]->(skill),
(company)<-[:WORKS_FOR]-(colleague)-[:HAS_SKILL]->(skill)
WHERE me.name = {name}
RETURN colleague.name AS name,
count(skill) AS score,
collect(skill.name) AS skills
ORDER BY score DESC
Anchor Pattern in Graph
Samstag, 31. August 13](https://image.slidesharecdn.com/webinardatamodelingnew-130830215355-phpapp02/75/Data-Modeling-with-Neo4j-70-2048.jpg)
![Which people, who work for the same
company as me, have similar skills to me?
MATCH (company)<-[:WORKS_FOR]-(me:Person)-[:HAS_SKILL]->(skill),
(company)<-[:WORKS_FOR]-(colleague)-[:HAS_SKILL]->(skill)
WHERE me.name = {name}
RETURN colleague.name AS name,
count(skill) AS score,
collect(skill.name) AS skills
ORDER BY score DESC
Create Projection of Results
Samstag, 31. August 13](https://image.slidesharecdn.com/webinardatamodelingnew-130830215355-phpapp02/75/Data-Modeling-with-Neo4j-71-2048.jpg)
![Running the Query
+-----------------------------------+
| name | score | skills |
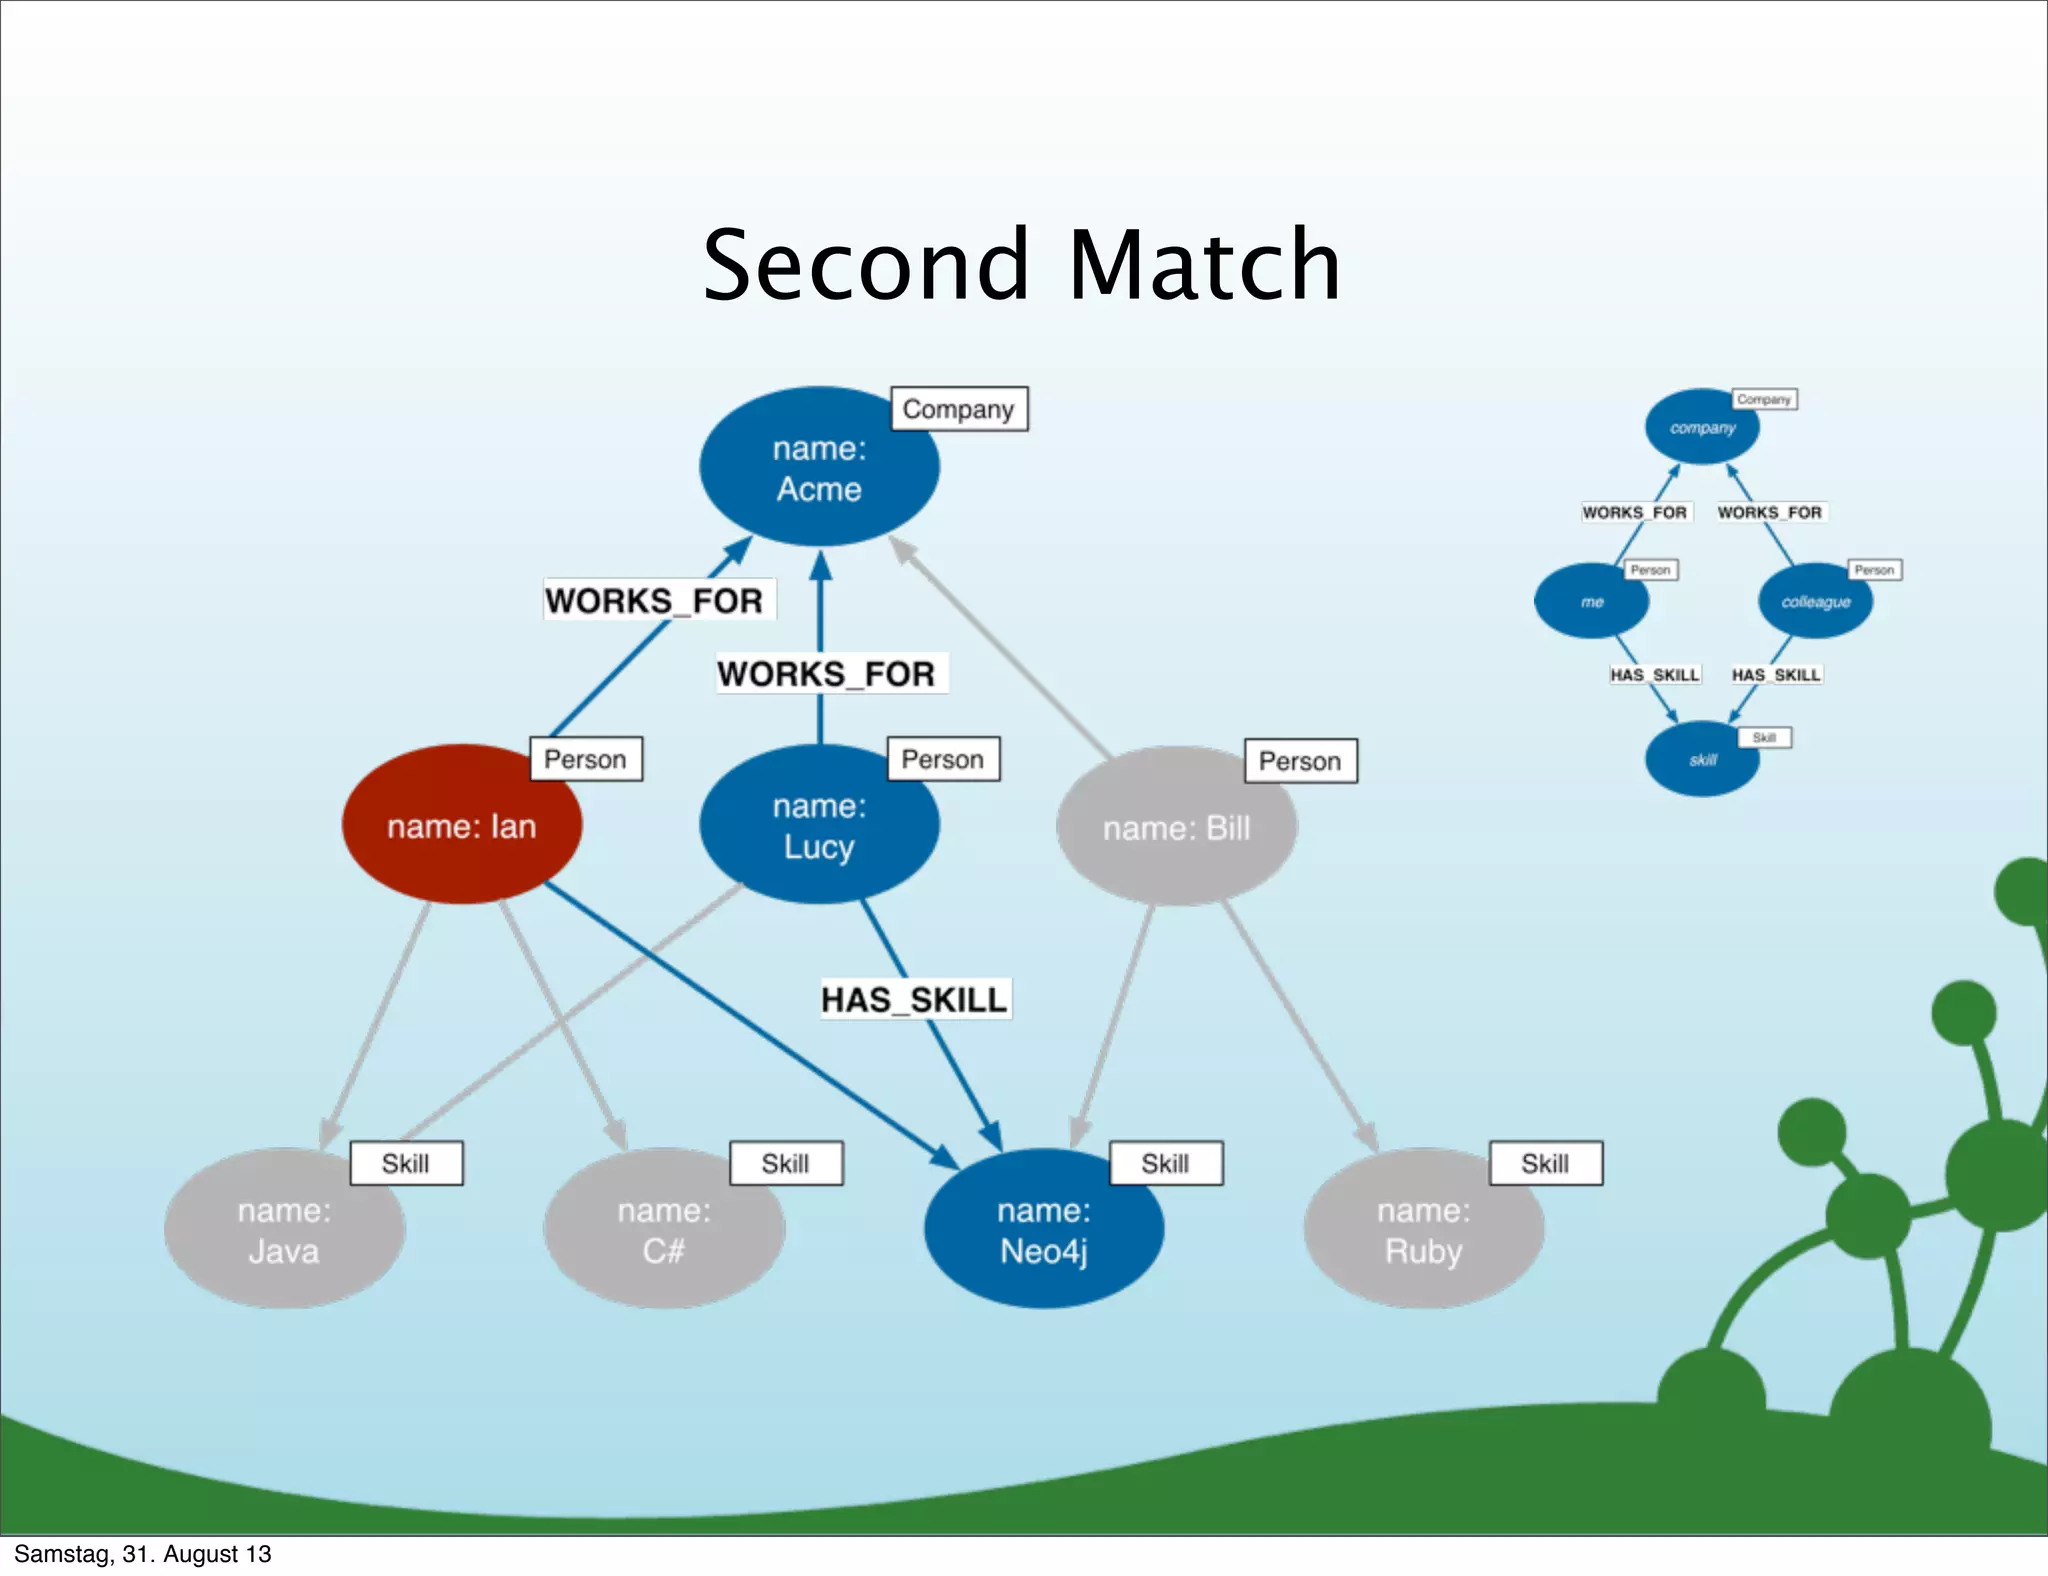
+-----------------------------------+
| "Lucy" | 2 | ["Java","Neo4j"] |
| "Bill" | 1 | ["Neo4j"] |
+-----------------------------------+
2 rows
Samstag, 31. August 13](https://image.slidesharecdn.com/webinardatamodelingnew-130830215355-phpapp02/75/Data-Modeling-with-Neo4j-75-2048.jpg)
![From User Story to Model and Query
MATCH (company)<-[:WORKS_FOR]-(me:Person)-[:HAS_SKILL]->(skill),
(company)<-[:WORKS_FOR]-(colleague)-[:HAS_SKILL]->(skill)
WHERE me.name = {name}
RETURN colleague.name AS name,
count(skill) AS score,
collect(skill.name) AS skills
ORDER BY score DESC
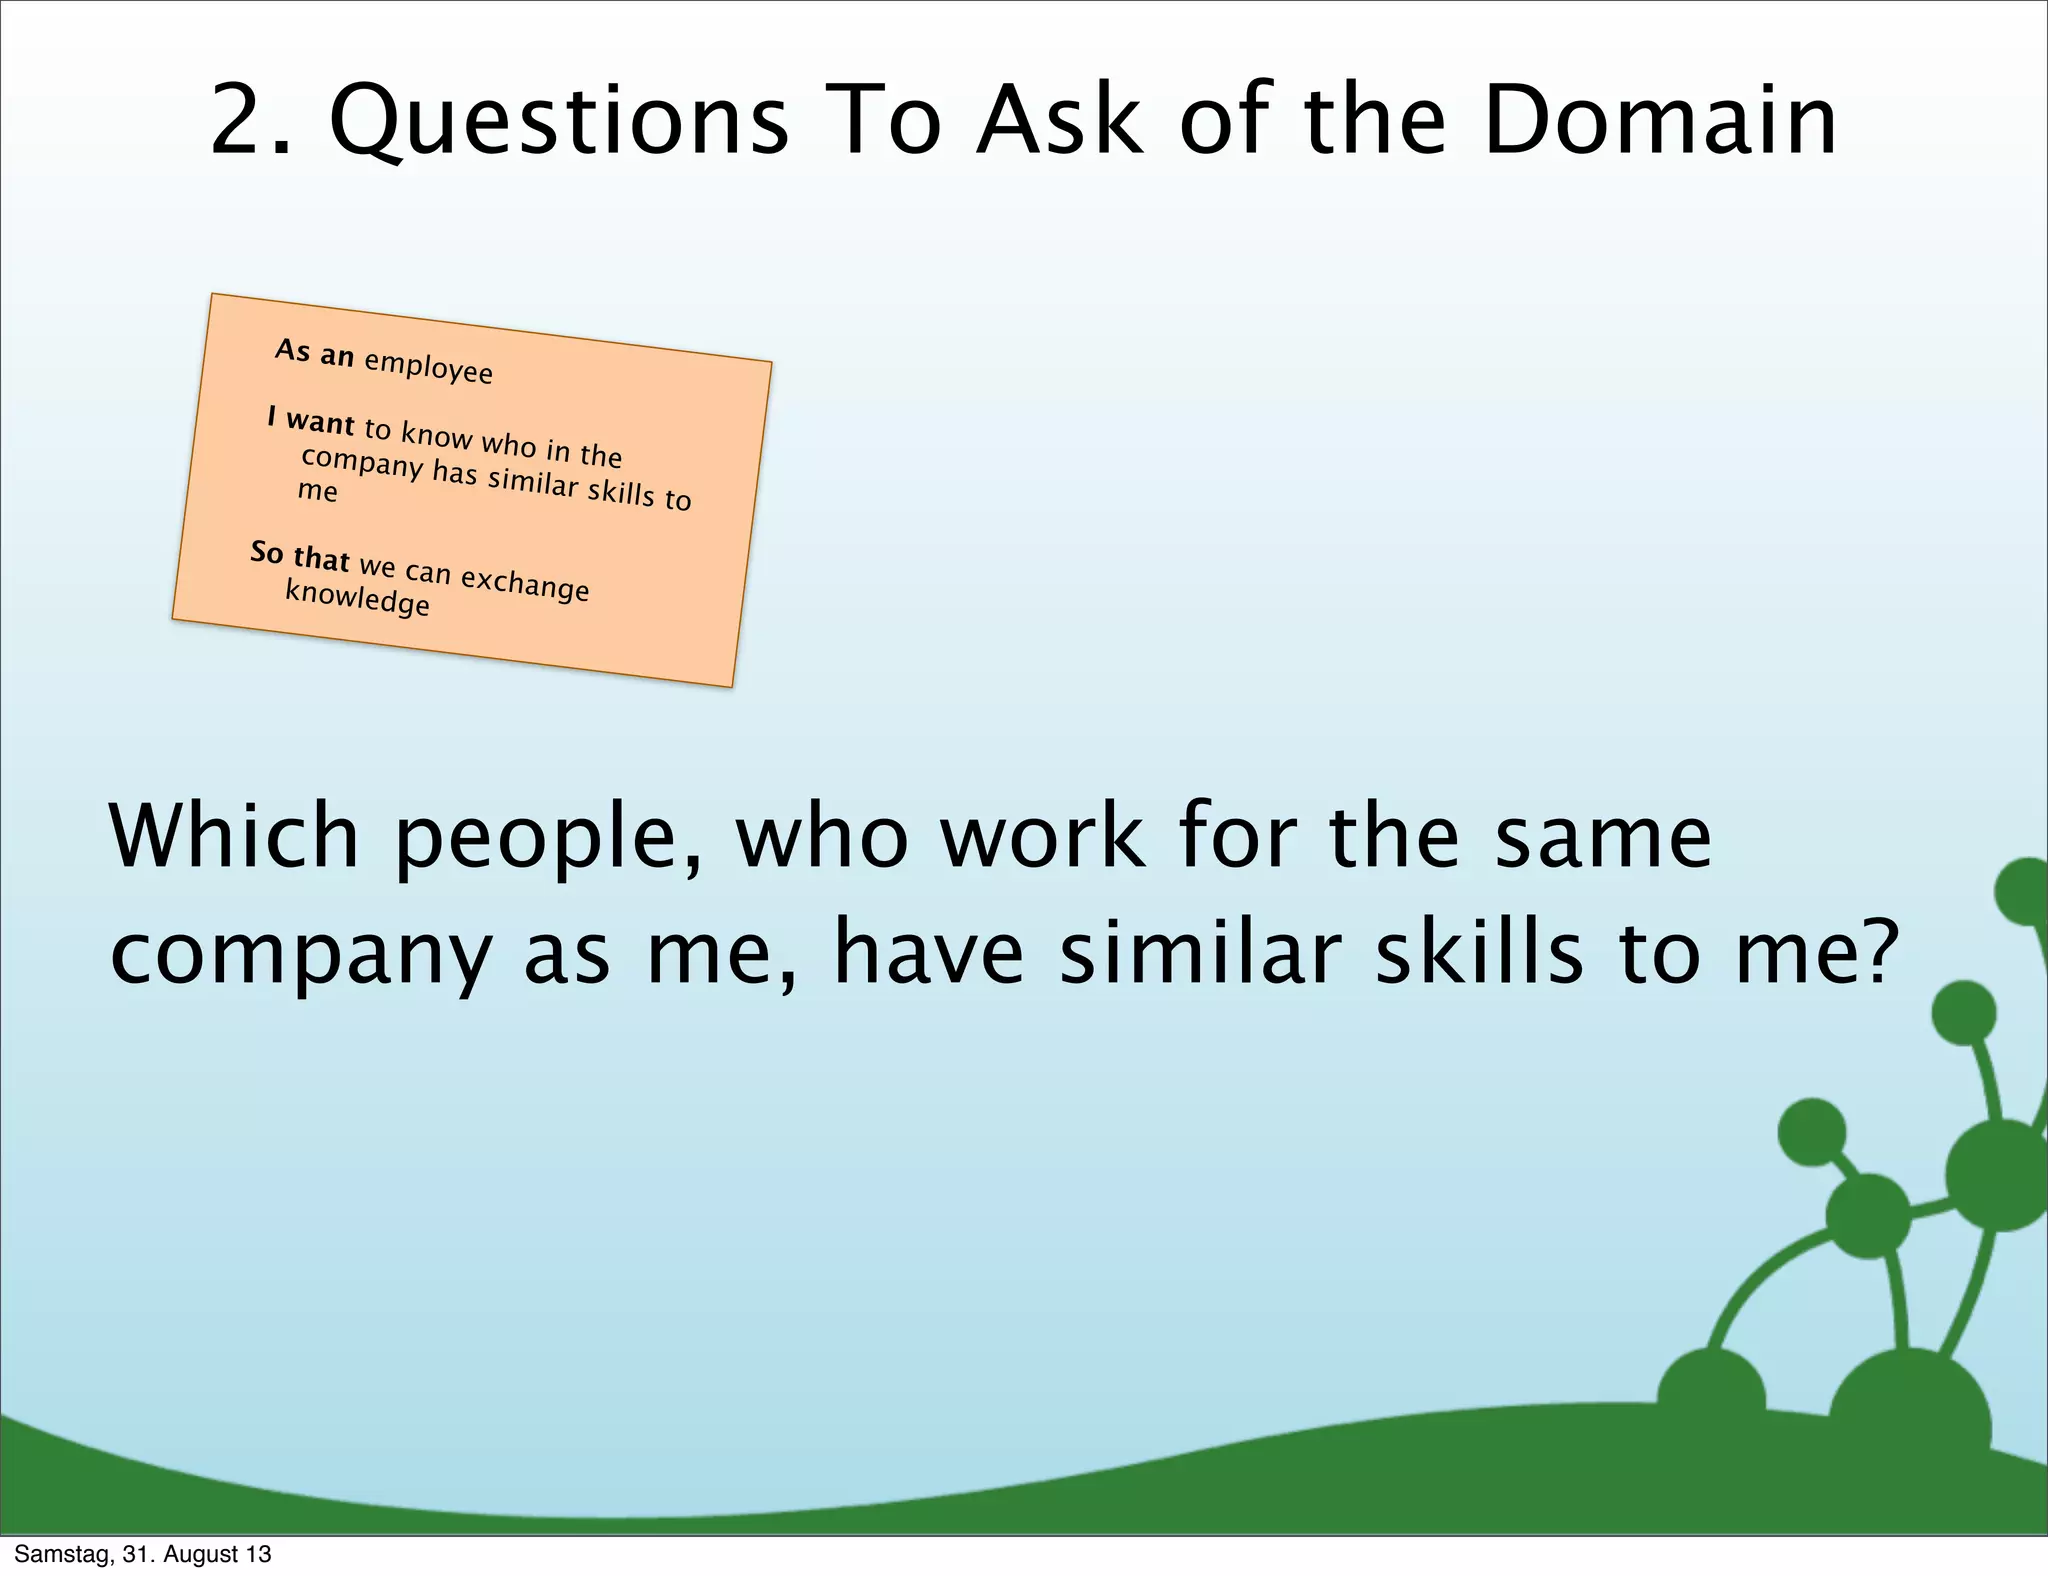
As an employee
I want to know who in thecompany has similar skills tome
So that we can exchangeknowledge
(:Company)<-[:WORKS_FOR]-(:Person)-[:HAS_SKILL]->(:Skill)
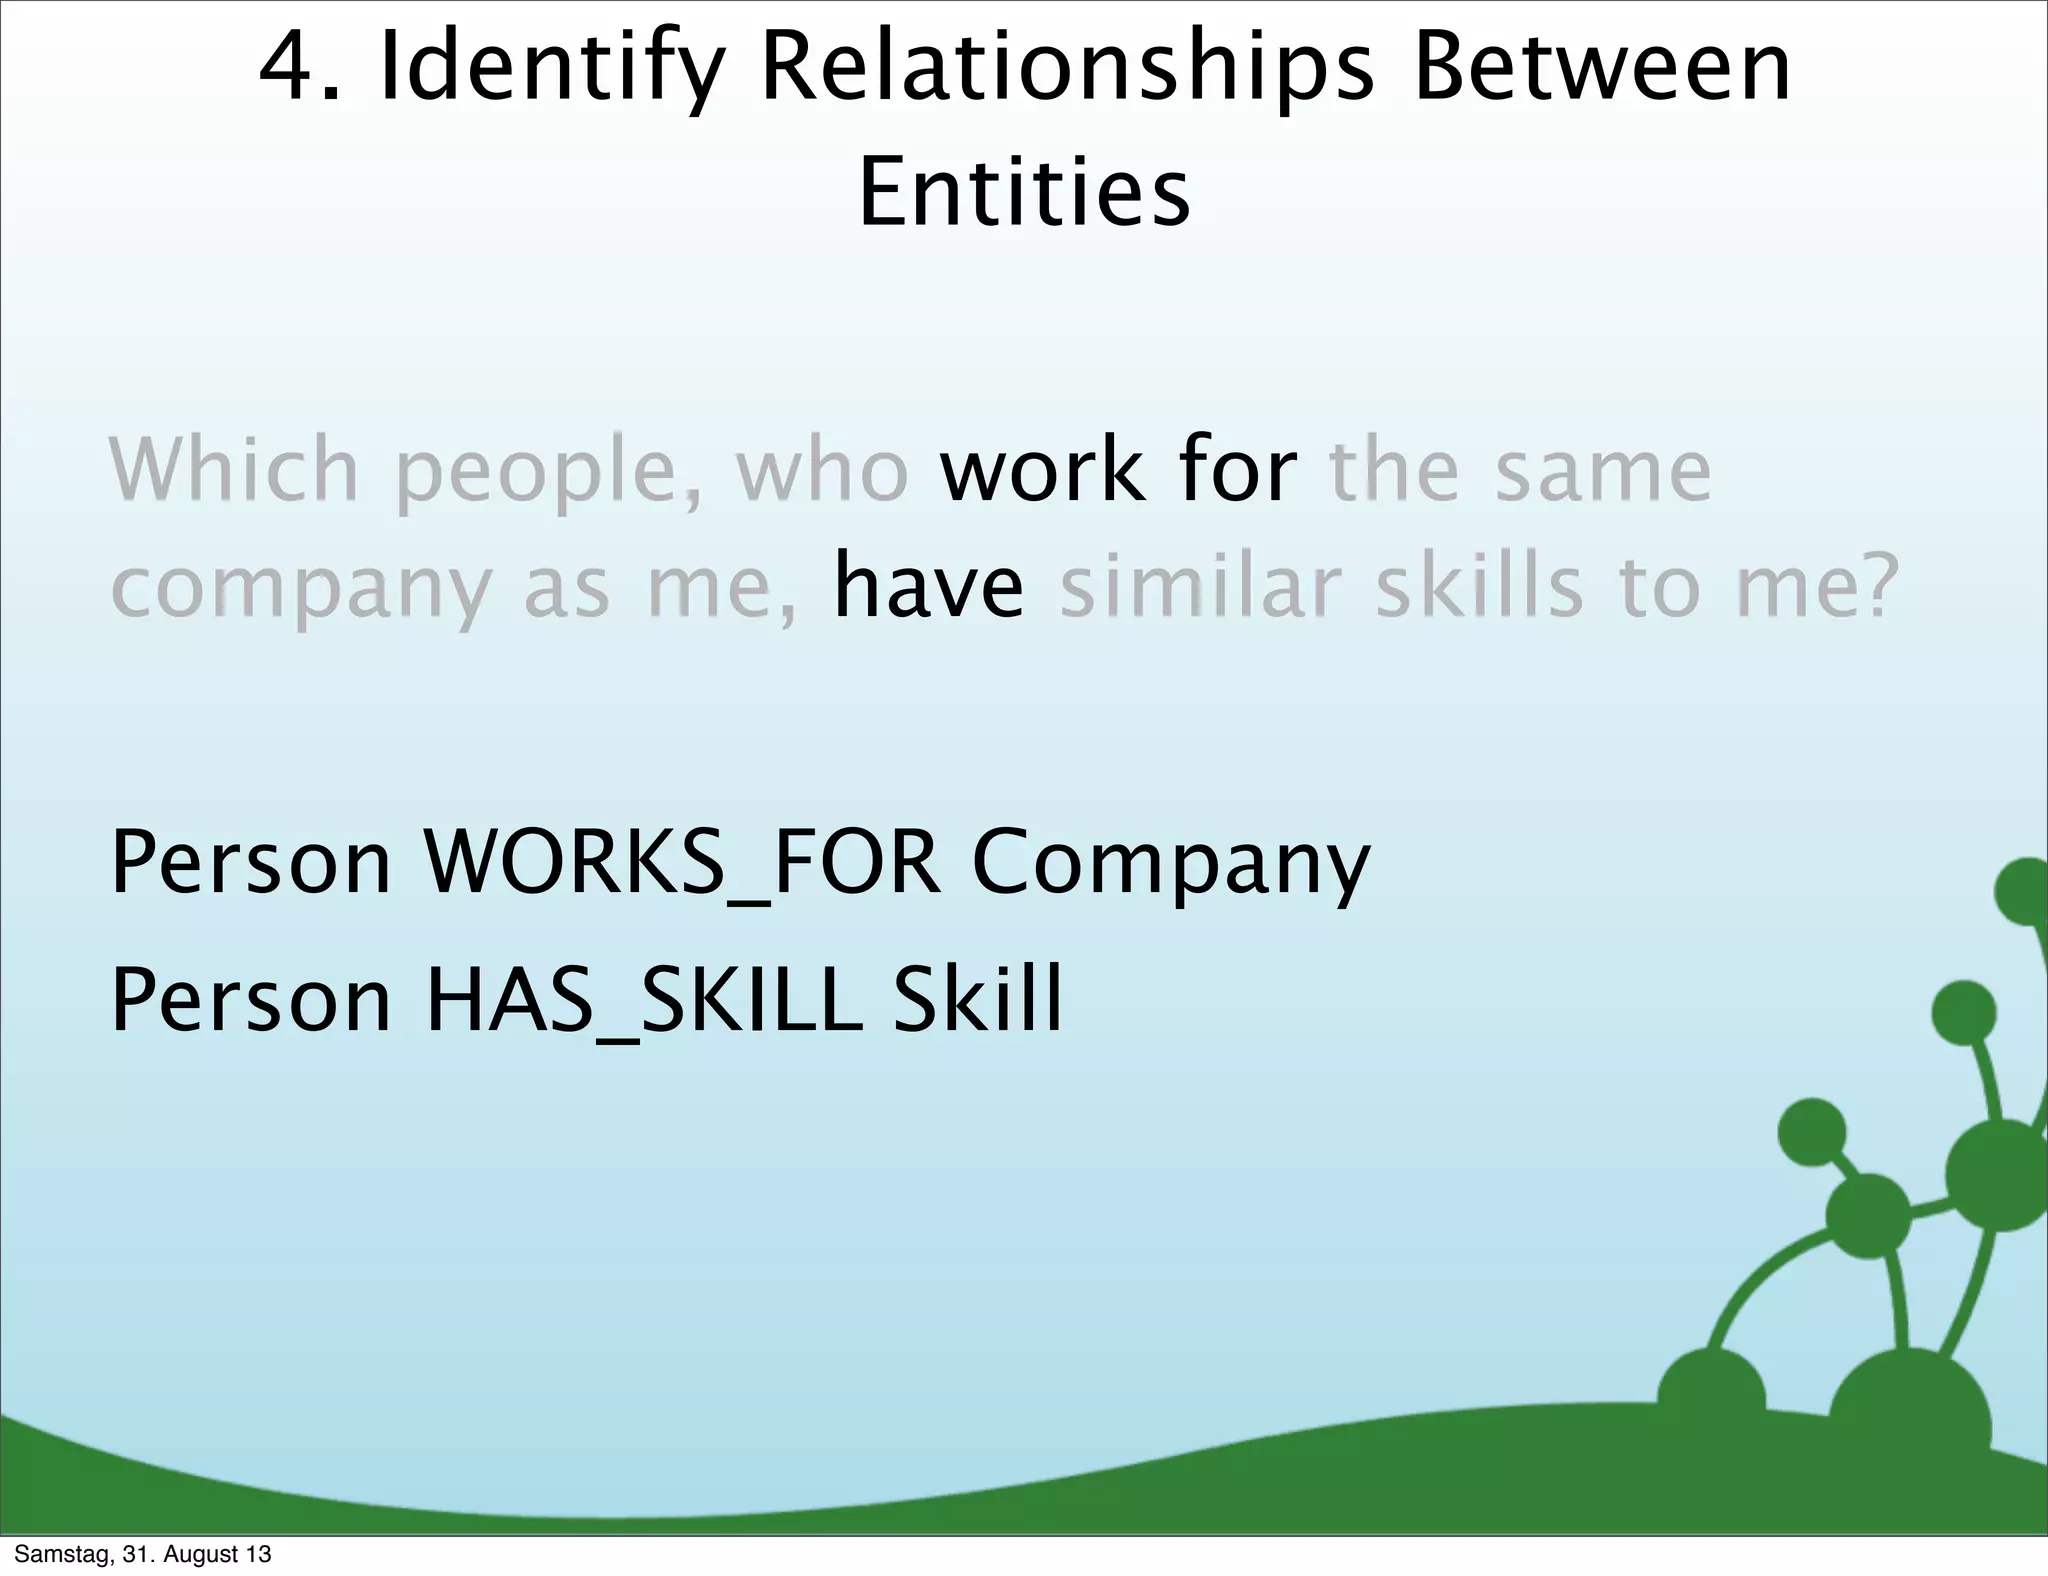
Person WORKS_FOR Company
Person HAS_SKILL Skill
?Which people, who work for the
same company as me, have similar
skills to me?
Samstag, 31. August 13](https://image.slidesharecdn.com/webinardatamodelingnew-130830215355-phpapp02/75/Data-Modeling-with-Neo4j-76-2048.jpg)
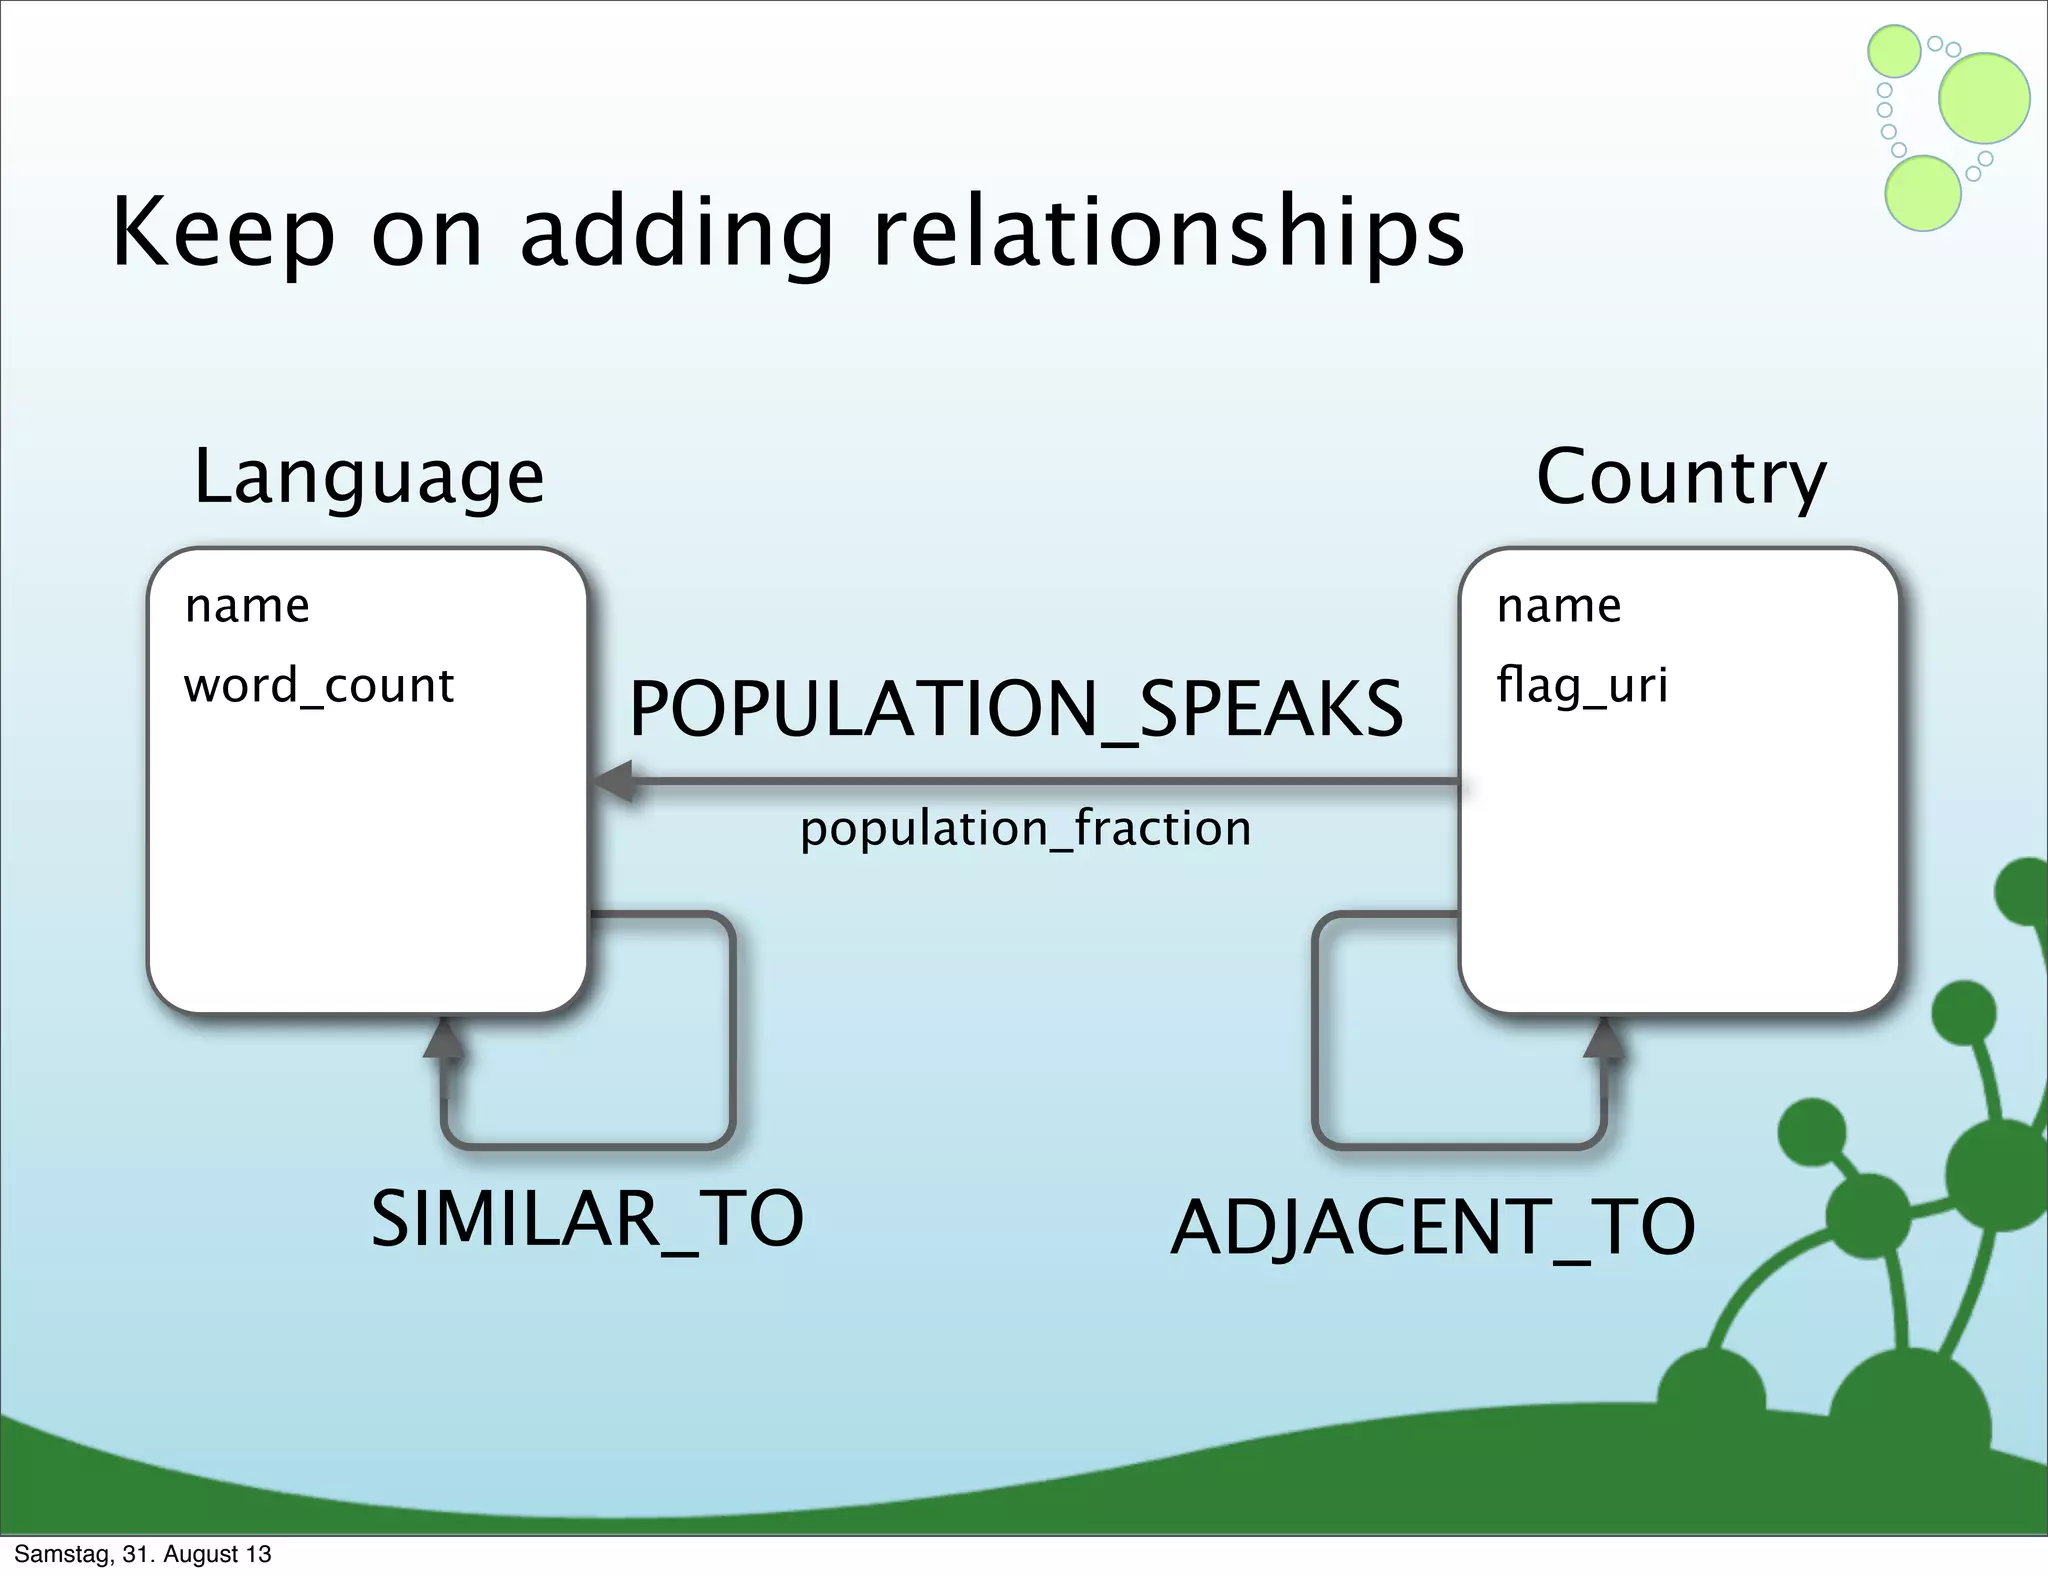
![Anti-pattern: rich properties
name: “Canada”
languages_spoken: “[ ‘English’, ‘French’ ]”
Samstag, 31. August 13](https://image.slidesharecdn.com/webinardatamodelingnew-130830215355-phpapp02/75/Data-Modeling-with-Neo4j-79-2048.jpg)


![93
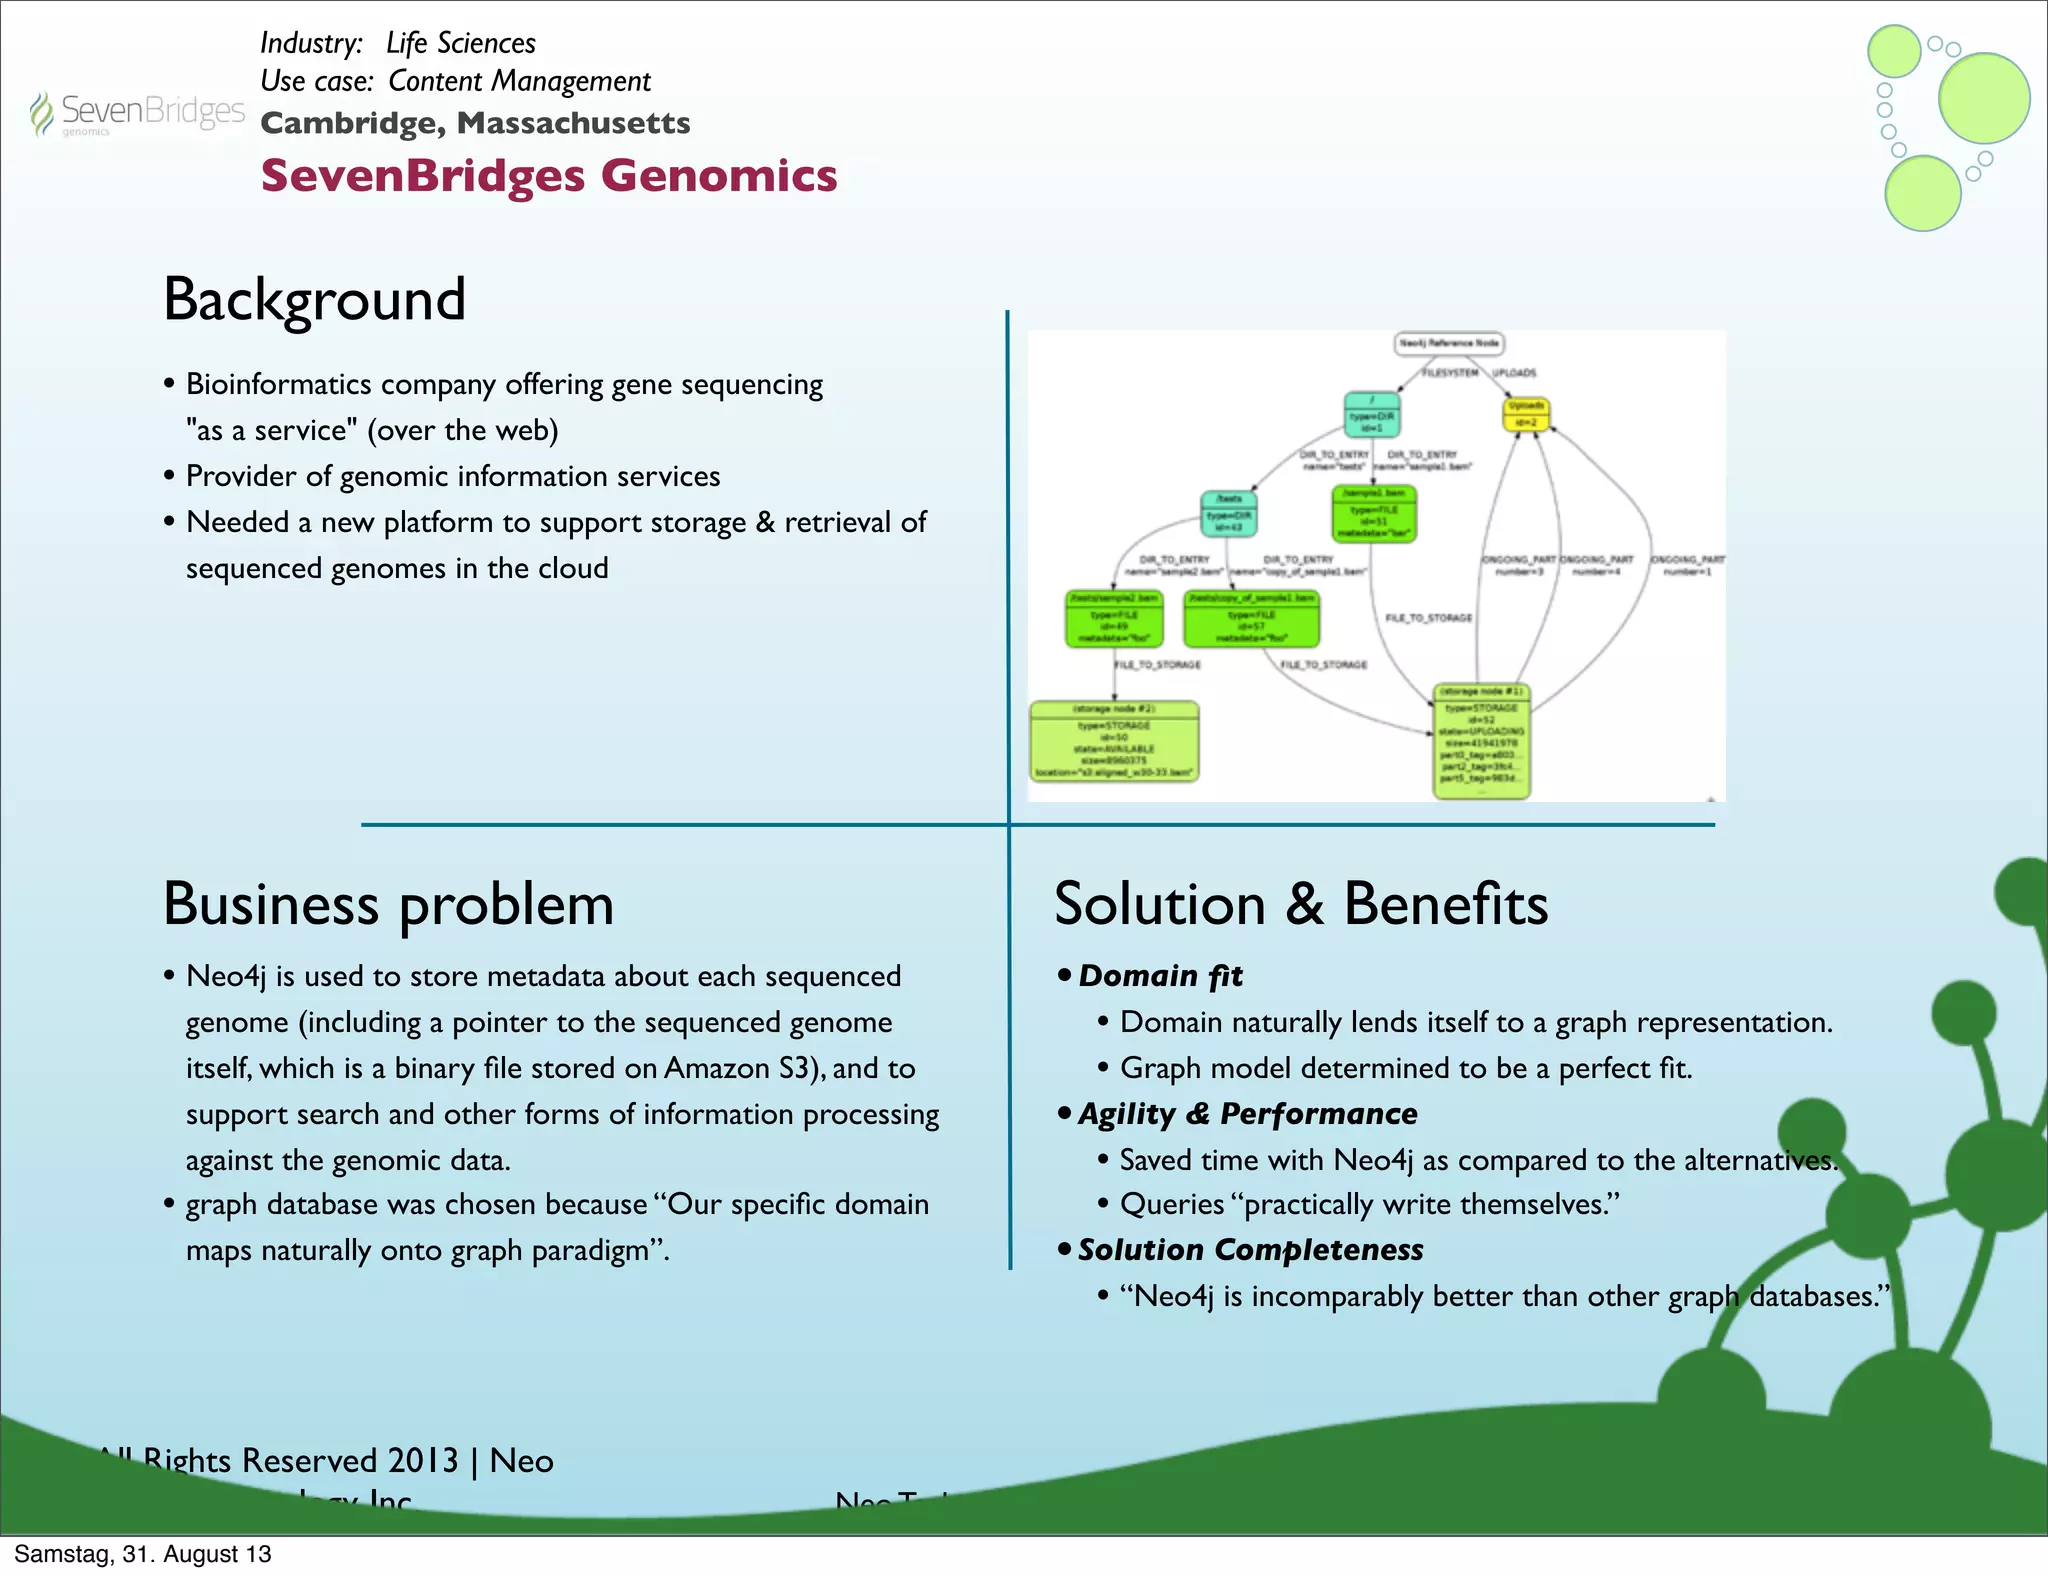
Real World Use Cases:
•[A] ACL from Hell
Samstag, 31. August 13](https://image.slidesharecdn.com/webinardatamodelingnew-130830215355-phpapp02/75/Data-Modeling-with-Neo4j-122-2048.jpg)
![93
Real World Use Cases:
•[A] ACL from Hell
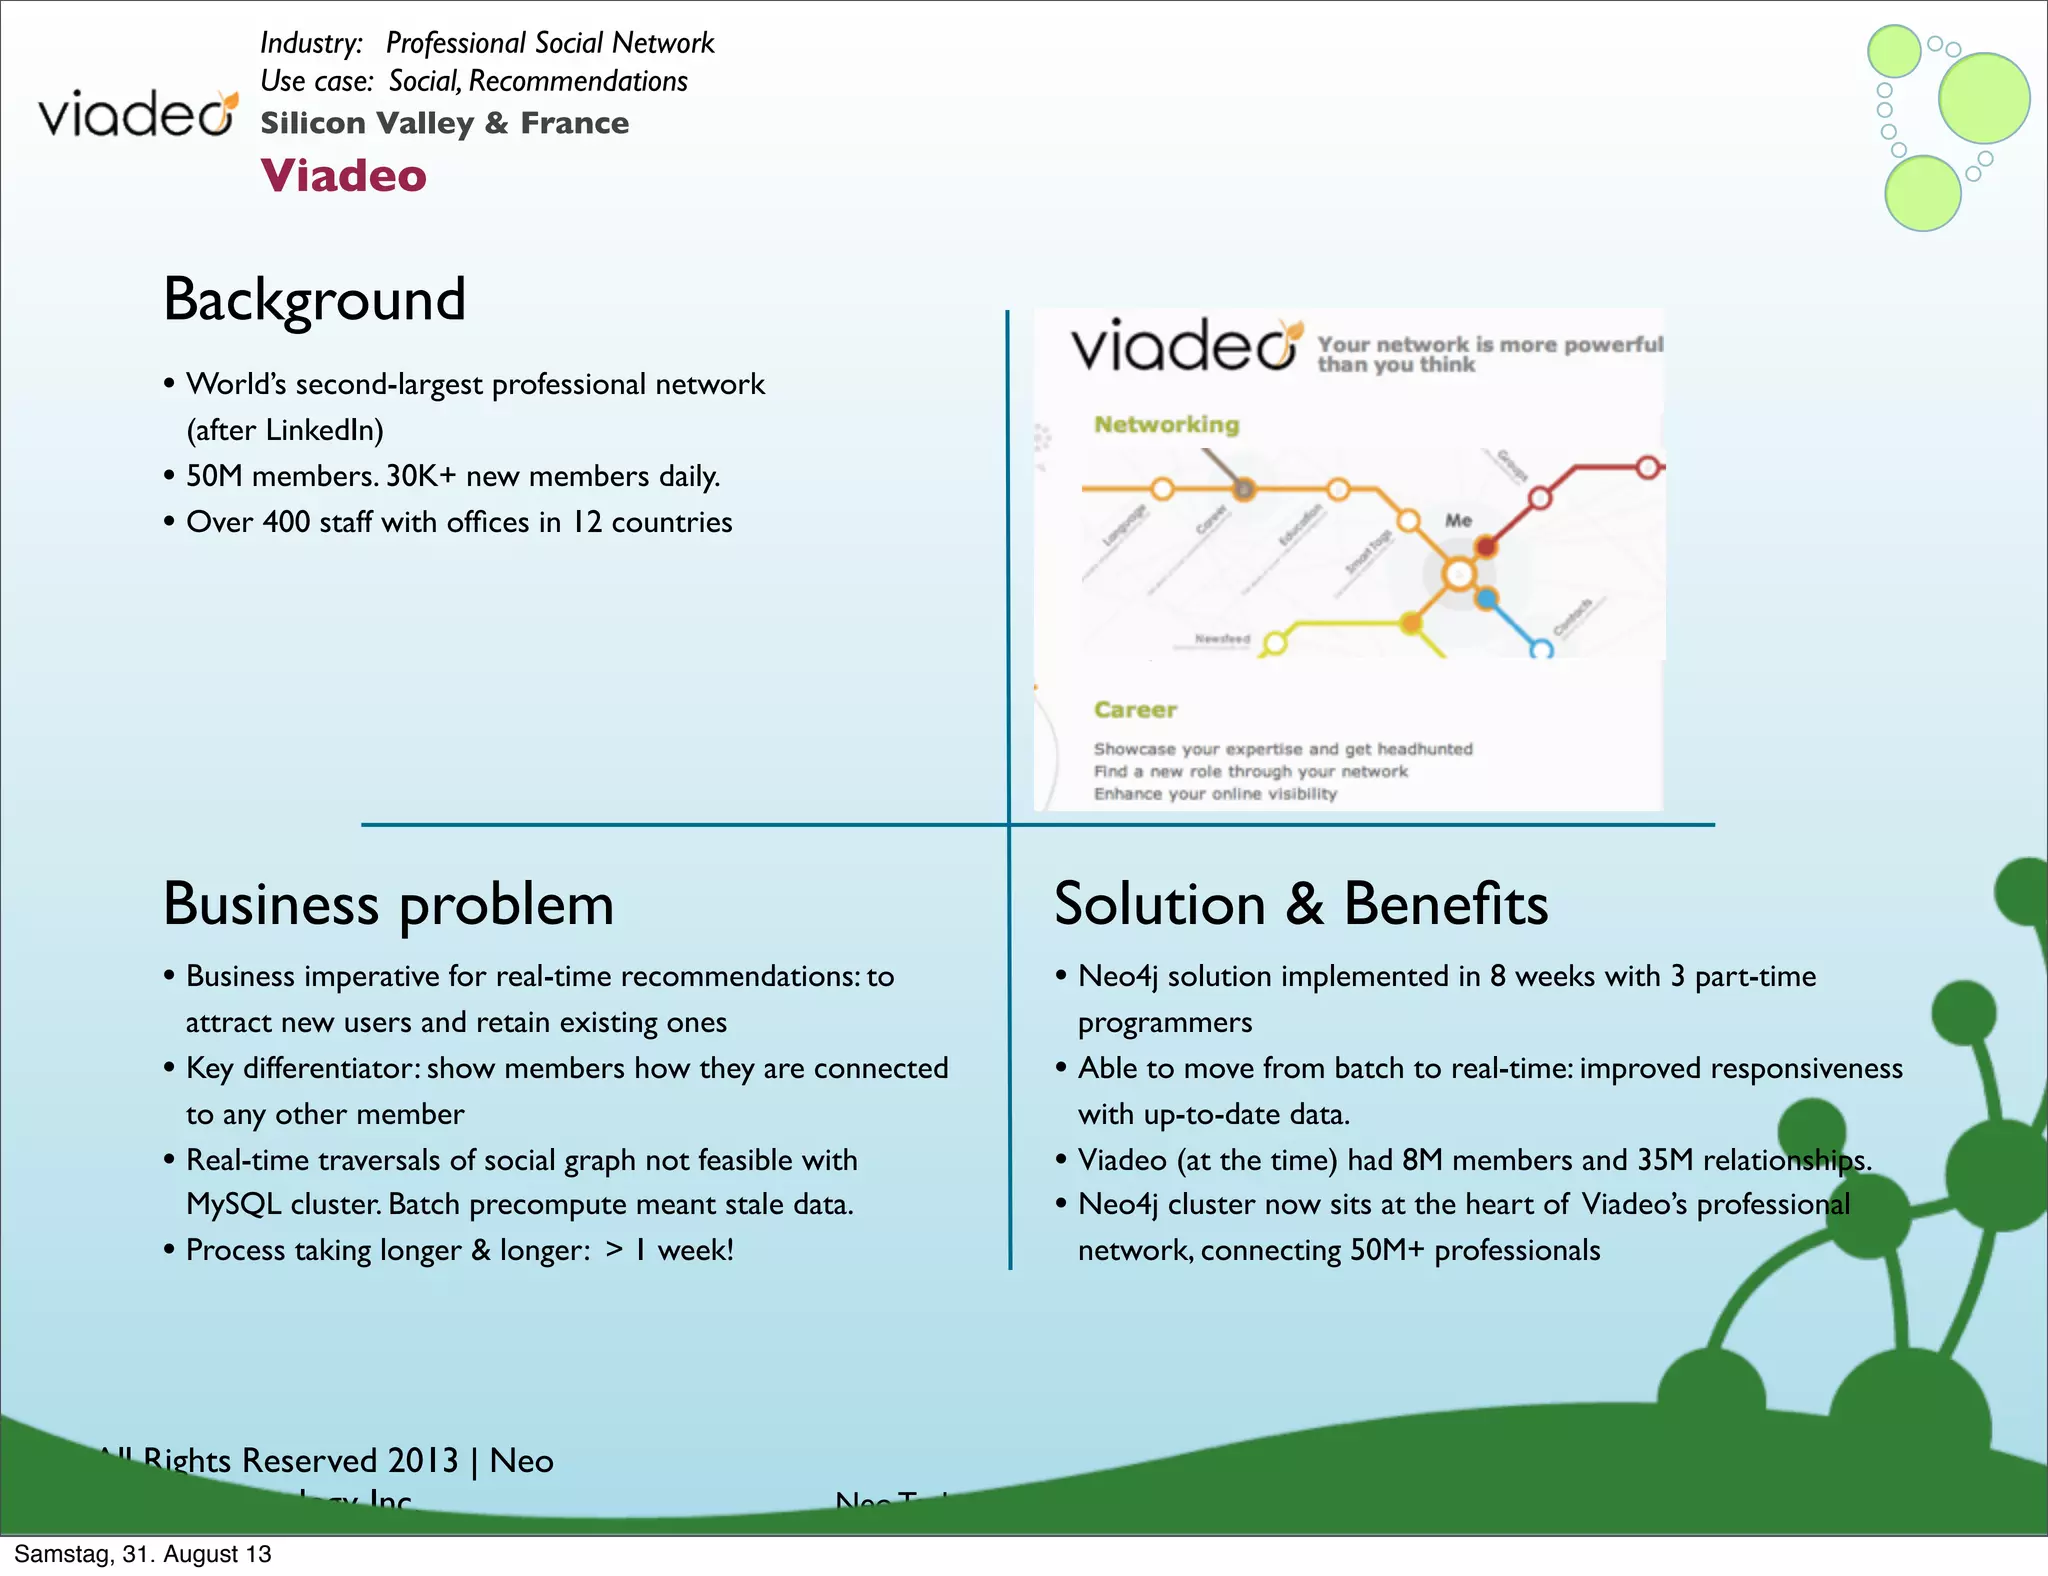
•[B] Timely recommendations
Samstag, 31. August 13](https://image.slidesharecdn.com/webinardatamodelingnew-130830215355-phpapp02/75/Data-Modeling-with-Neo4j-123-2048.jpg)
![93
Real World Use Cases:
•[A] ACL from Hell
•[B] Timely recommendations
•[C] Global collaboration
Samstag, 31. August 13](https://image.slidesharecdn.com/webinardatamodelingnew-130830215355-phpapp02/75/Data-Modeling-with-Neo4j-124-2048.jpg)

![94
Real World Use Cases:
•[A] ACL from Hell
Samstag, 31. August 13](https://image.slidesharecdn.com/webinardatamodelingnew-130830215355-phpapp02/75/Data-Modeling-with-Neo4j-127-2048.jpg)
![94
Real World Use Cases:
•[A] ACL from Hell
•[B] Timely recommendations
Samstag, 31. August 13](https://image.slidesharecdn.com/webinardatamodelingnew-130830215355-phpapp02/75/Data-Modeling-with-Neo4j-128-2048.jpg)
![94
Real World Use Cases:
•[A] ACL from Hell
•[B] Timely recommendations
•[C] Global collaboration
Samstag, 31. August 13](https://image.slidesharecdn.com/webinardatamodelingnew-130830215355-phpapp02/75/Data-Modeling-with-Neo4j-129-2048.jpg)
![[A] ACL from Hell
95
Samstag, 31. August 13](https://image.slidesharecdn.com/webinardatamodelingnew-130830215355-phpapp02/75/Data-Modeling-with-Neo4j-130-2048.jpg)
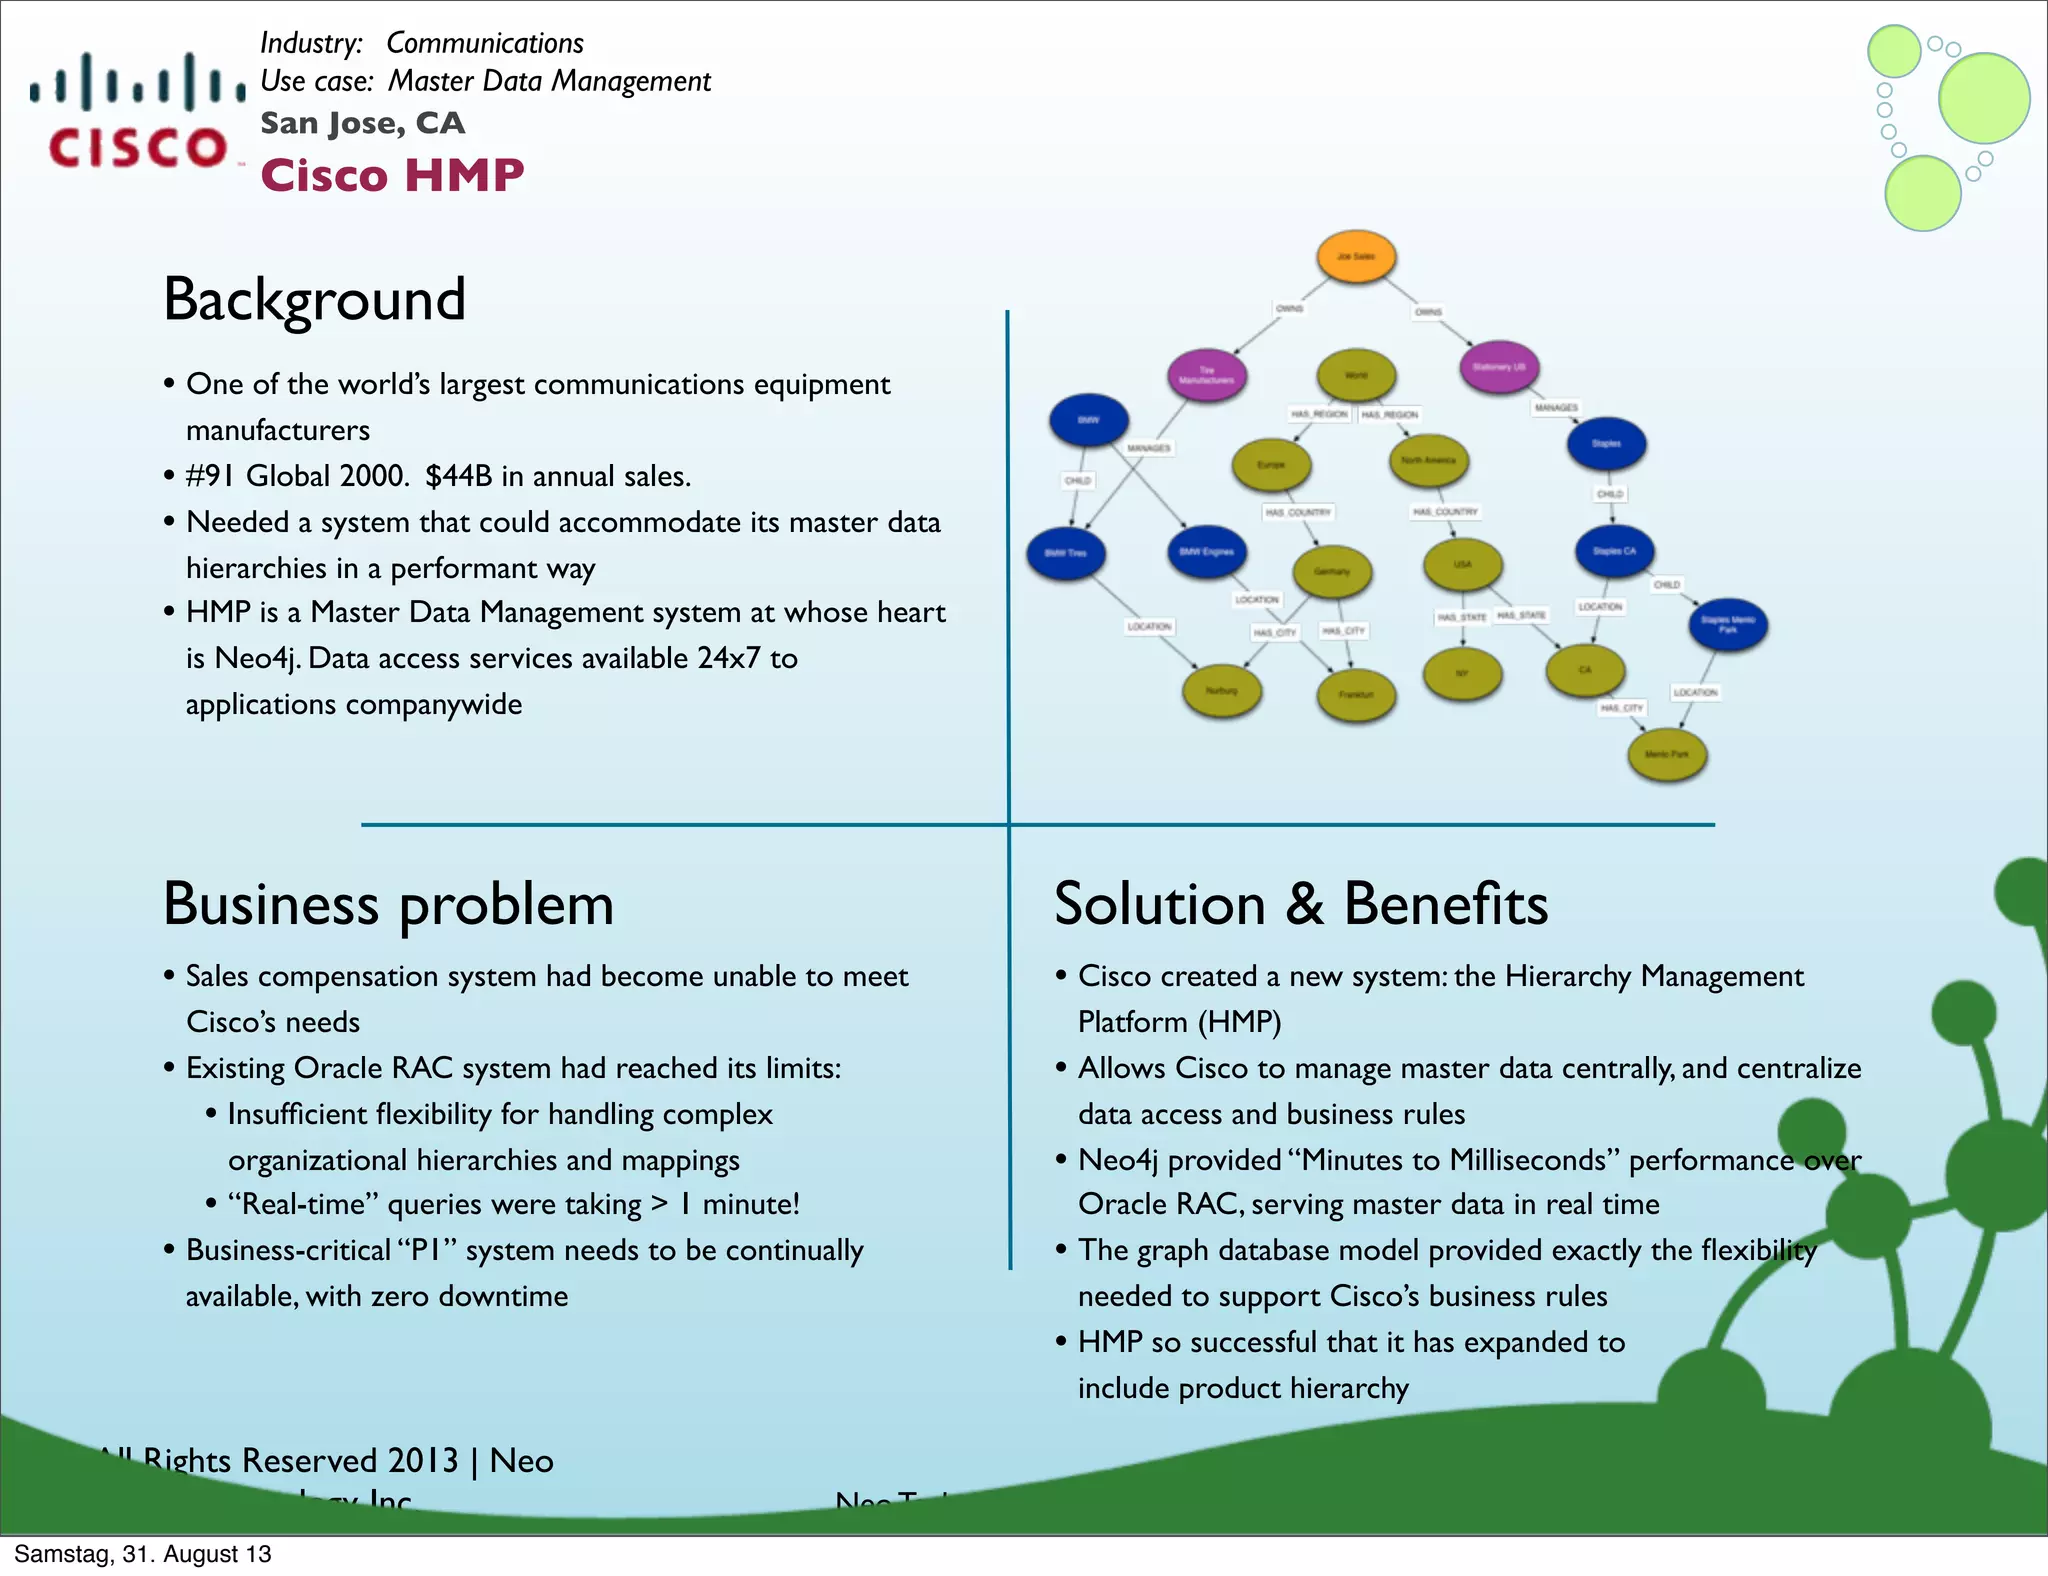
![[A] ACL from Hell
๏ Customer:
• leading consumer utility company with tons and
tons of users
๏ Goal:
• comprehensive access control administration
for customers
๏ Benefits:
• Flexible and dynamic architecture
• Exceptional performance
• Extensible data model supports new
applications and features
• Low cost
95
Samstag, 31. August 13](https://image.slidesharecdn.com/webinardatamodelingnew-130830215355-phpapp02/75/Data-Modeling-with-Neo4j-131-2048.jpg)
![[A] ACL from Hell
๏ Customer:
• leading consumer utility company with tons and
tons of users
๏ Goal:
• comprehensive access control administration
for customers
๏ Benefits:
• Flexible and dynamic architecture
• Exceptional performance
• Extensible data model supports new
applications and features
• Low cost
95
• A Reliable access control administration system for
5 million customers, subscriptions and agreements
• Complex dependencies between groups, companies,
individuals, accounts, products, subscriptions, services and
agreements
• Broad and deep graphs (master customers with 1000s of
customers, subscriptions & agreements)
Samstag, 31. August 13](https://image.slidesharecdn.com/webinardatamodelingnew-130830215355-phpapp02/75/Data-Modeling-with-Neo4j-132-2048.jpg)
![[A] ACL from Hell
๏ Customer:
• leading consumer utility company with tons and
tons of users
๏ Goal:
• comprehensive access control administration
for customers
๏ Benefits:
• Flexible and dynamic architecture
• Exceptional performance
• Extensible data model supports new
applications and features
• Low cost
95
• A Reliable access control administration system for
5 million customers, subscriptions and agreements
• Complex dependencies between groups, companies,
individuals, accounts, products, subscriptions, services and
agreements
• Broad and deep graphs (master customers with 1000s of
customers, subscriptions & agreements)
name: Andreas
subscription: sports
service: NFL
account: 9758352794
agreement: ultimate
owns
subscribes to
has plan
includes
provides group: graphistas
promotion: fall
member of
offered
discounts
company: Neo
Technologyworks with
gets discount on
subscription: local
subscribes to
provides service: Ravens
includes
Samstag, 31. August 13](https://image.slidesharecdn.com/webinardatamodelingnew-130830215355-phpapp02/75/Data-Modeling-with-Neo4j-133-2048.jpg)
![[B] Timely Recommendations
96
Samstag, 31. August 13](https://image.slidesharecdn.com/webinardatamodelingnew-130830215355-phpapp02/75/Data-Modeling-with-Neo4j-134-2048.jpg)
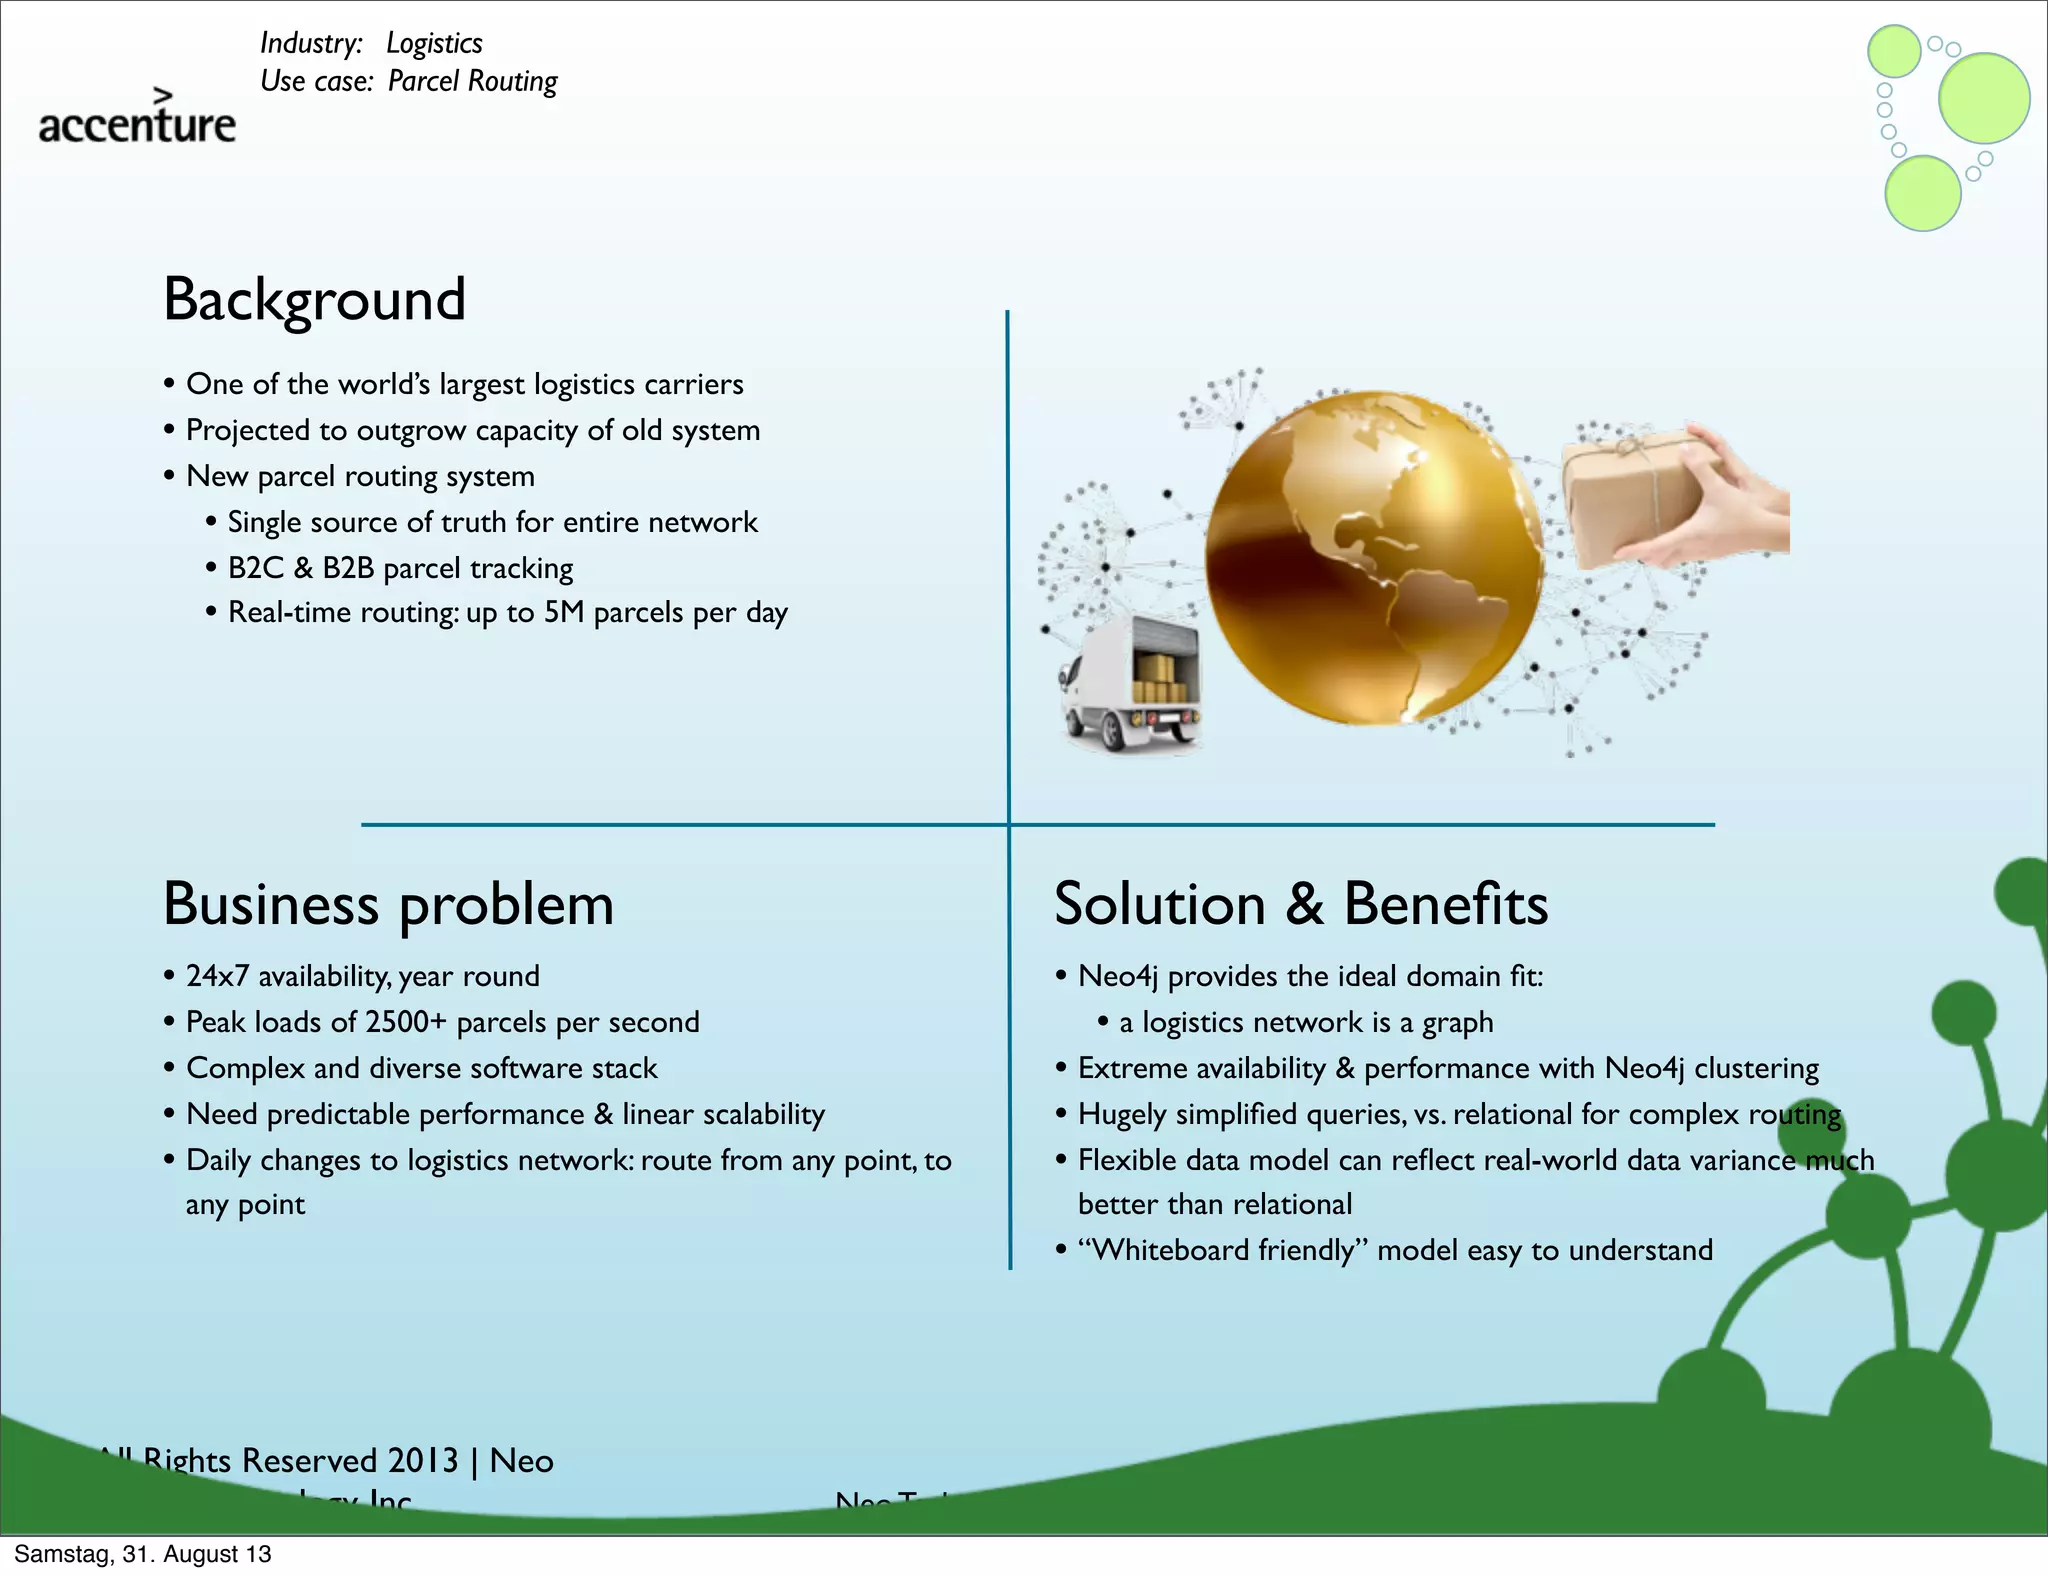
![[B] Timely Recommendations
๏ Customer:
• a professional social network
• 35 millions users, adding 30,000+ each day
๏ Goal: up-to-date recommendations
• Scalable solution with real-time end-user
experience
• Low maintenance and reliable architecture
• 8-week implementation
96
Samstag, 31. August 13](https://image.slidesharecdn.com/webinardatamodelingnew-130830215355-phpapp02/75/Data-Modeling-with-Neo4j-135-2048.jpg)
![[B] Timely Recommendations
๏ Customer:
• a professional social network
• 35 millions users, adding 30,000+ each day
๏ Goal: up-to-date recommendations
• Scalable solution with real-time end-user
experience
• Low maintenance and reliable architecture
• 8-week implementation
96
๏ Problem:
• Real-time recommendation imperative to attract new
users and maintain positive user retention
• Clustered MySQL solution not scalable or fast enough
to support real-time requirements
๏ Upgrade from running a batch job
• initial hour-long batch job
• but then success happened, and it became a day
• then two days
๏ With Neo4j, real time recommendations
Samstag, 31. August 13](https://image.slidesharecdn.com/webinardatamodelingnew-130830215355-phpapp02/75/Data-Modeling-with-Neo4j-136-2048.jpg)
![[B] Timely Recommendations
๏ Customer:
• a professional social network
• 35 millions users, adding 30,000+ each day
๏ Goal: up-to-date recommendations
• Scalable solution with real-time end-user
experience
• Low maintenance and reliable architecture
• 8-week implementation
96
๏ Problem:
• Real-time recommendation imperative to attract new
users and maintain positive user retention
• Clustered MySQL solution not scalable or fast enough
to support real-time requirements
๏ Upgrade from running a batch job
• initial hour-long batch job
• but then success happened, and it became a day
• then two days
๏ With Neo4j, real time recommendations
name:Andreas
job: talking
name: Allison
job: plumber
name: Tobias
job: coding
knows
knows
name: Peter
job: building
name: Emil
job: plumber
knows
name: Stephen
job: DJ
knows
knows
name: Delia
job: barking
knows
knows
name: Tiberius
job: dancer
knows
knows
knows
knows
Samstag, 31. August 13](https://image.slidesharecdn.com/webinardatamodelingnew-130830215355-phpapp02/75/Data-Modeling-with-Neo4j-137-2048.jpg)
![[C] Collaboration on Global Scale
97
Samstag, 31. August 13](https://image.slidesharecdn.com/webinardatamodelingnew-130830215355-phpapp02/75/Data-Modeling-with-Neo4j-138-2048.jpg)
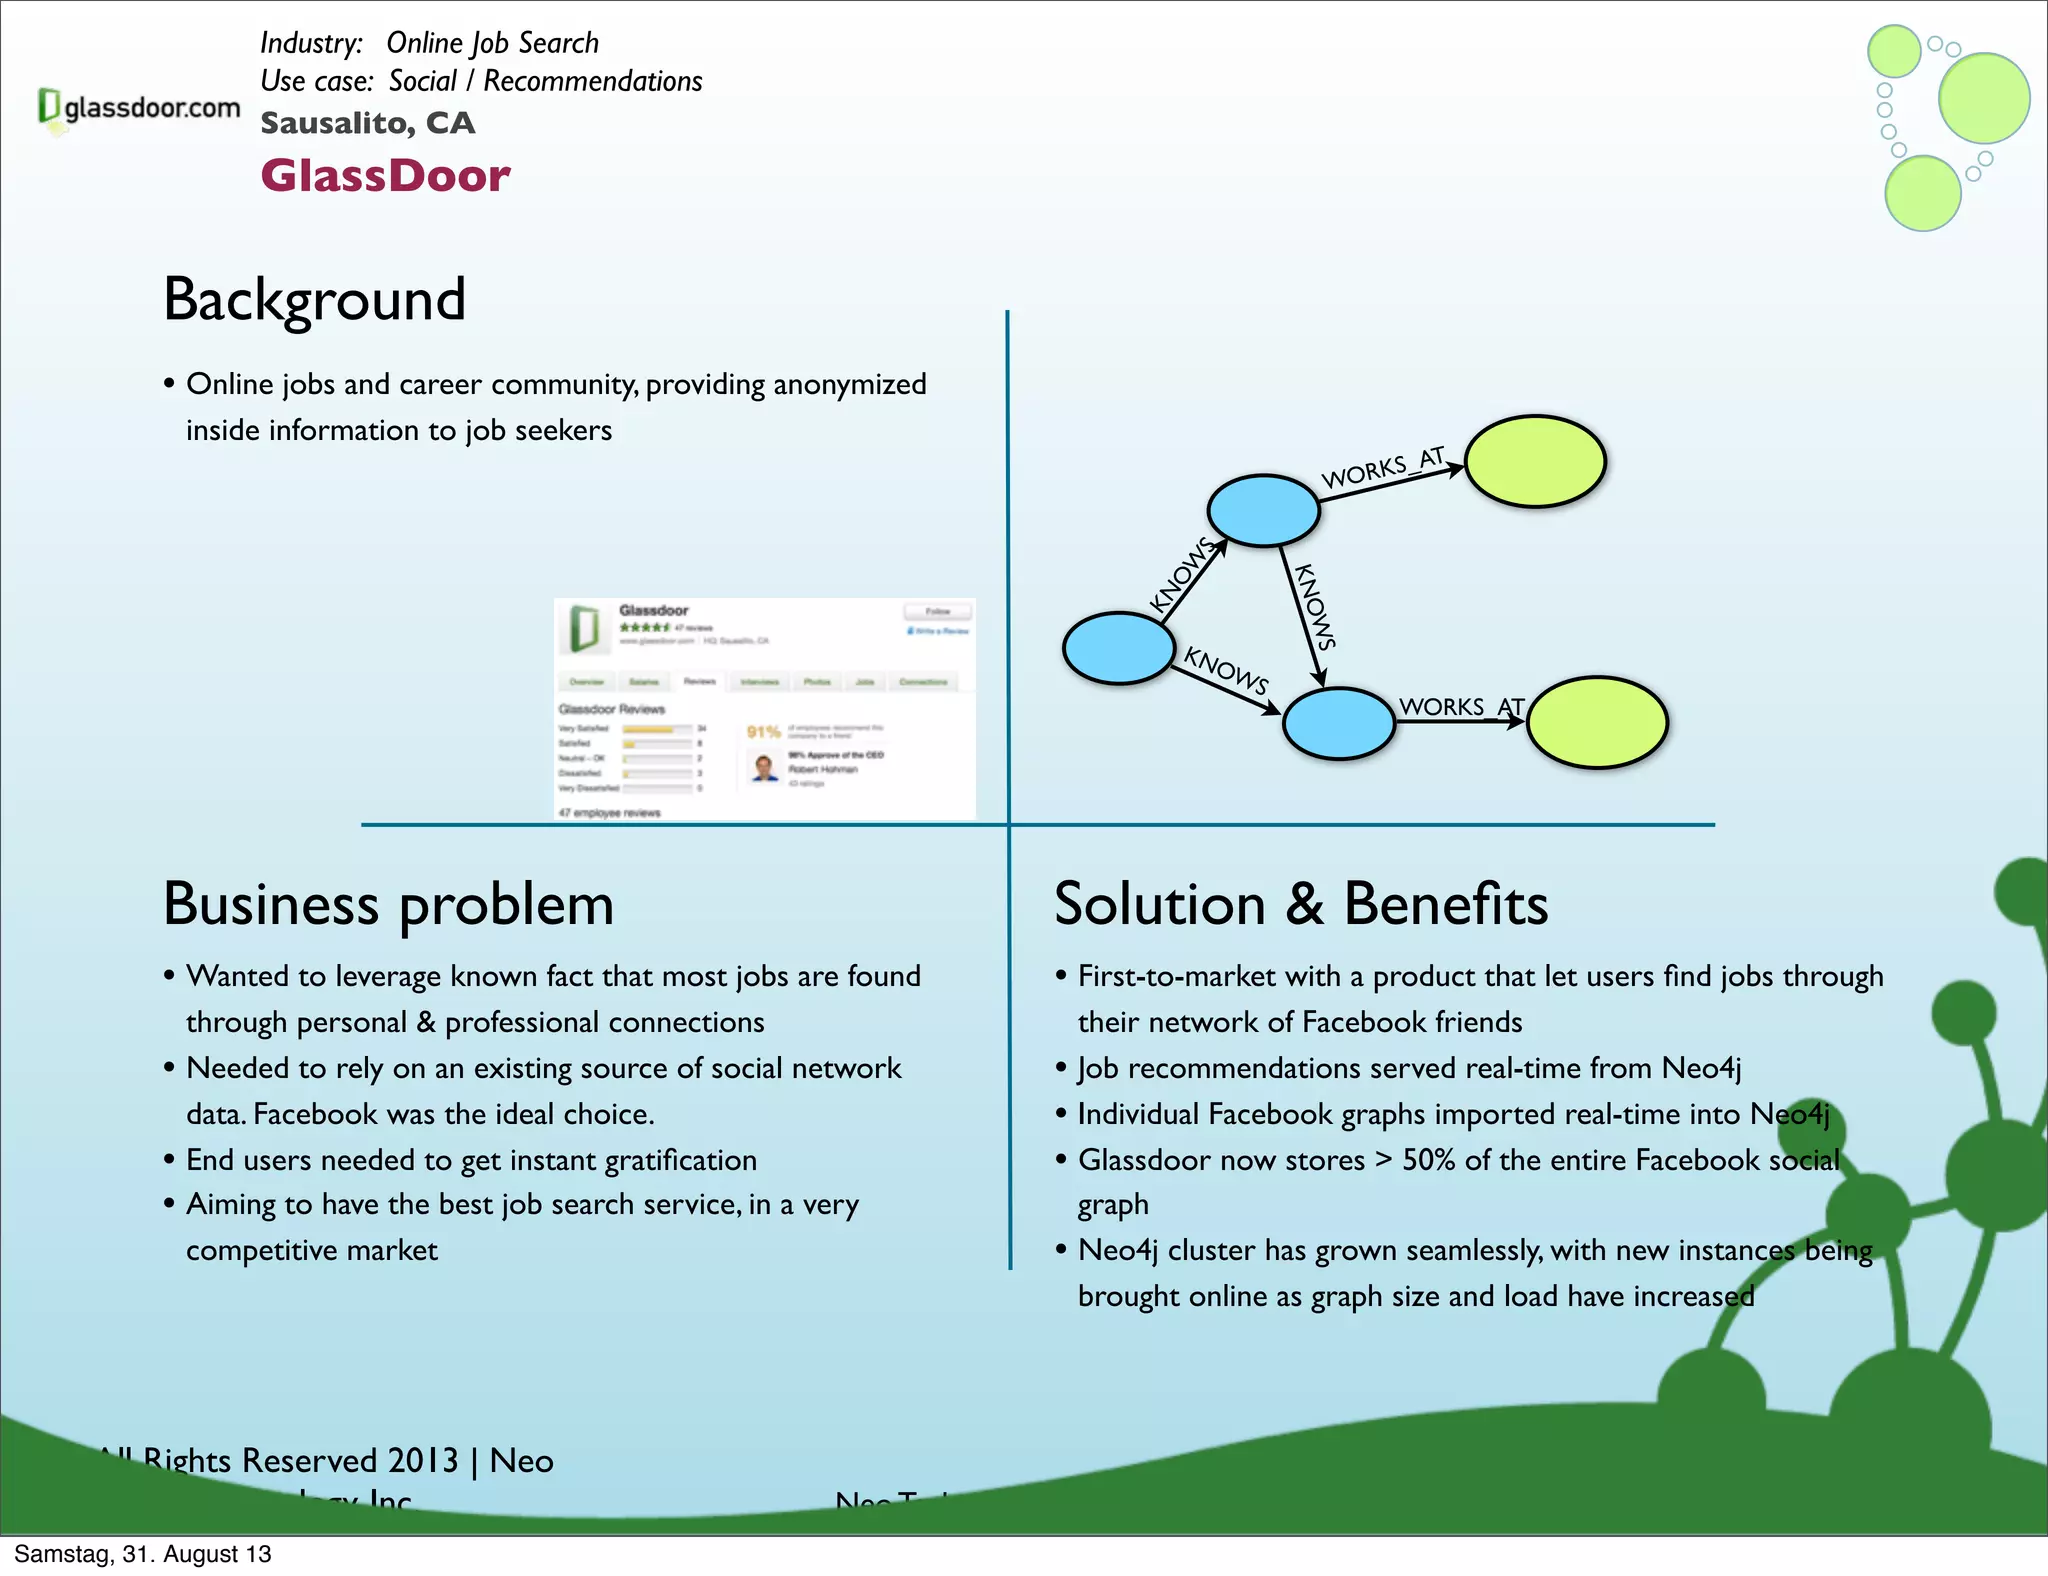
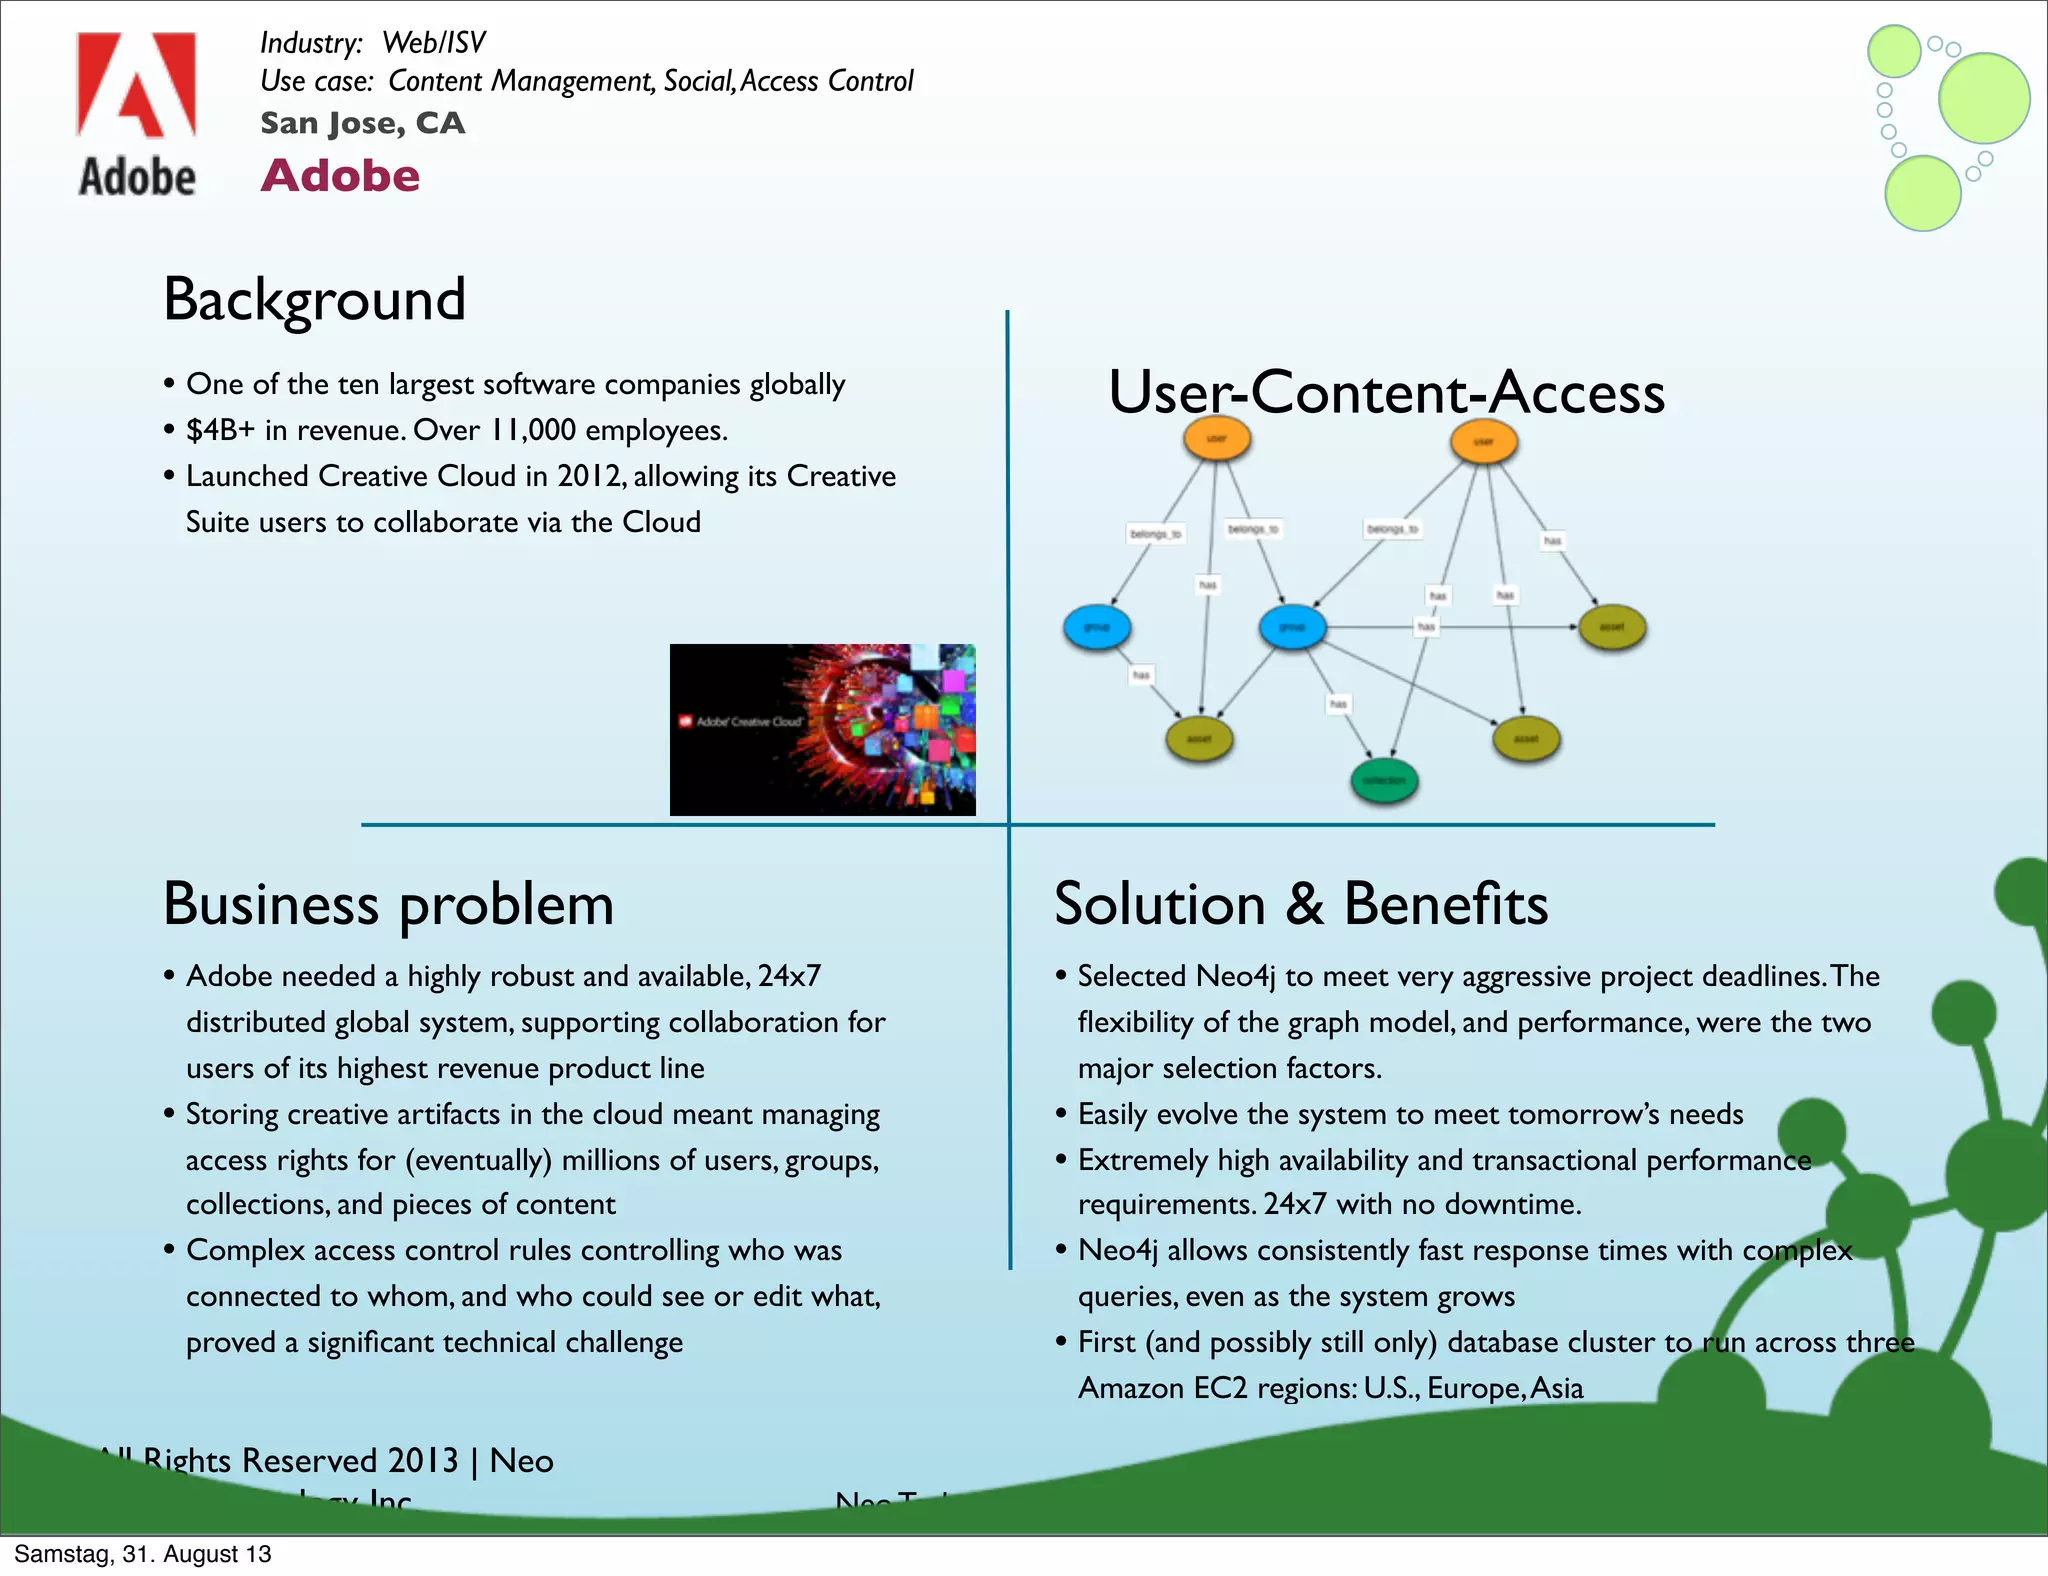
![[C] Collaboration on Global Scale
๏ Customer: a worldwide software leader
• highly collaborative end-users
๏ Goal: offer an online platform for global collaboration
• Highly flexible data analysis
• Sub-second results for large, densely-connected data
• User experience - competitive advantage
97
Samstag, 31. August 13](https://image.slidesharecdn.com/webinardatamodelingnew-130830215355-phpapp02/75/Data-Modeling-with-Neo4j-139-2048.jpg)
![[C] Collaboration on Global Scale
๏ Customer: a worldwide software leader
• highly collaborative end-users
๏ Goal: offer an online platform for global collaboration
• Highly flexible data analysis
• Sub-second results for large, densely-connected data
• User experience - competitive advantage
97
• Massive amounts of data tied to members, user
groups, member content, etc. all interconnected
• Infer collaborative relationships through user-
generated content
• Worldwide Availability
Samstag, 31. August 13](https://image.slidesharecdn.com/webinardatamodelingnew-130830215355-phpapp02/75/Data-Modeling-with-Neo4j-140-2048.jpg)
![[C] Collaboration on Global Scale
๏ Customer: a worldwide software leader
• highly collaborative end-users
๏ Goal: offer an online platform for global collaboration
• Highly flexible data analysis
• Sub-second results for large, densely-connected data
• User experience - competitive advantage
97
• Massive amounts of data tied to members, user
groups, member content, etc. all interconnected
• Infer collaborative relationships through user-
generated content
• Worldwide Availability
Asia North America Europe
Samstag, 31. August 13](https://image.slidesharecdn.com/webinardatamodelingnew-130830215355-phpapp02/75/Data-Modeling-with-Neo4j-141-2048.jpg)
![[C] Collaboration on Global Scale
๏ Customer: a worldwide software leader
• highly collaborative end-users
๏ Goal: offer an online platform for global collaboration
• Highly flexible data analysis
• Sub-second results for large, densely-connected data
• User experience - competitive advantage
97
• Massive amounts of data tied to members, user
groups, member content, etc. all interconnected
• Infer collaborative relationships through user-
generated content
• Worldwide Availability
Asia North America Europe
Asia North America Europe
Samstag, 31. August 13](https://image.slidesharecdn.com/webinardatamodelingnew-130830215355-phpapp02/75/Data-Modeling-with-Neo4j-142-2048.jpg)

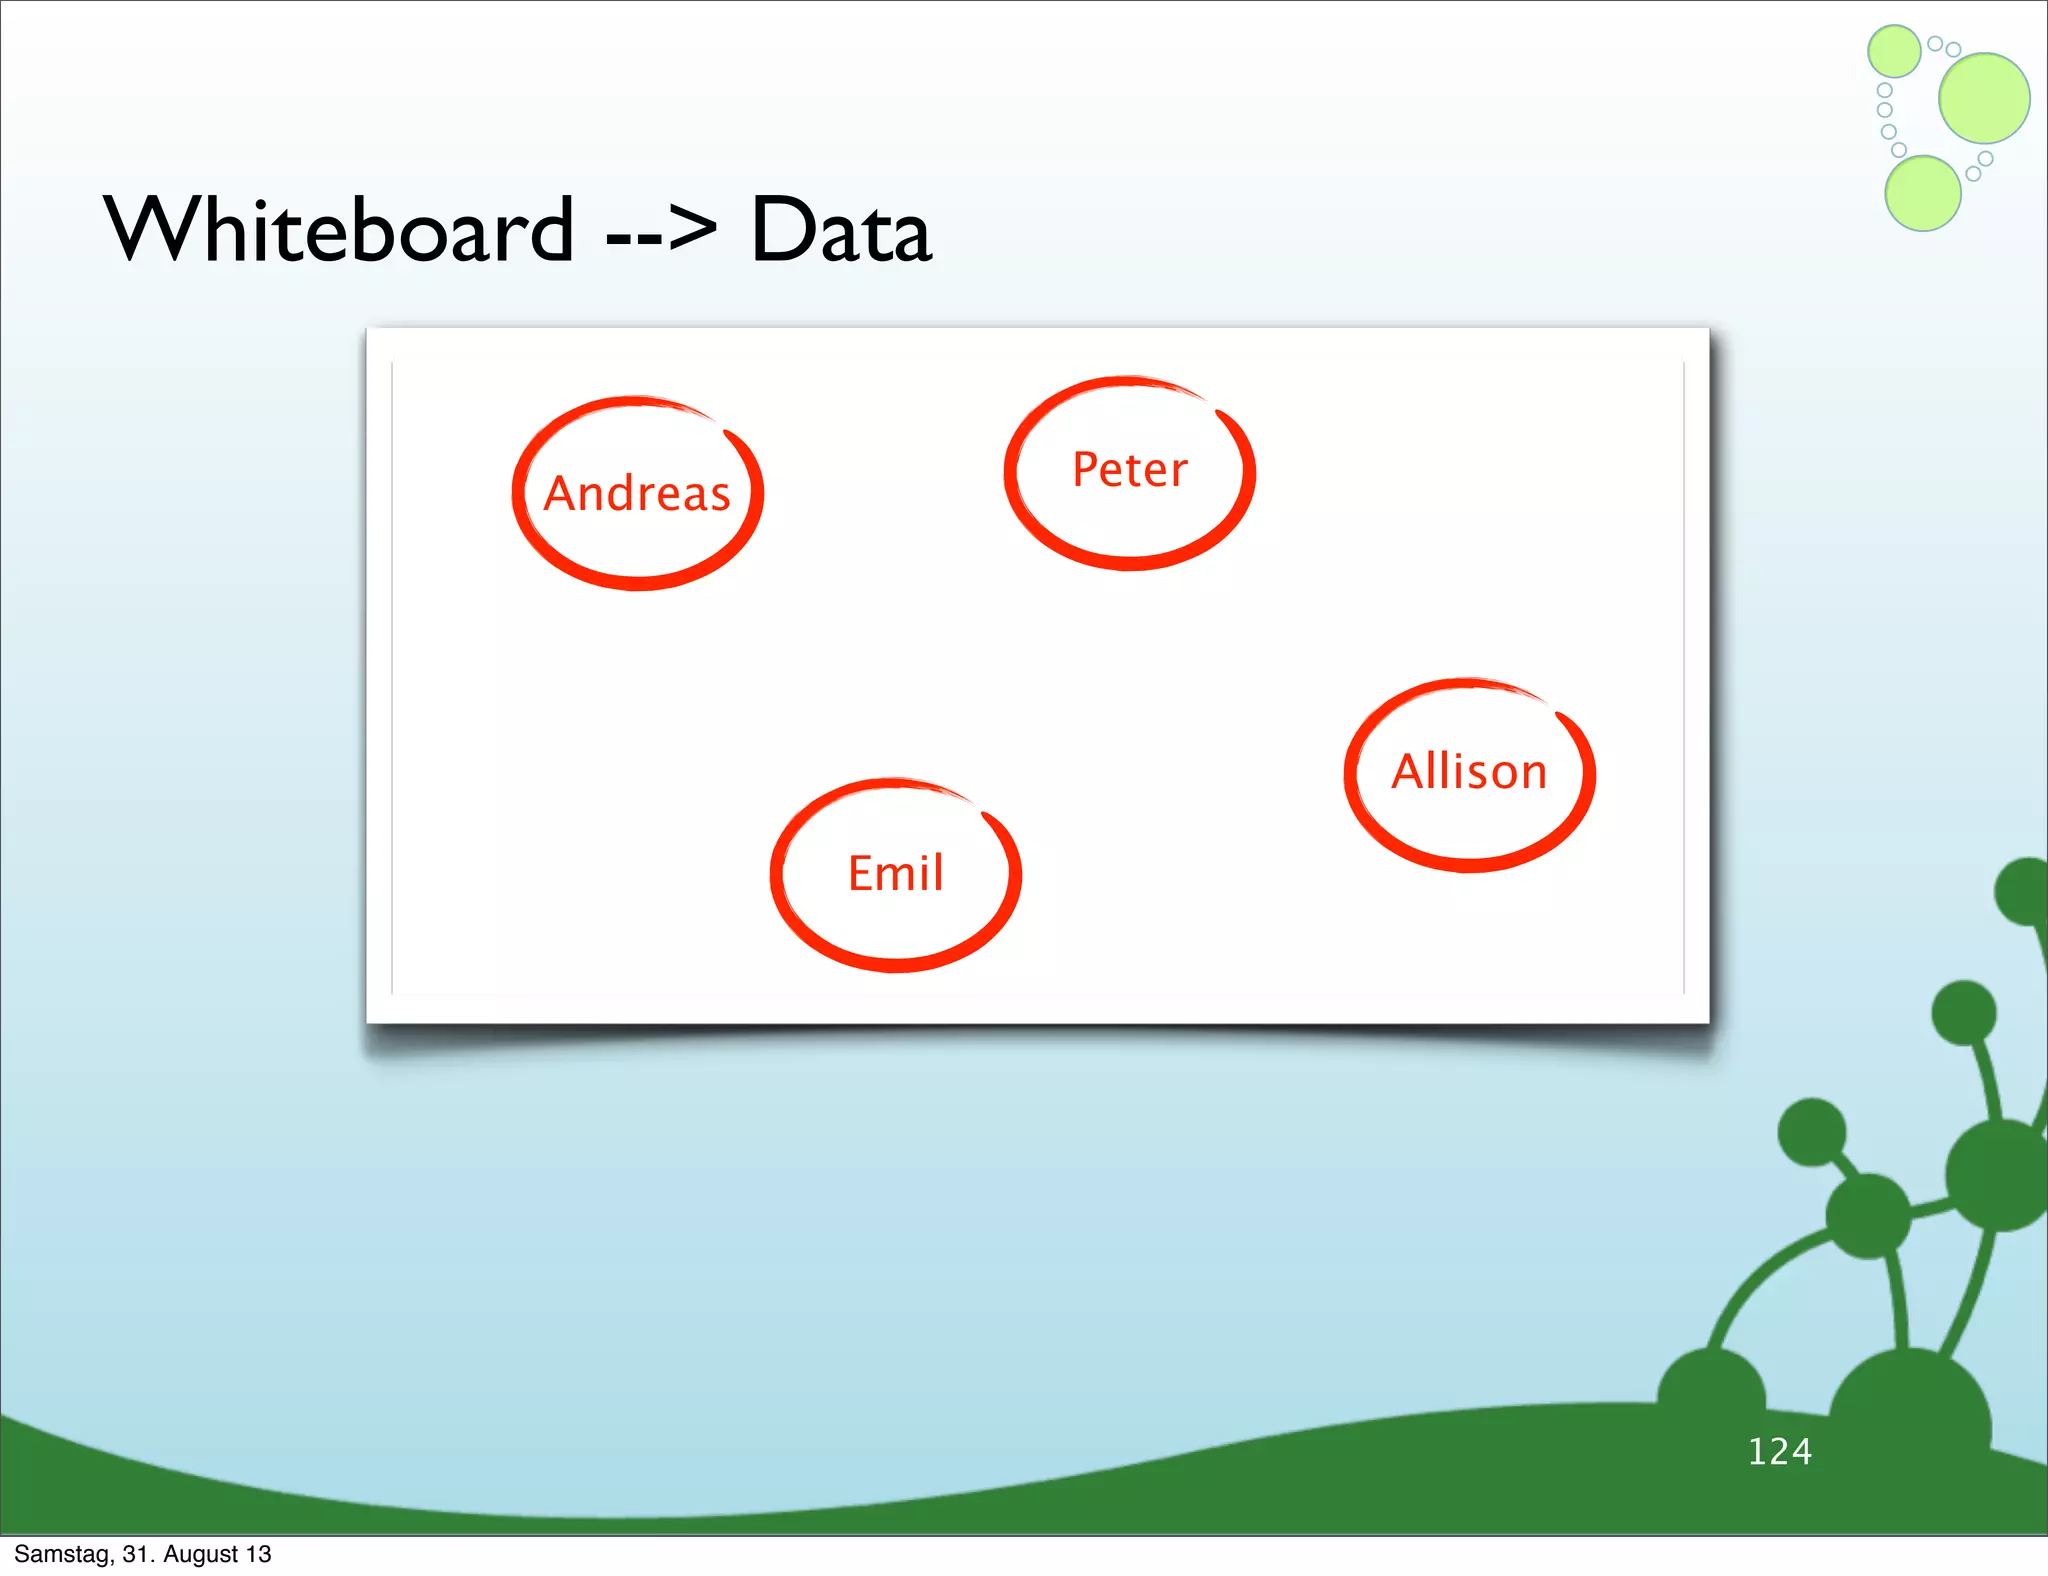
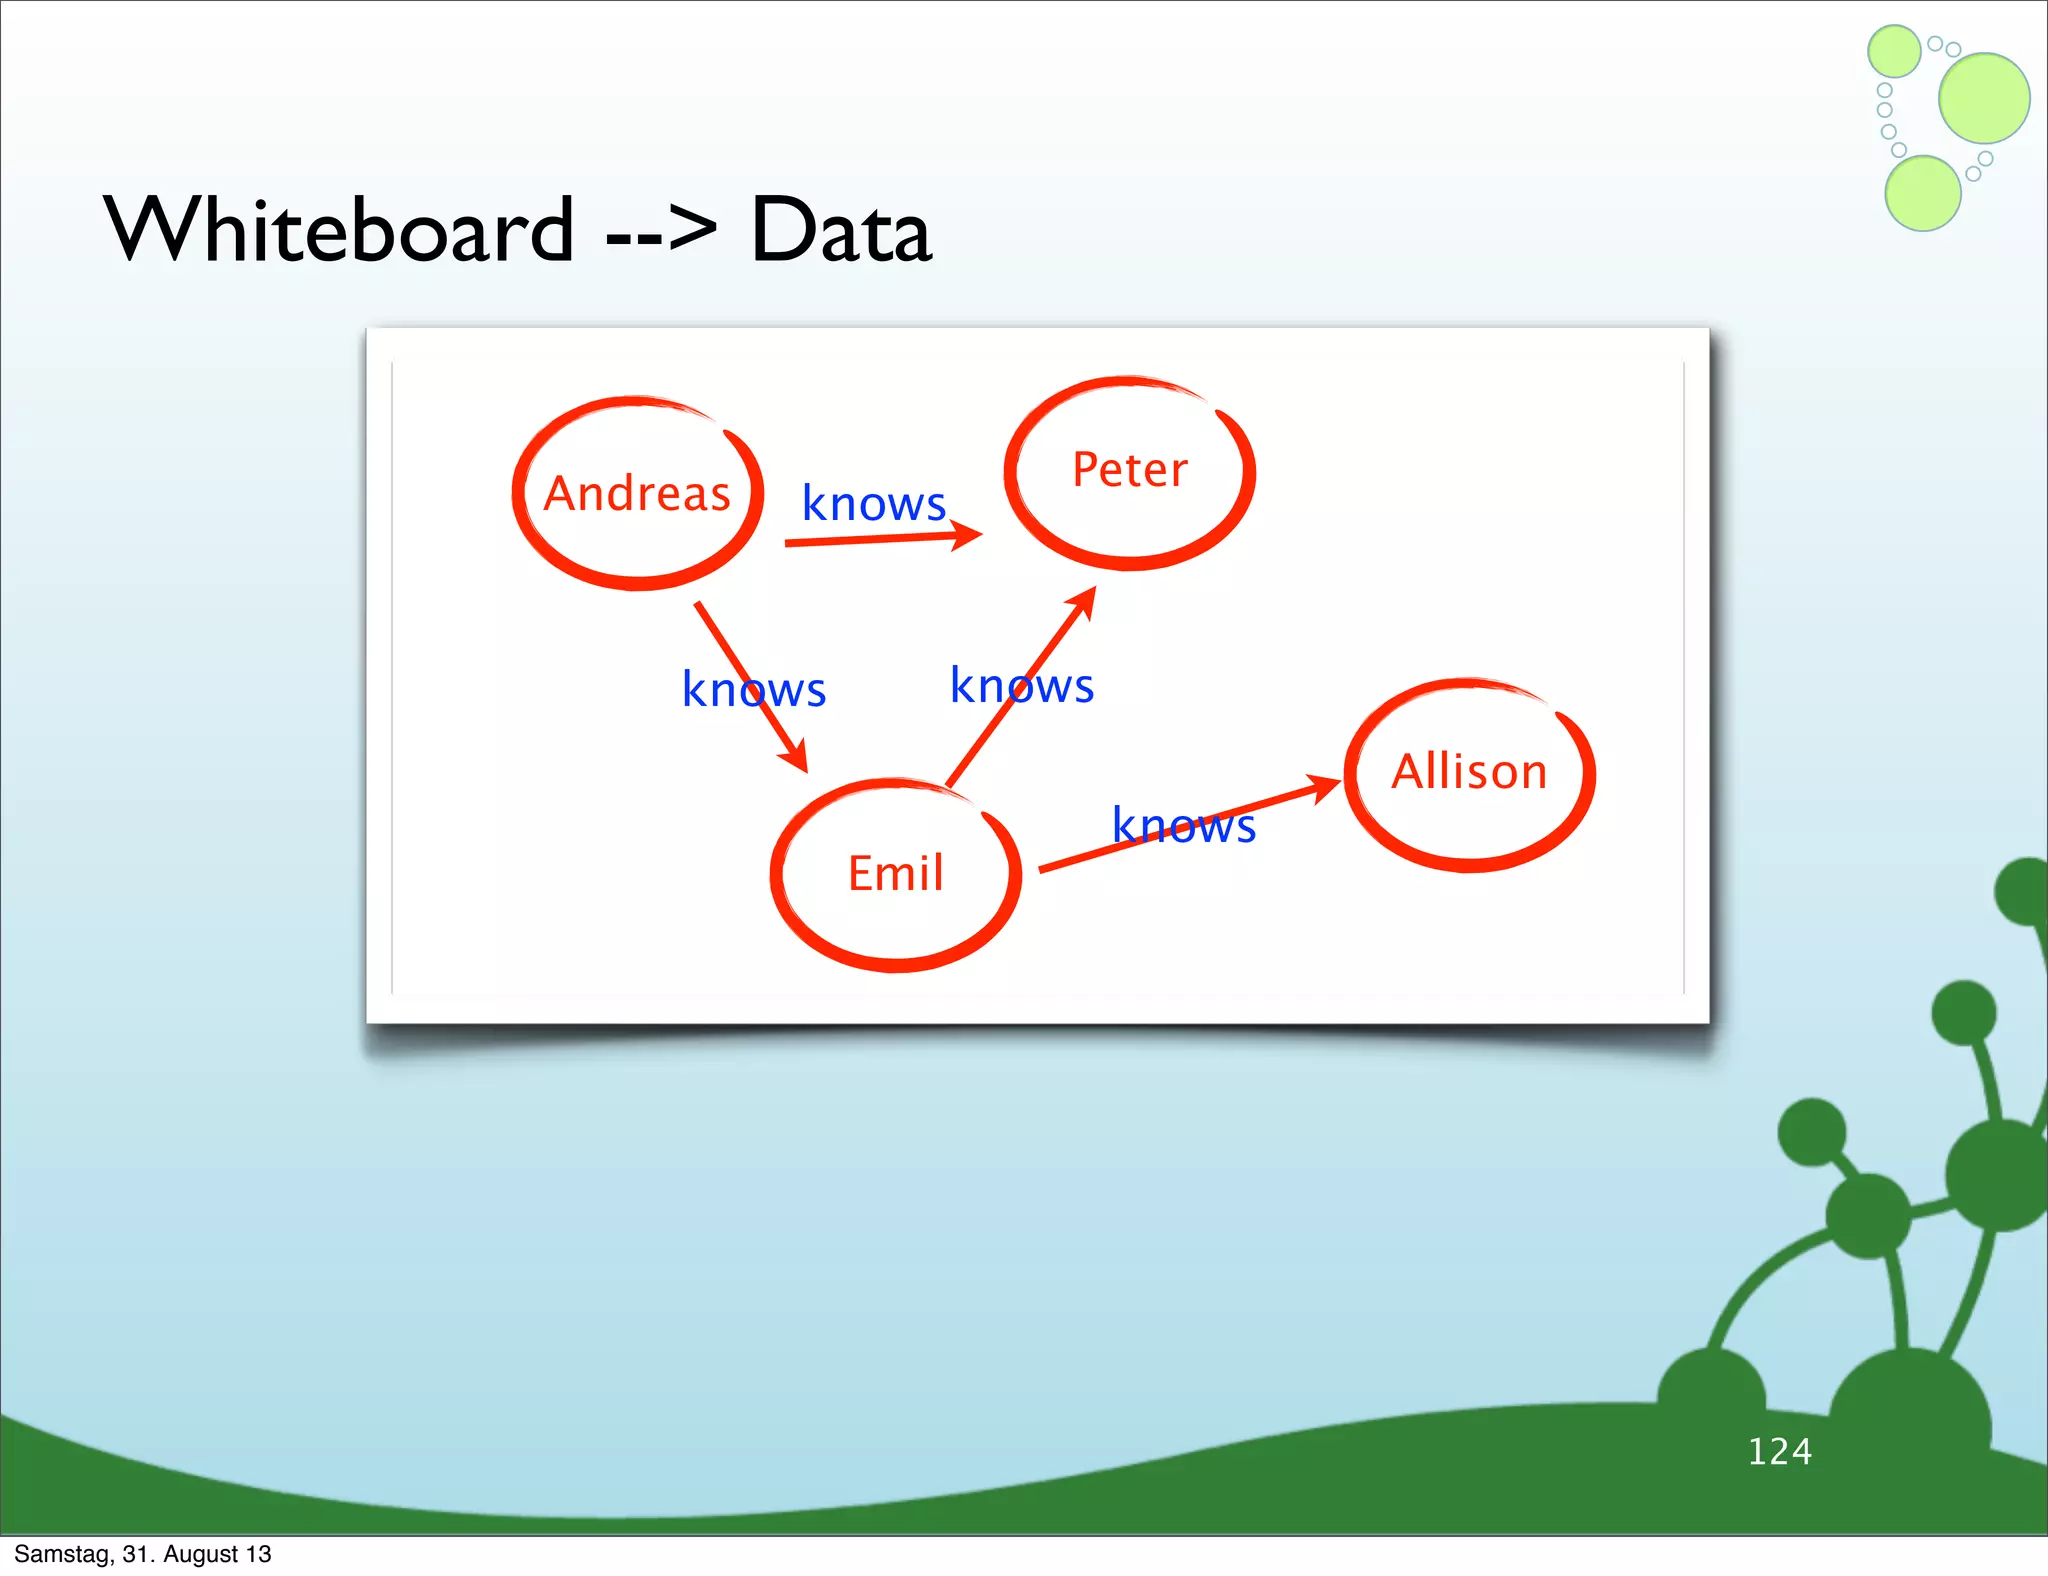
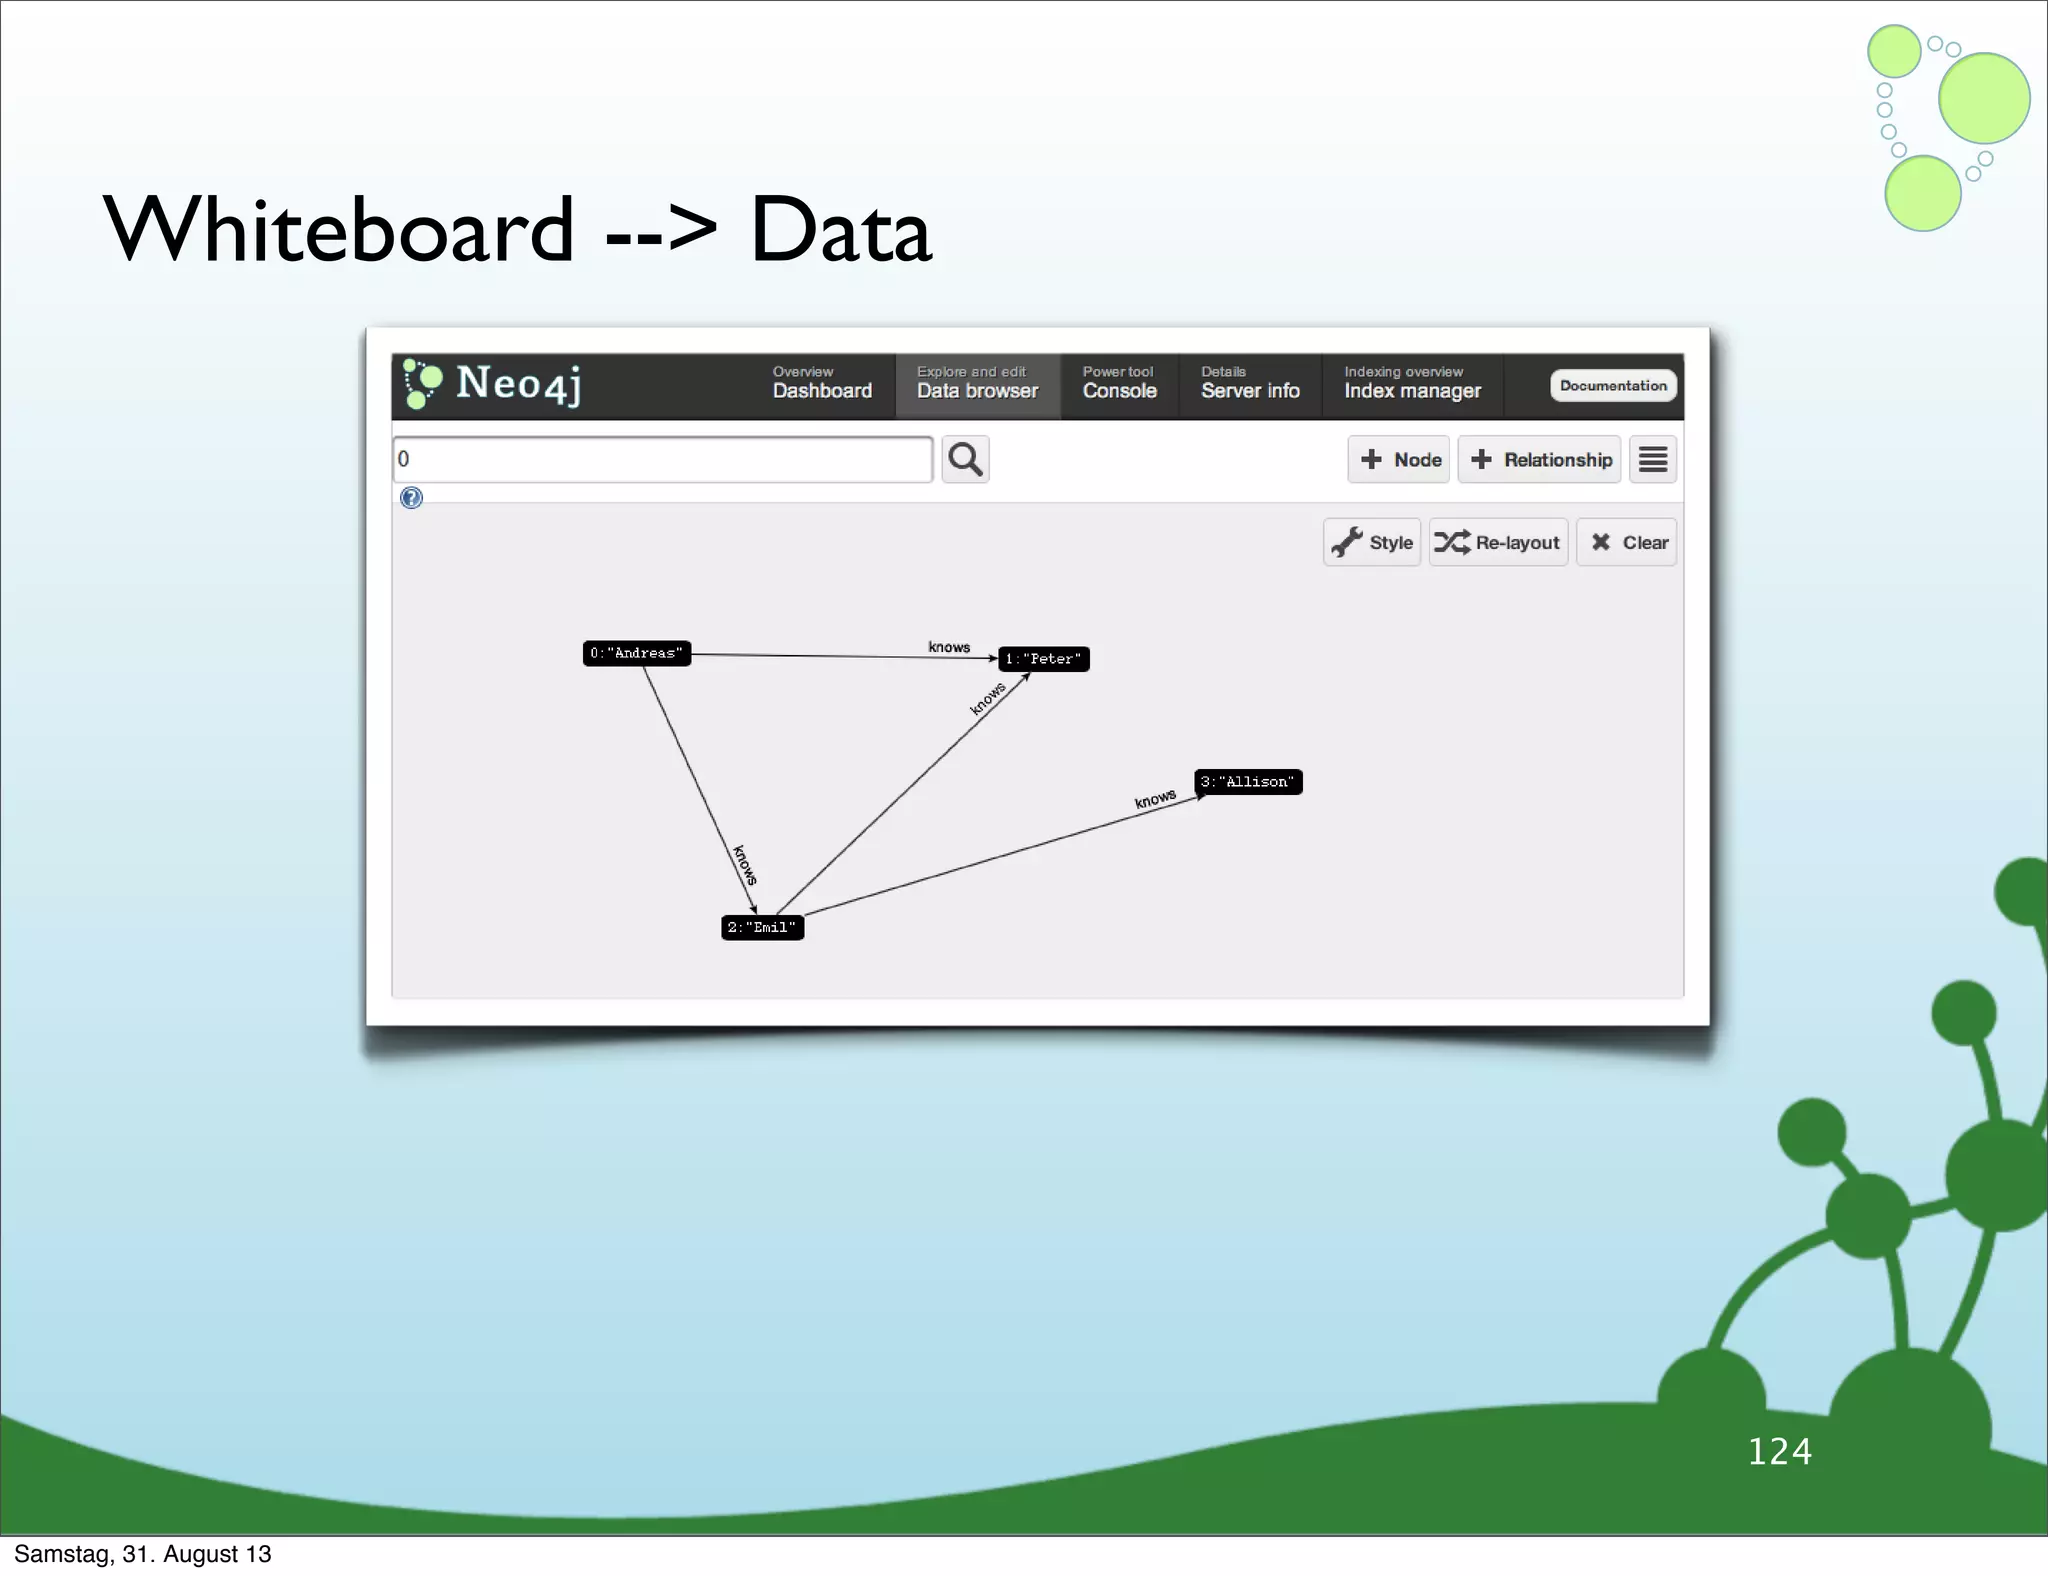
![Whiteboard --> Data
124
Andreas
Peter
Emil
Allison
knows
knows knows
knows
// Cypher query - friend of a friend
start n=node(0)
match (n)-->()-[:KNOWS|LIKES]->(foaf)
WHERE NOT((n)[:KNOWS]-->(foaf))
return foaf
Samstag, 31. August 13](https://image.slidesharecdn.com/webinardatamodelingnew-130830215355-phpapp02/75/Data-Modeling-with-Neo4j-180-2048.jpg)

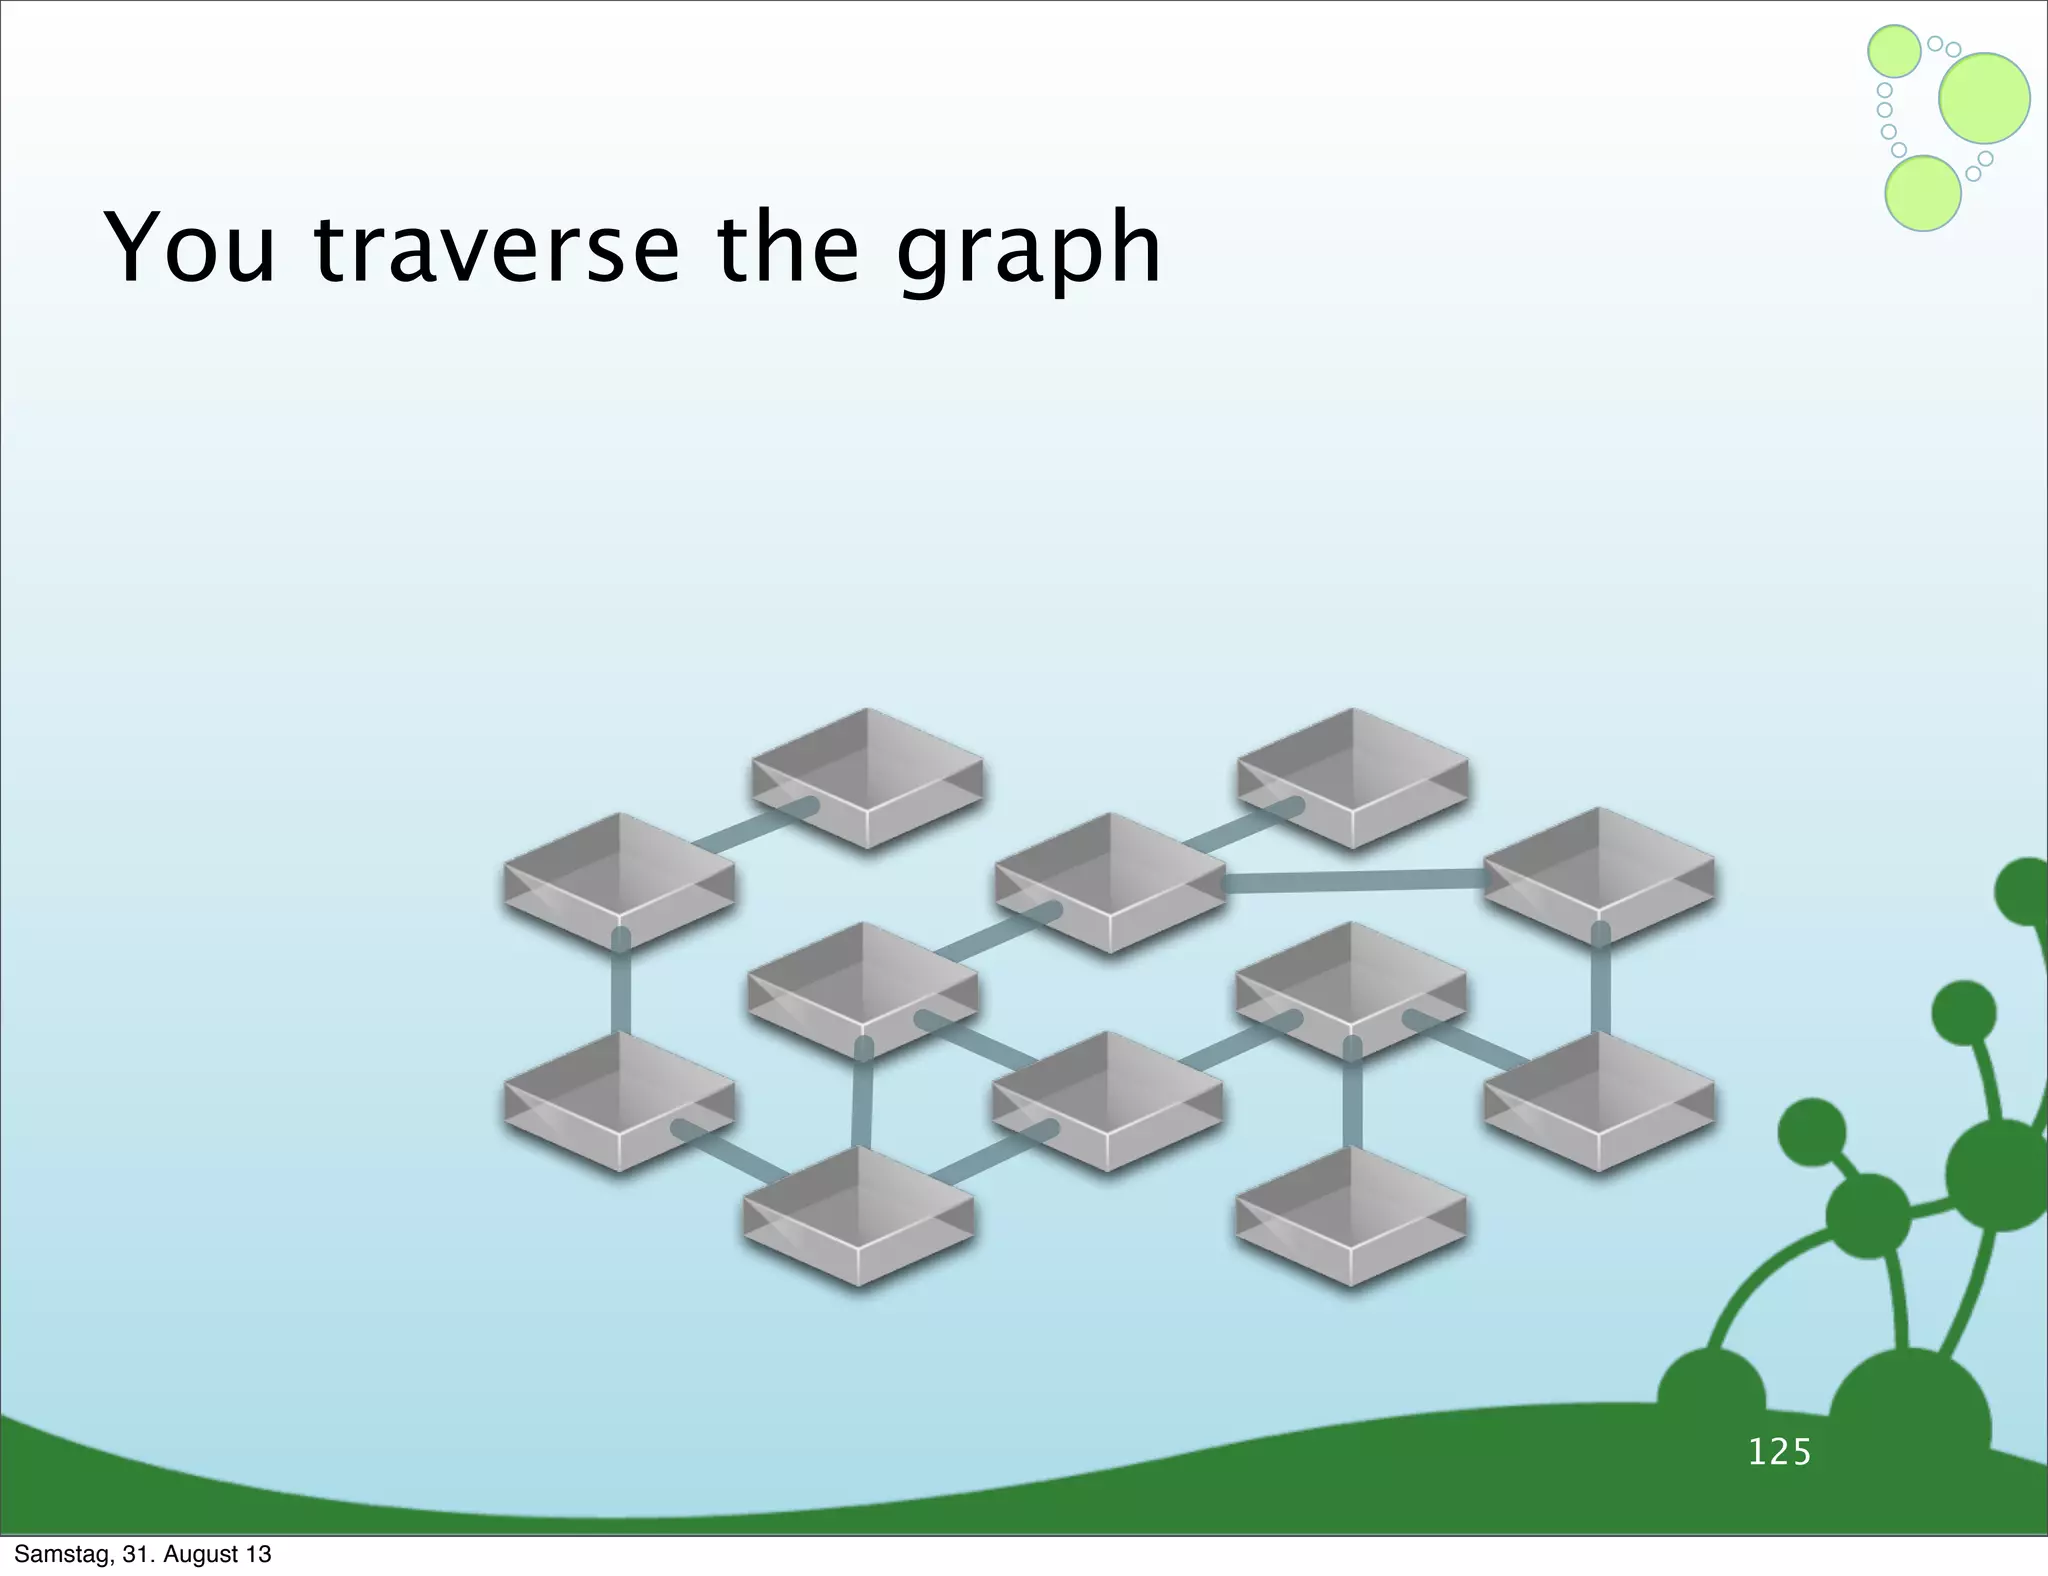
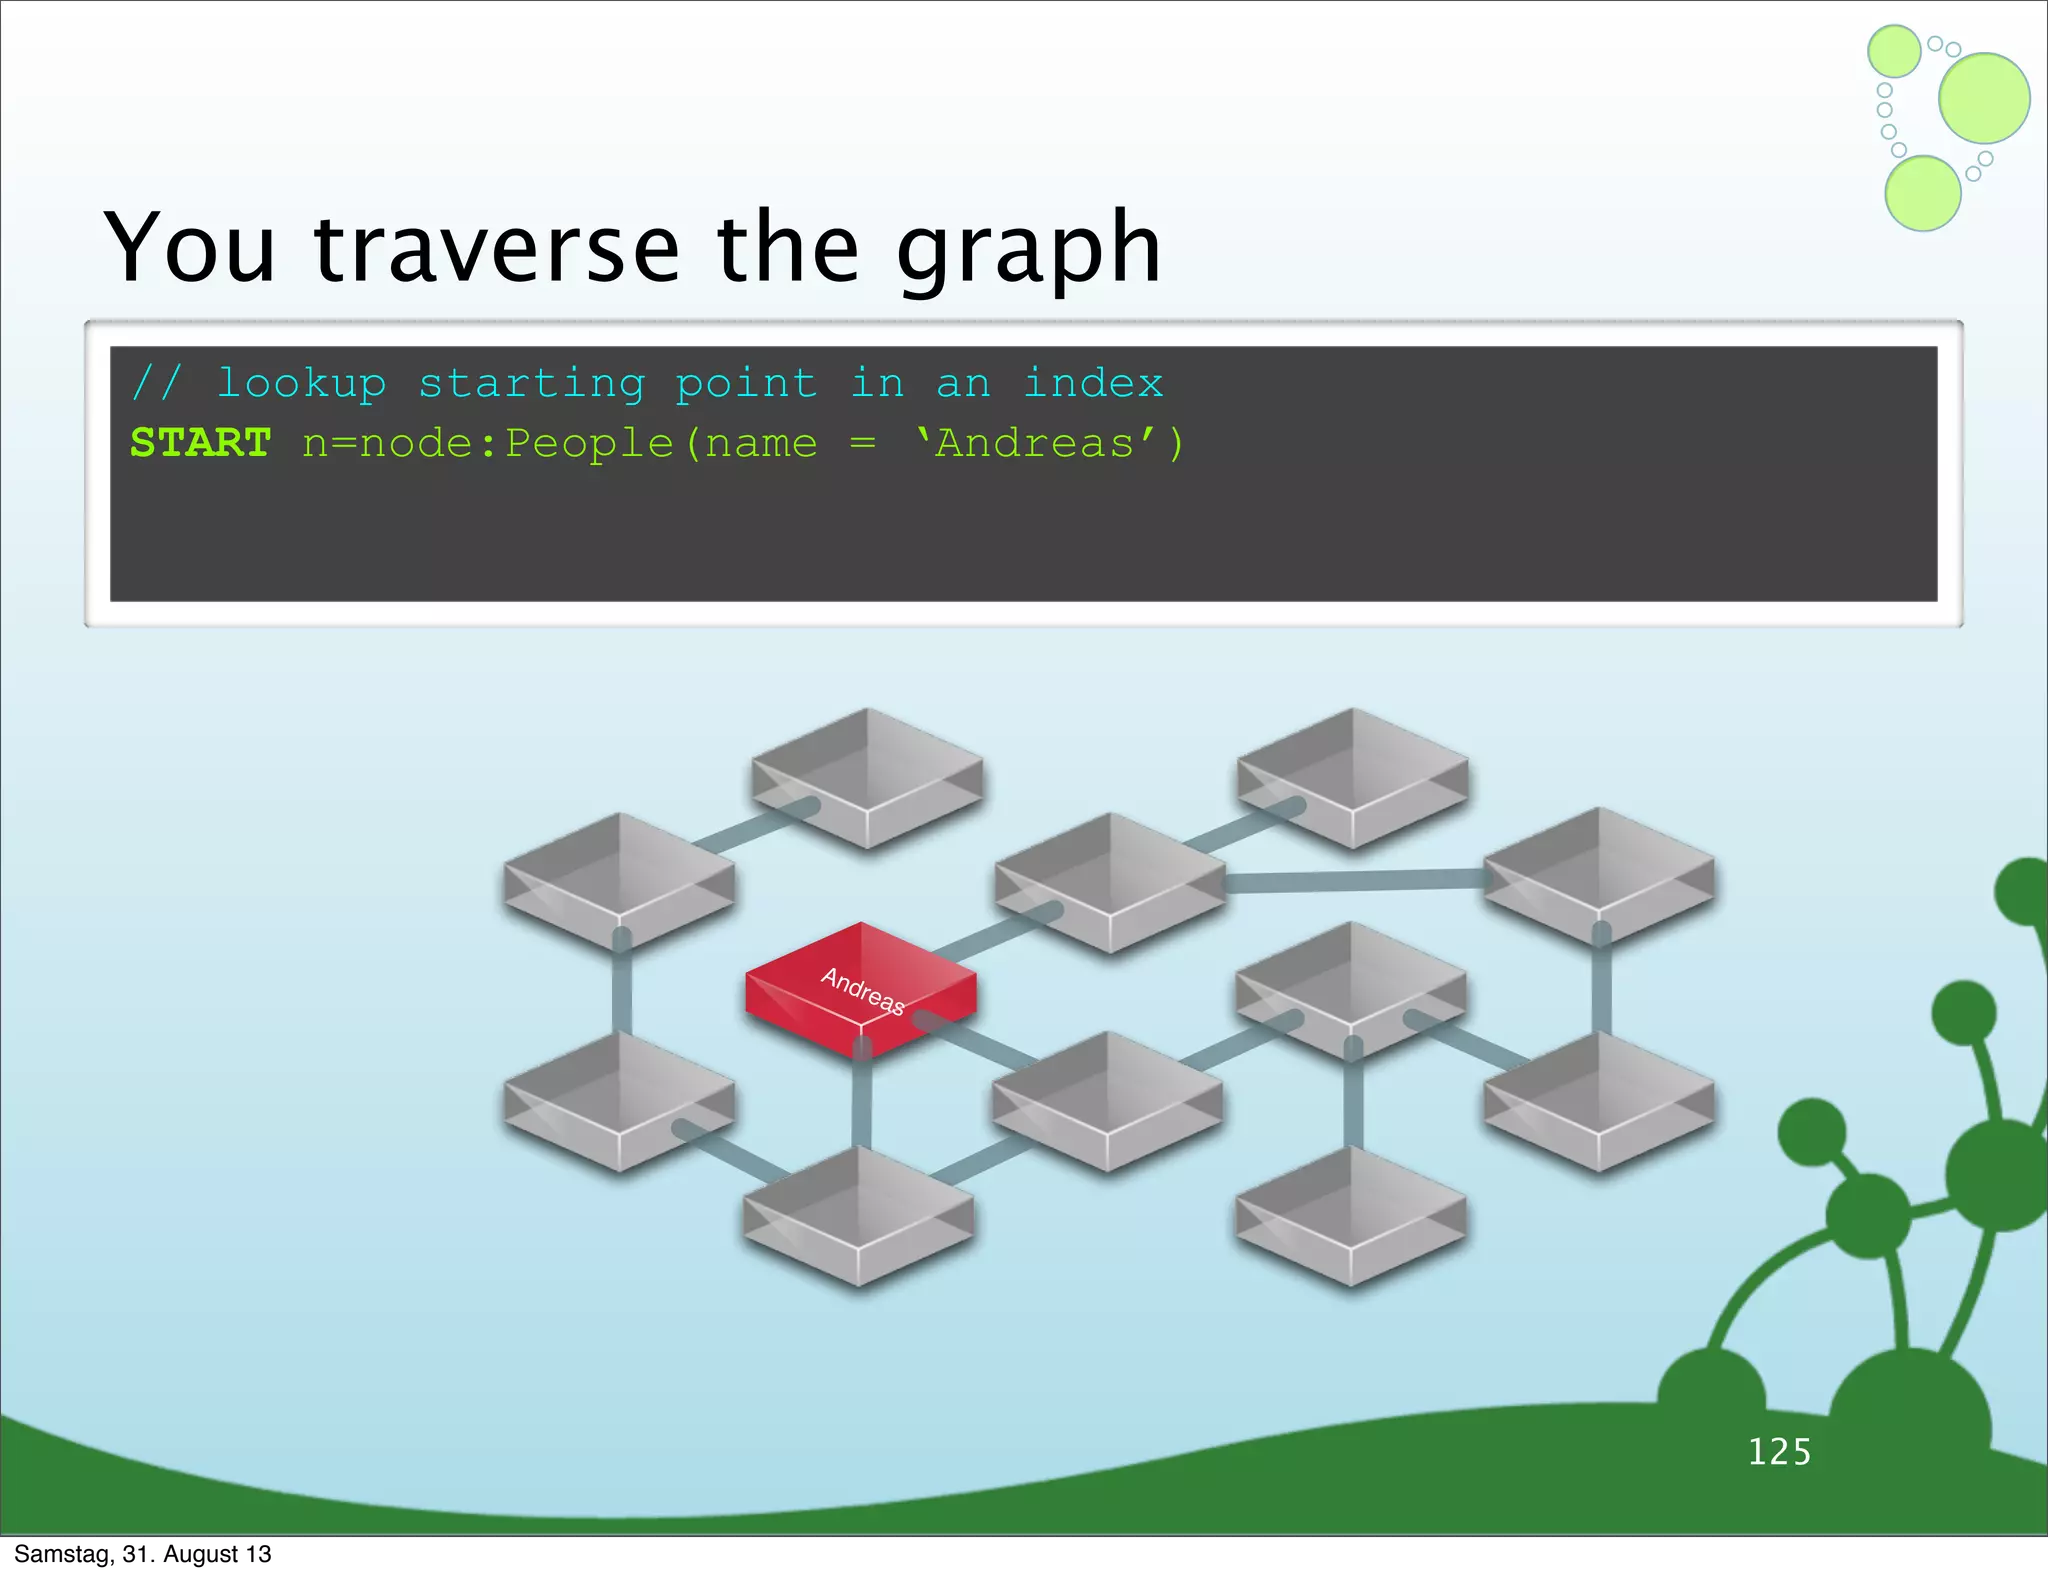
![// lookup starting point in an index
START n=node:People(name = ‘Andreas’)
Andreas
You traverse the graph
125
// then traverse to find results
START me=node:People(name = ‘Andreas’
MATCH (me)-[:FRIEND]-(friend)-[:FRIEND]-(friend2)
RETURN friend2
Samstag, 31. August 13](https://image.slidesharecdn.com/webinardatamodelingnew-130830215355-phpapp02/75/Data-Modeling-with-Neo4j-185-2048.jpg)

![SELECT skills.*, user_skill.*
FROM users
JOIN user_skill ON users.id = user_skill.user_id
JOIN skills ON user_skill.skill_id = skill.id WHERE users.id = 1
126
START user = node(1)
MATCH user -[user_skill]-> skill
RETURN skill, user_skill
Samstag, 31. August 13](https://image.slidesharecdn.com/webinardatamodelingnew-130830215355-phpapp02/75/Data-Modeling-with-Neo4j-187-2048.jpg)

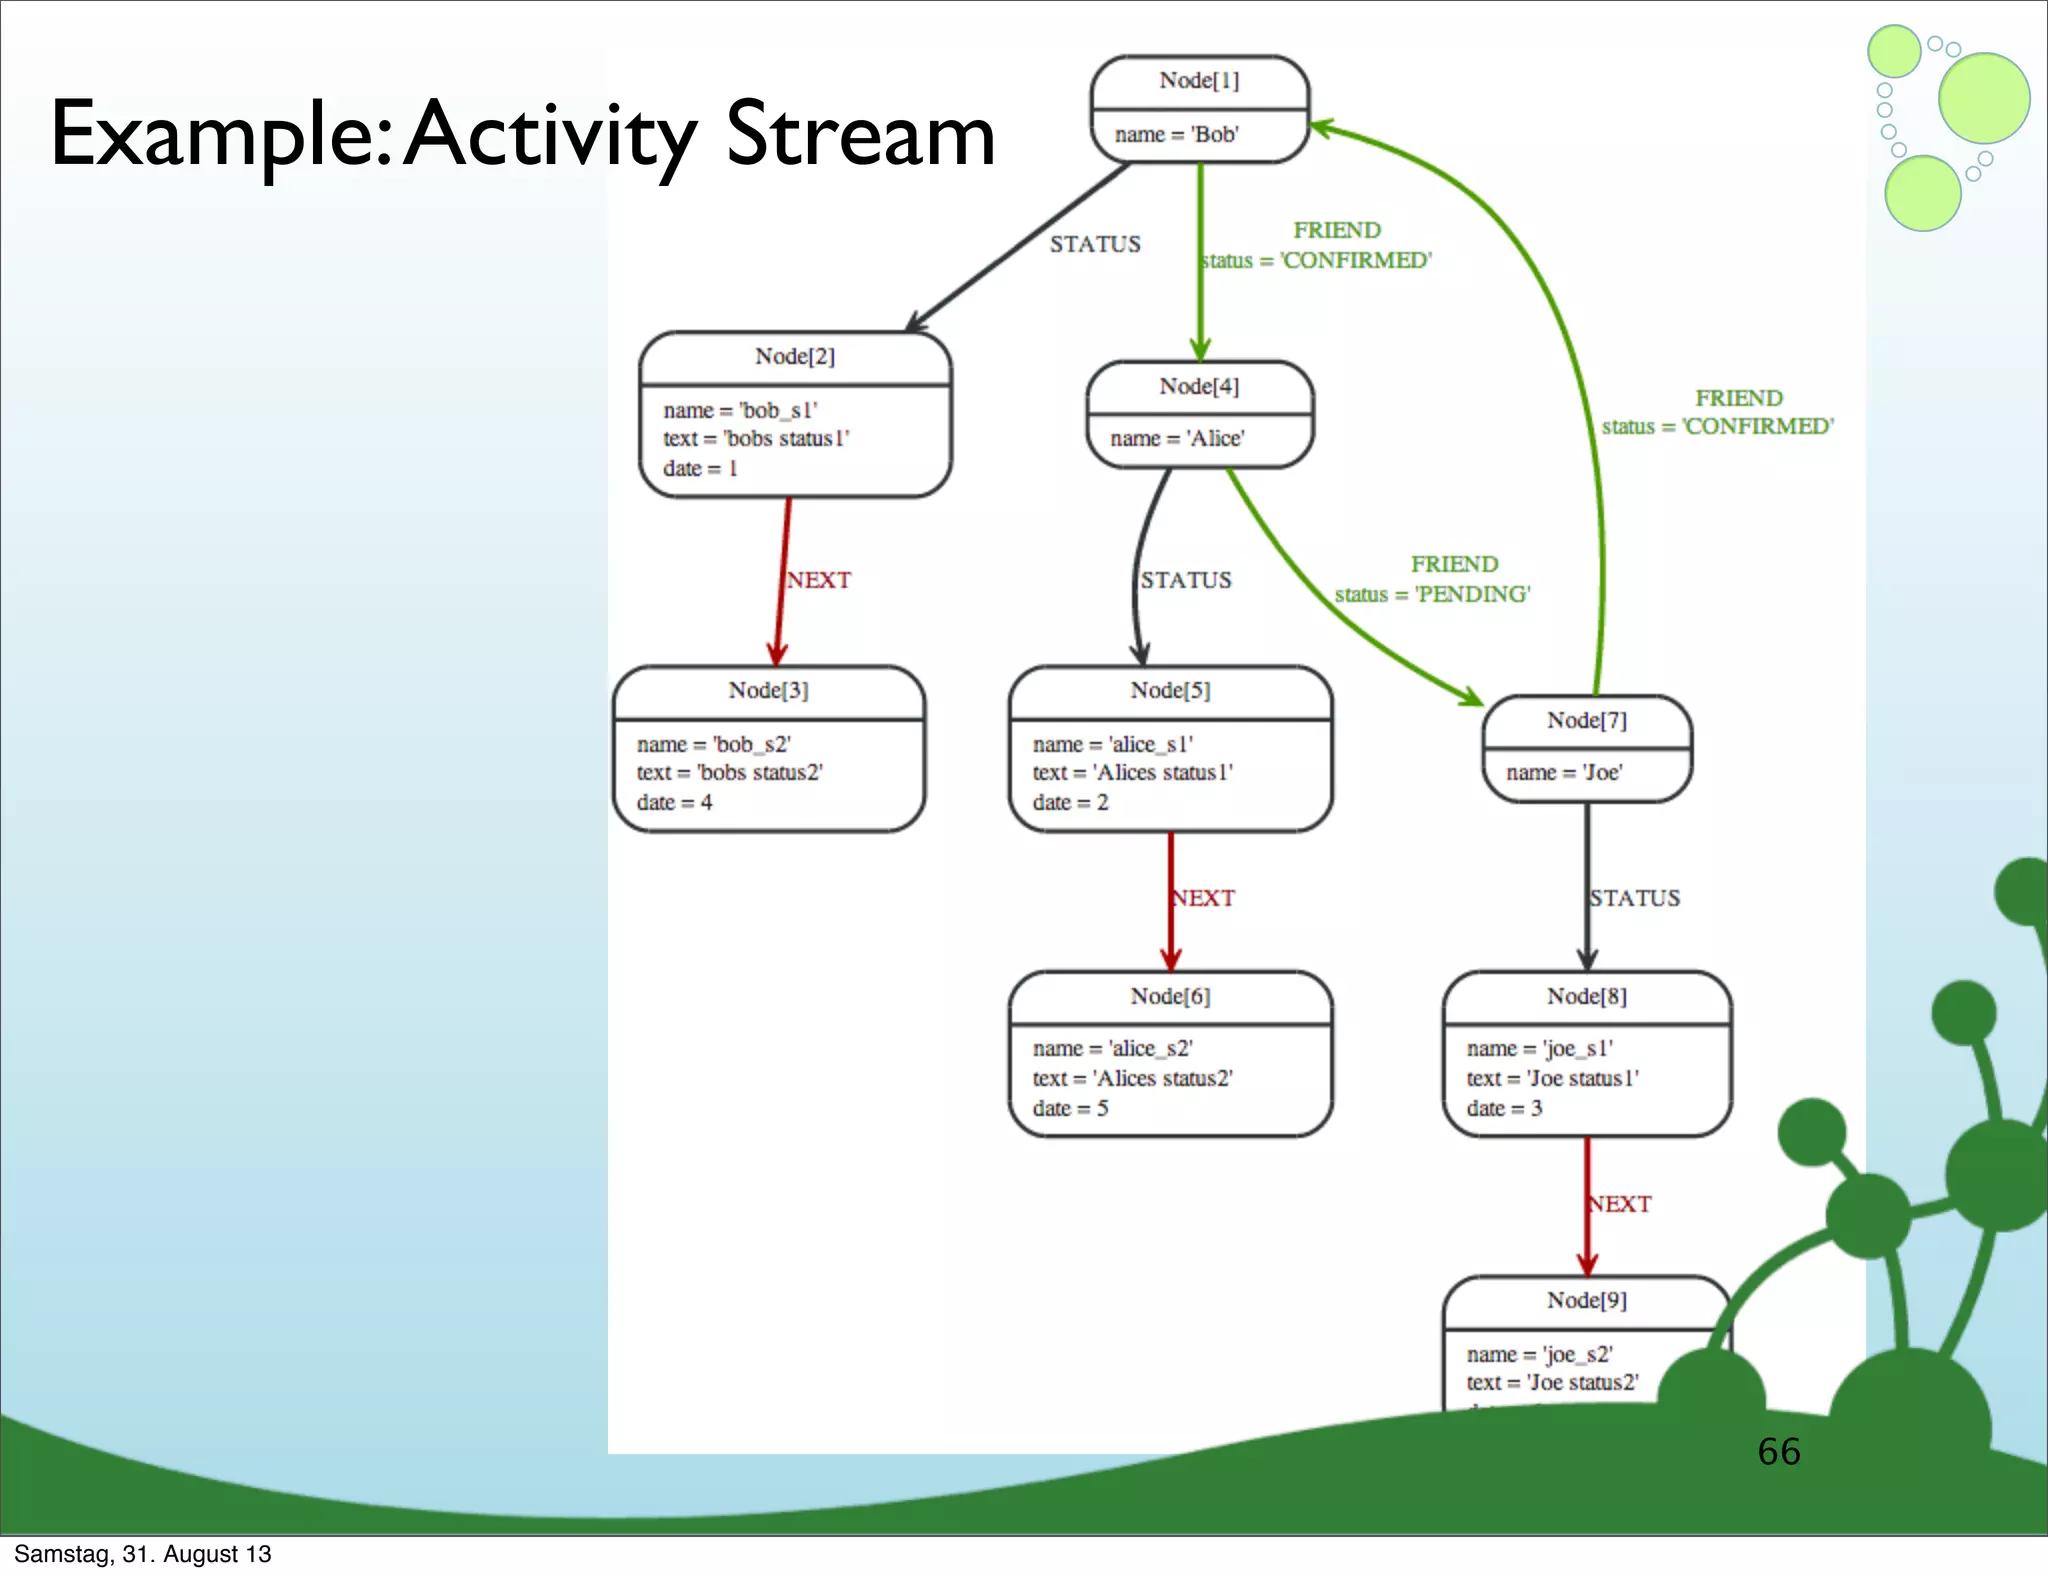
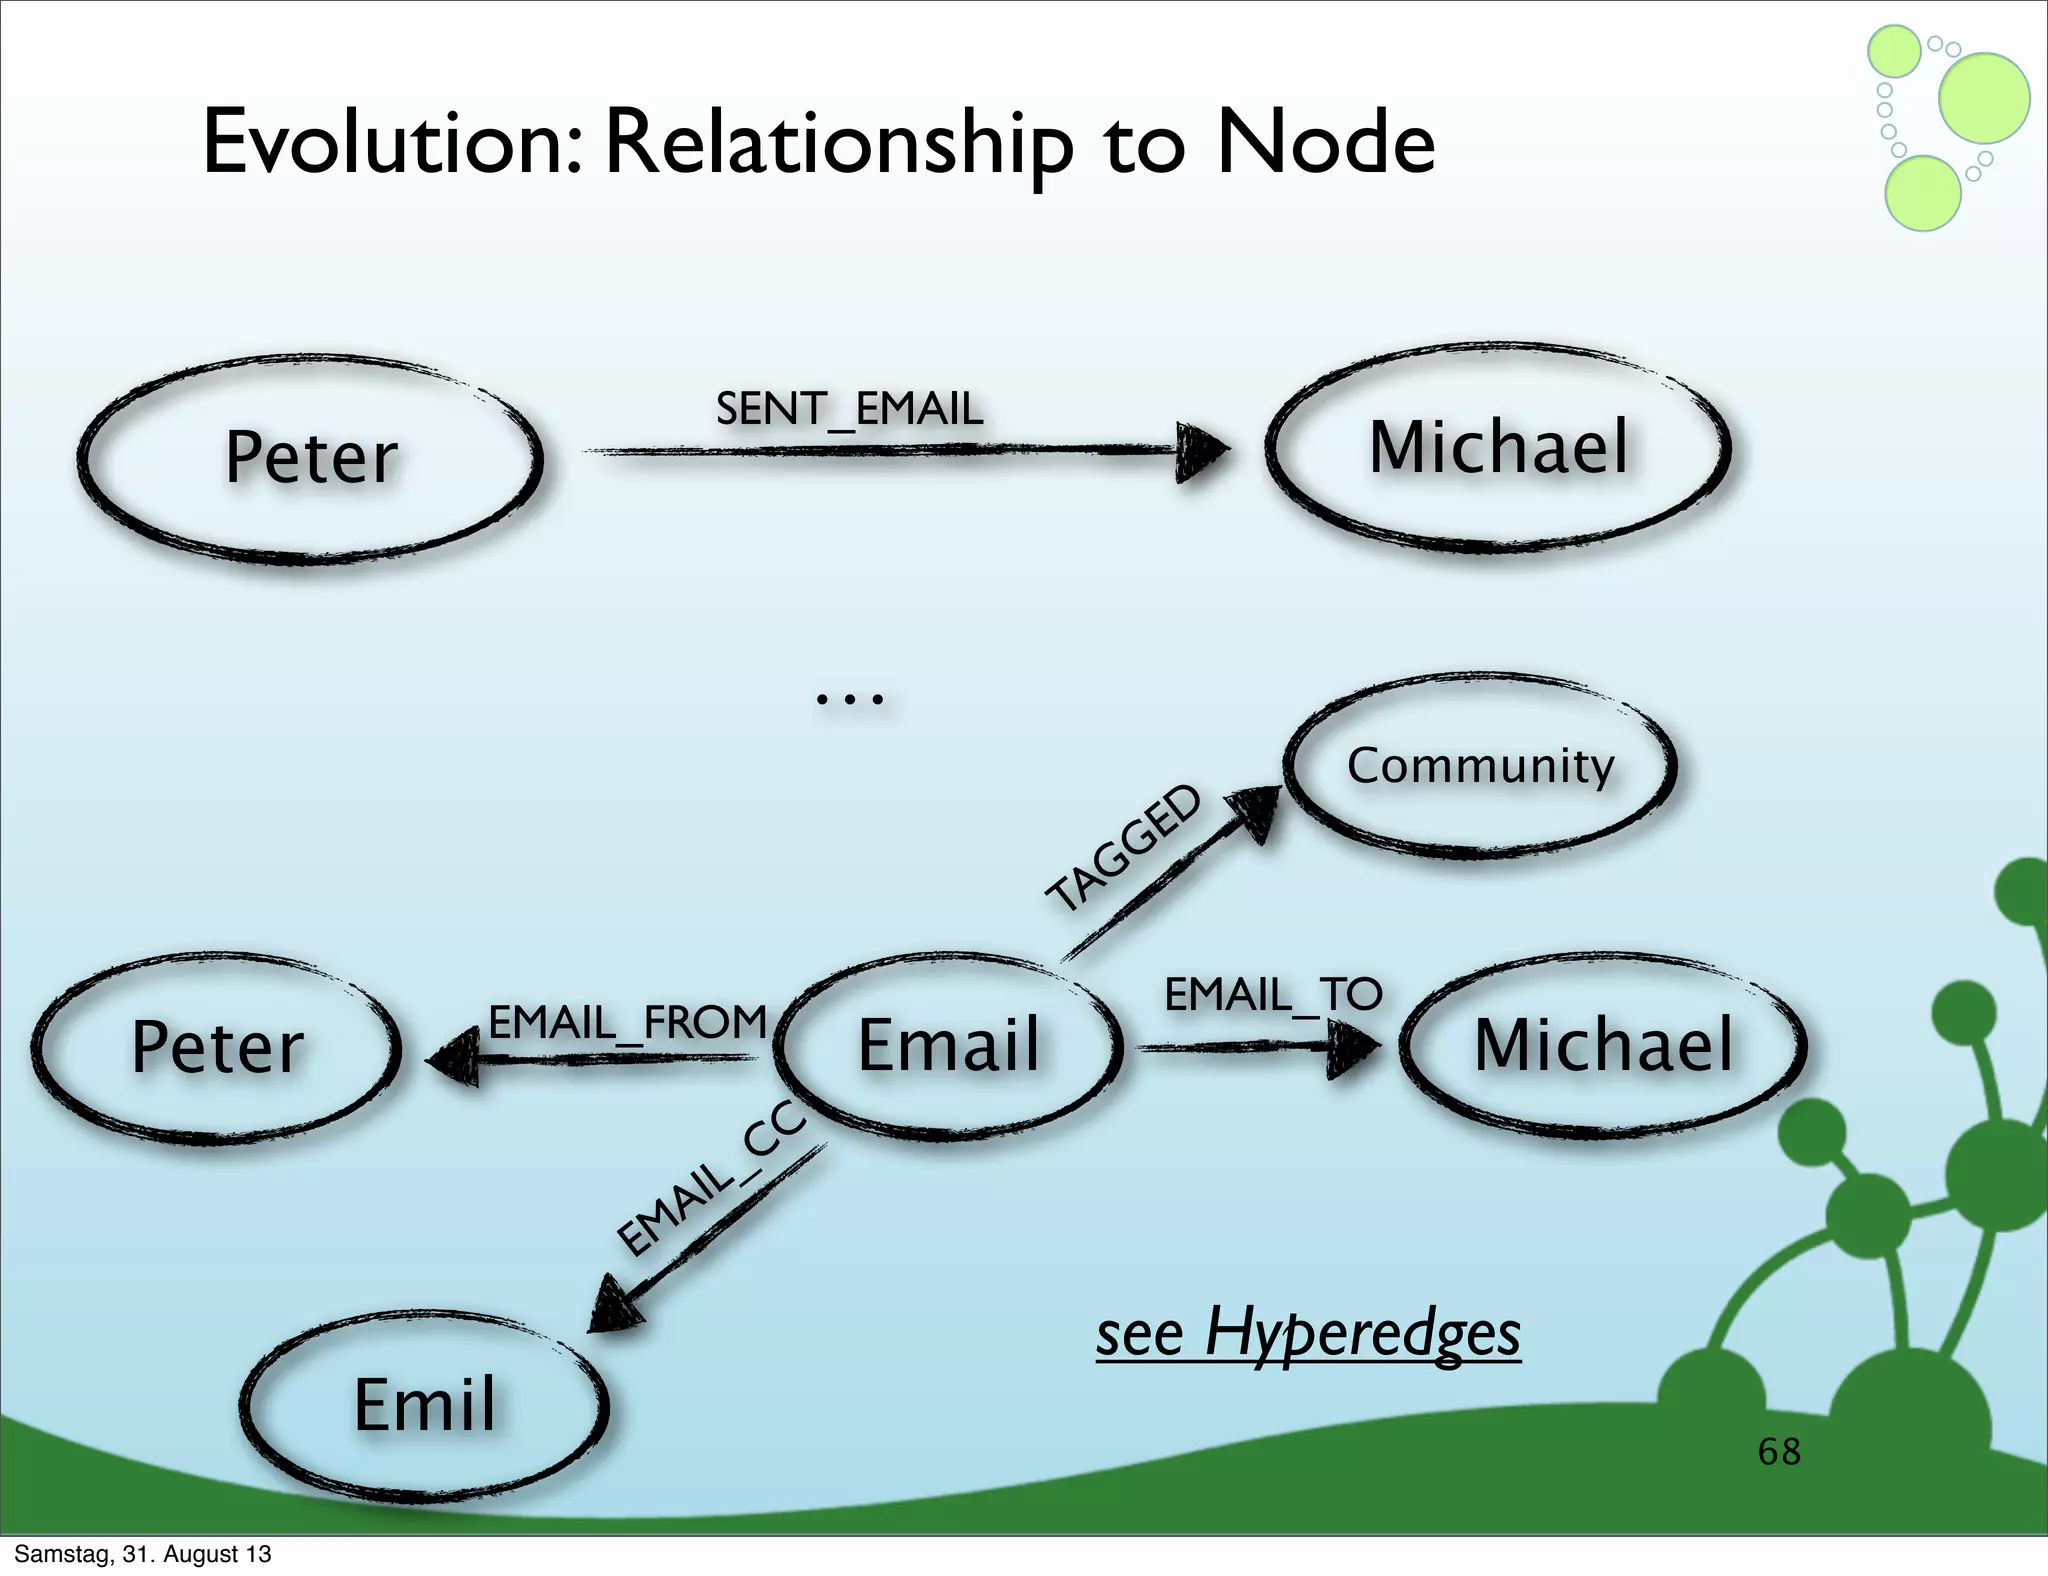
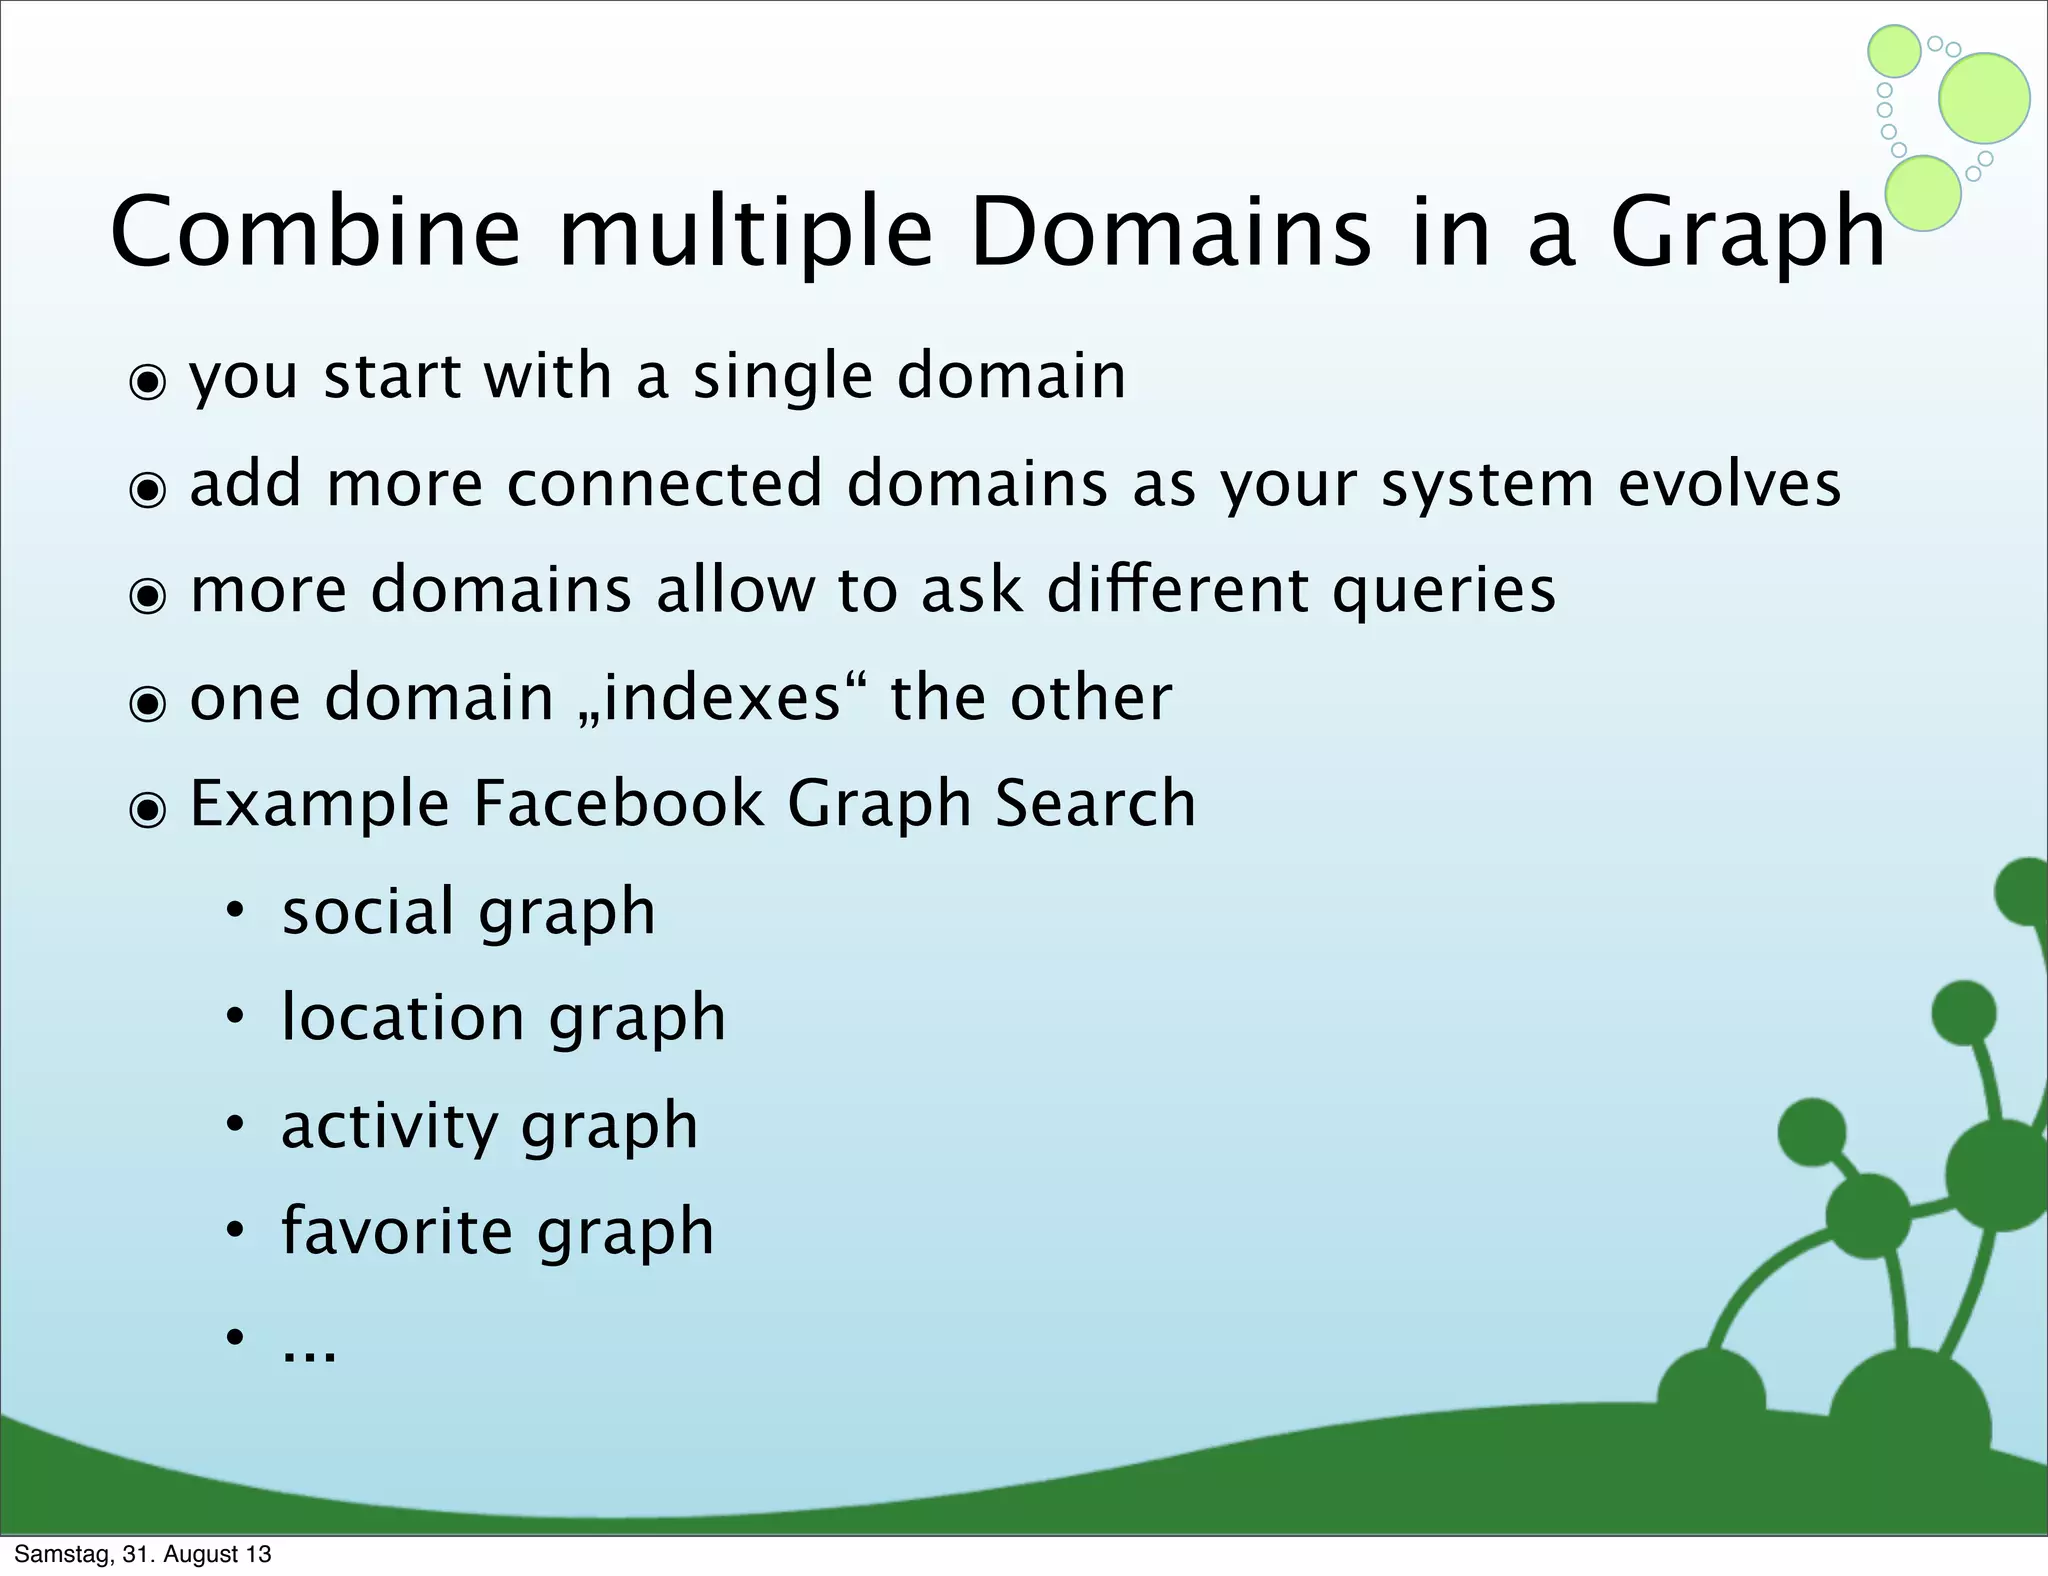
The document discusses data modeling with Neo4j, focusing on graph structures and their components: nodes, relationships, properties, and labels. It emphasizes the advantages of graph databases in managing complex data and highlights the process of designing a data model based on user queries and application goals. Additionally, it contrasts graph models with traditional relational models and discusses best practices for graph data design.
Overview of Neo4j, its community, and the purpose of the webinar focusing on data modeling using graphs.
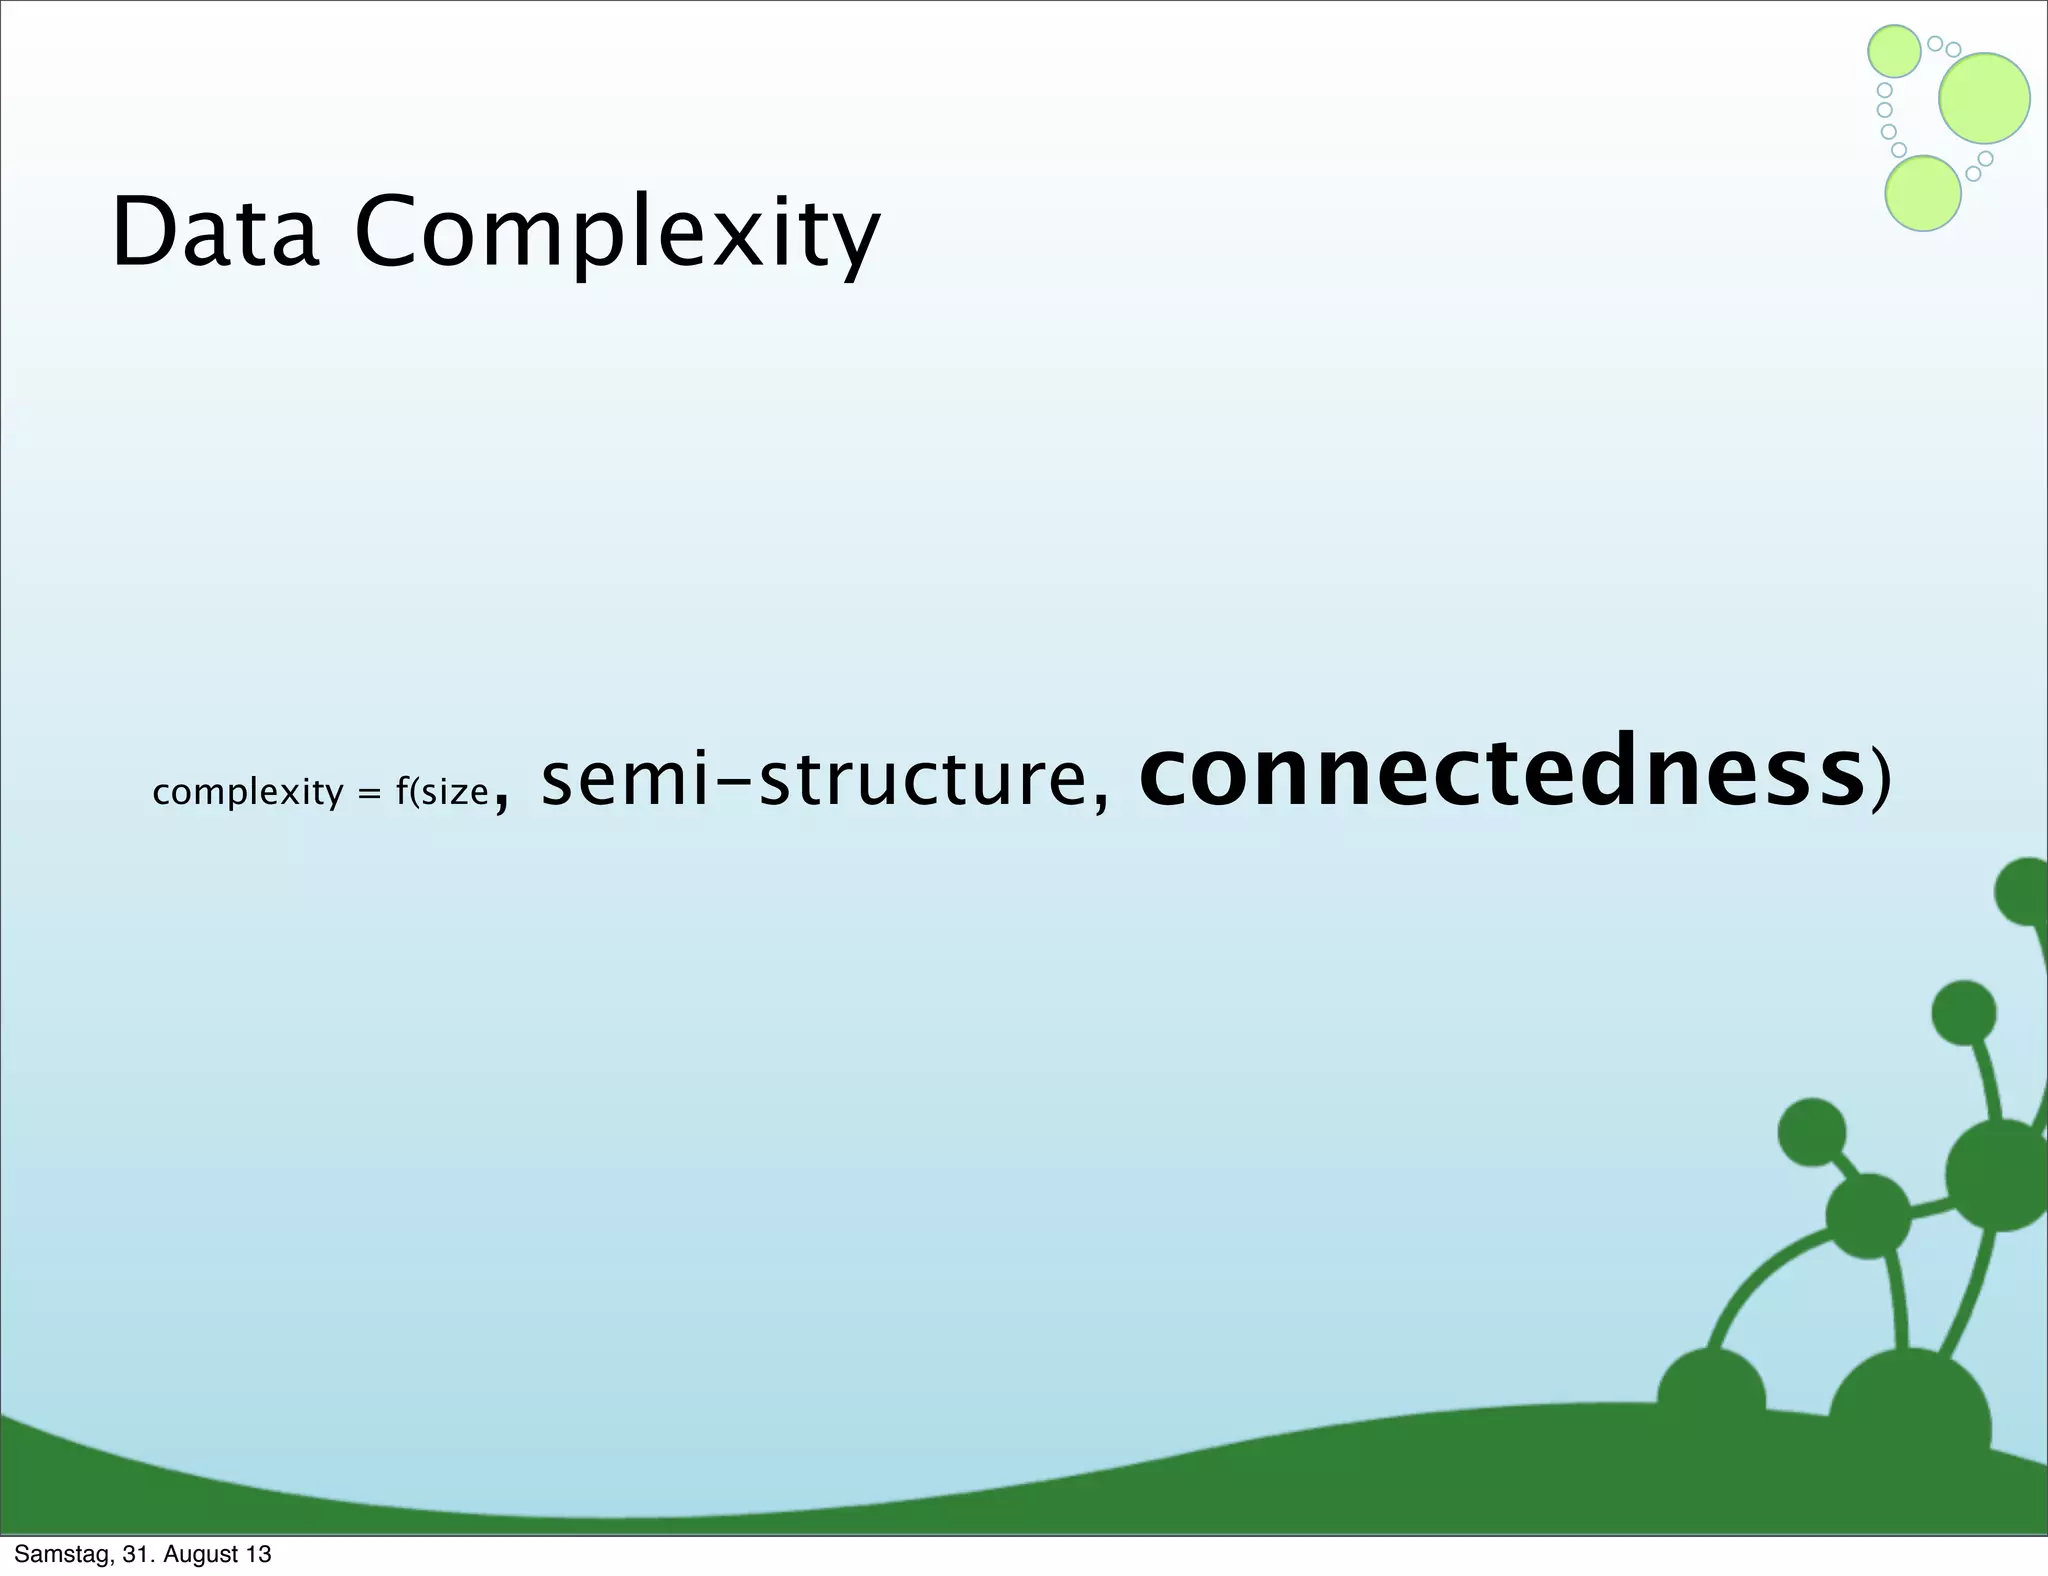
Graphs help address data complexity influenced by size, semi-structure, and connectedness.
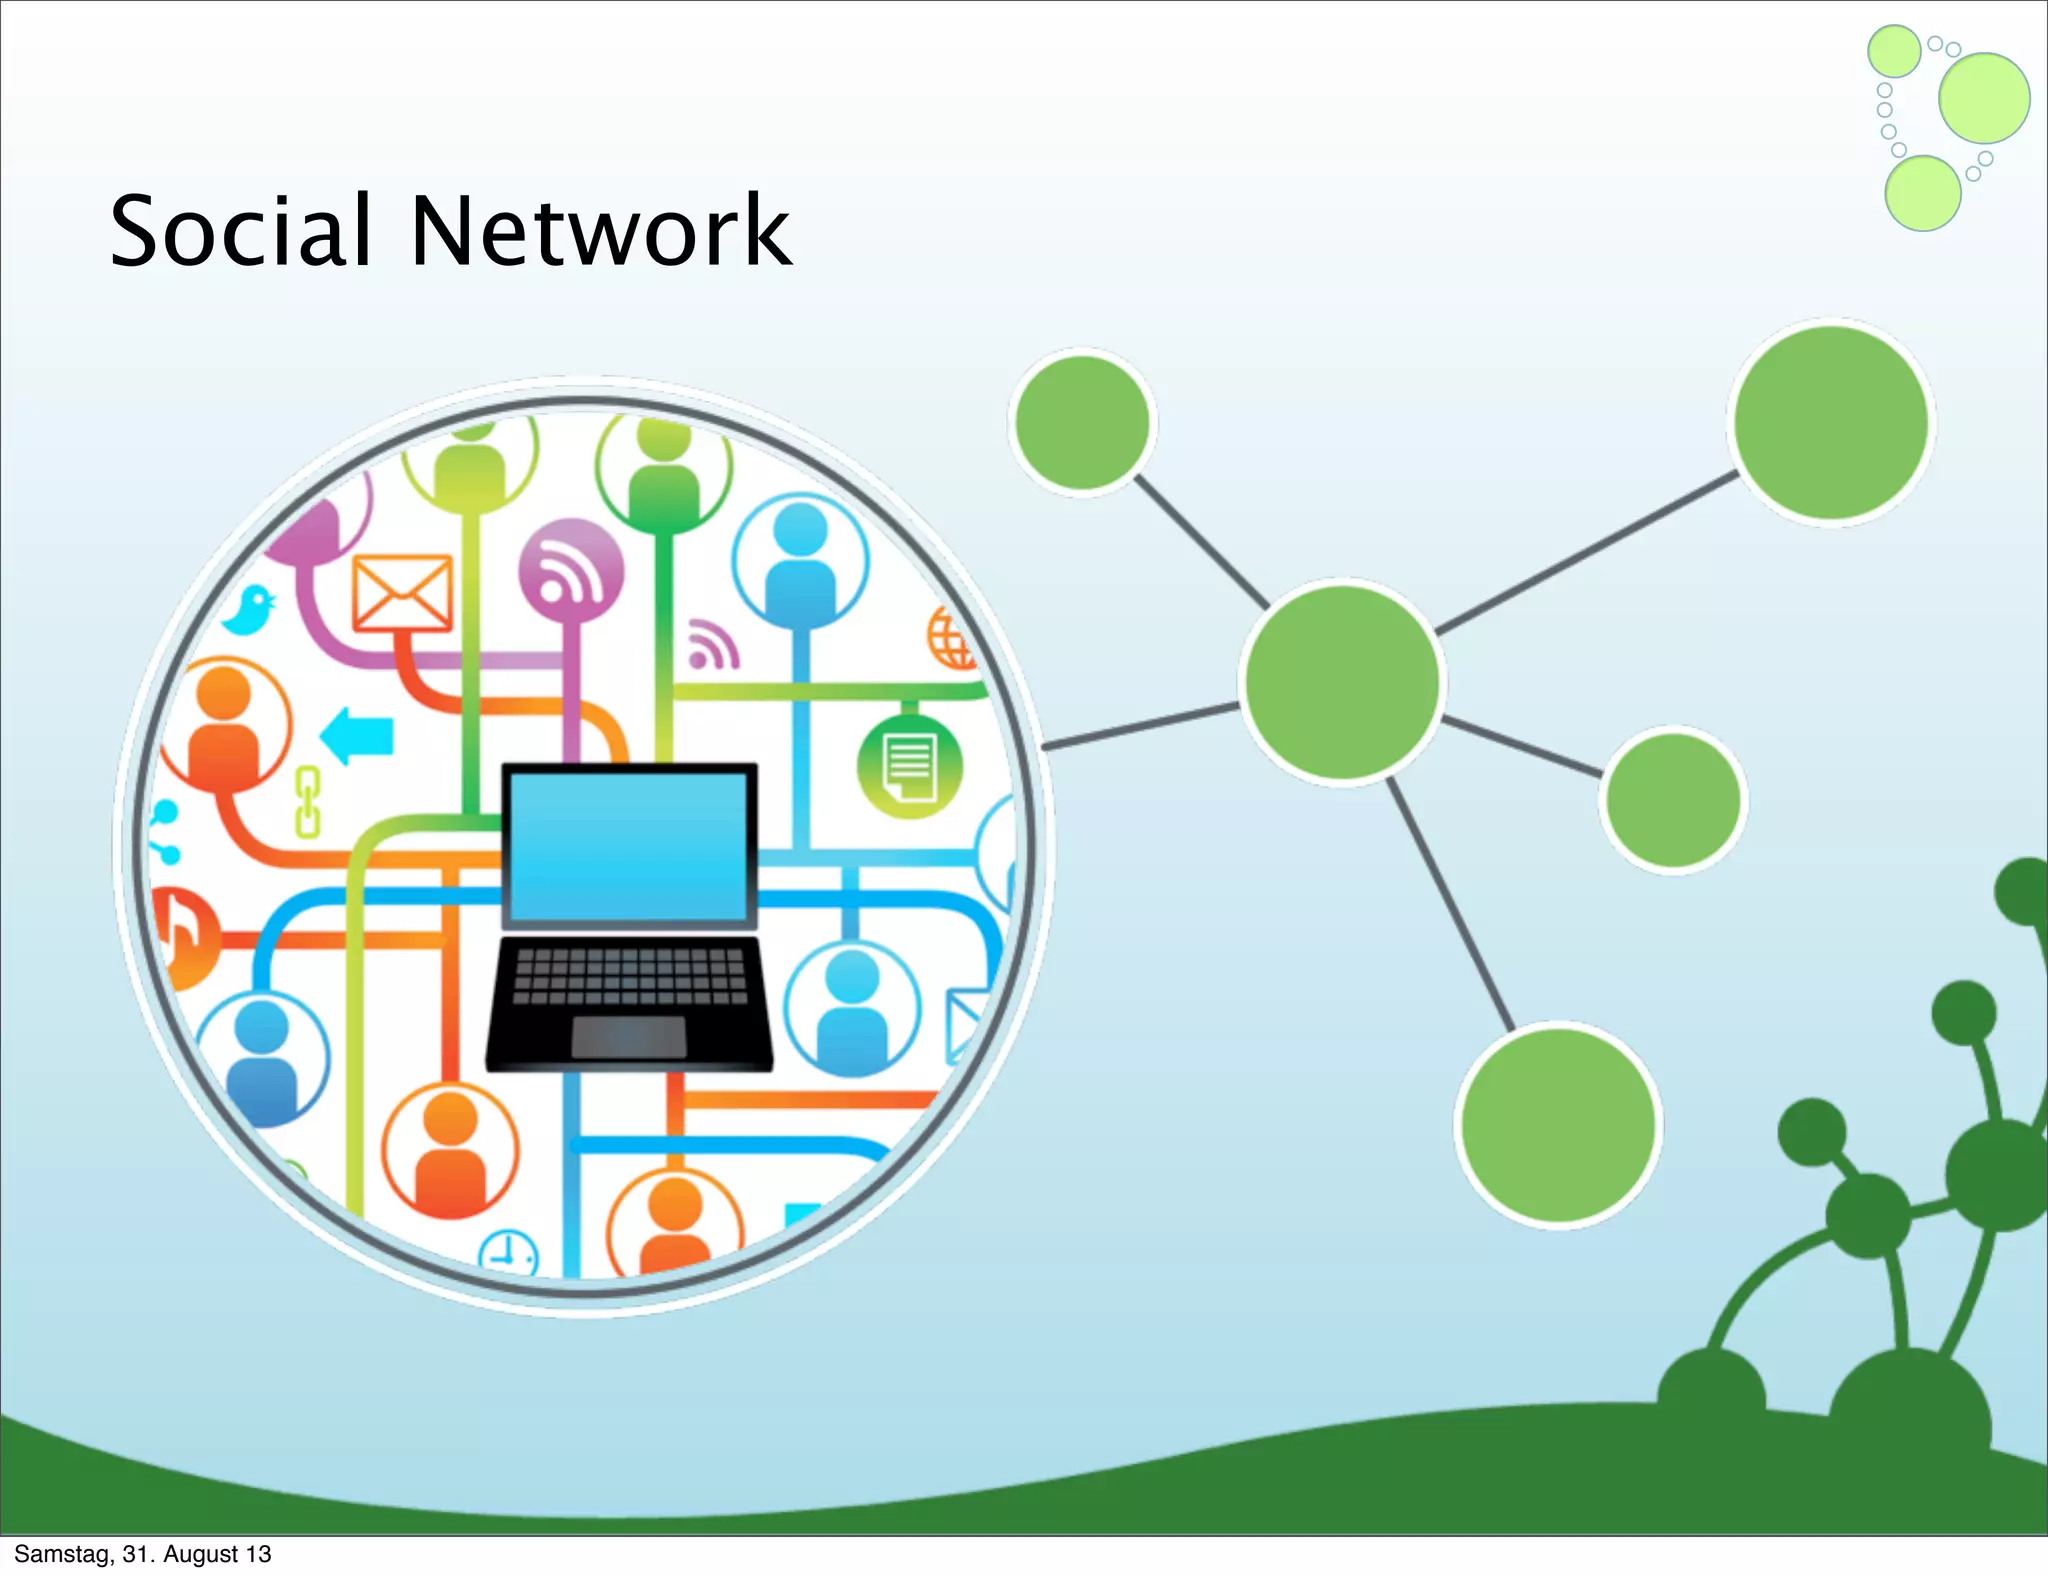
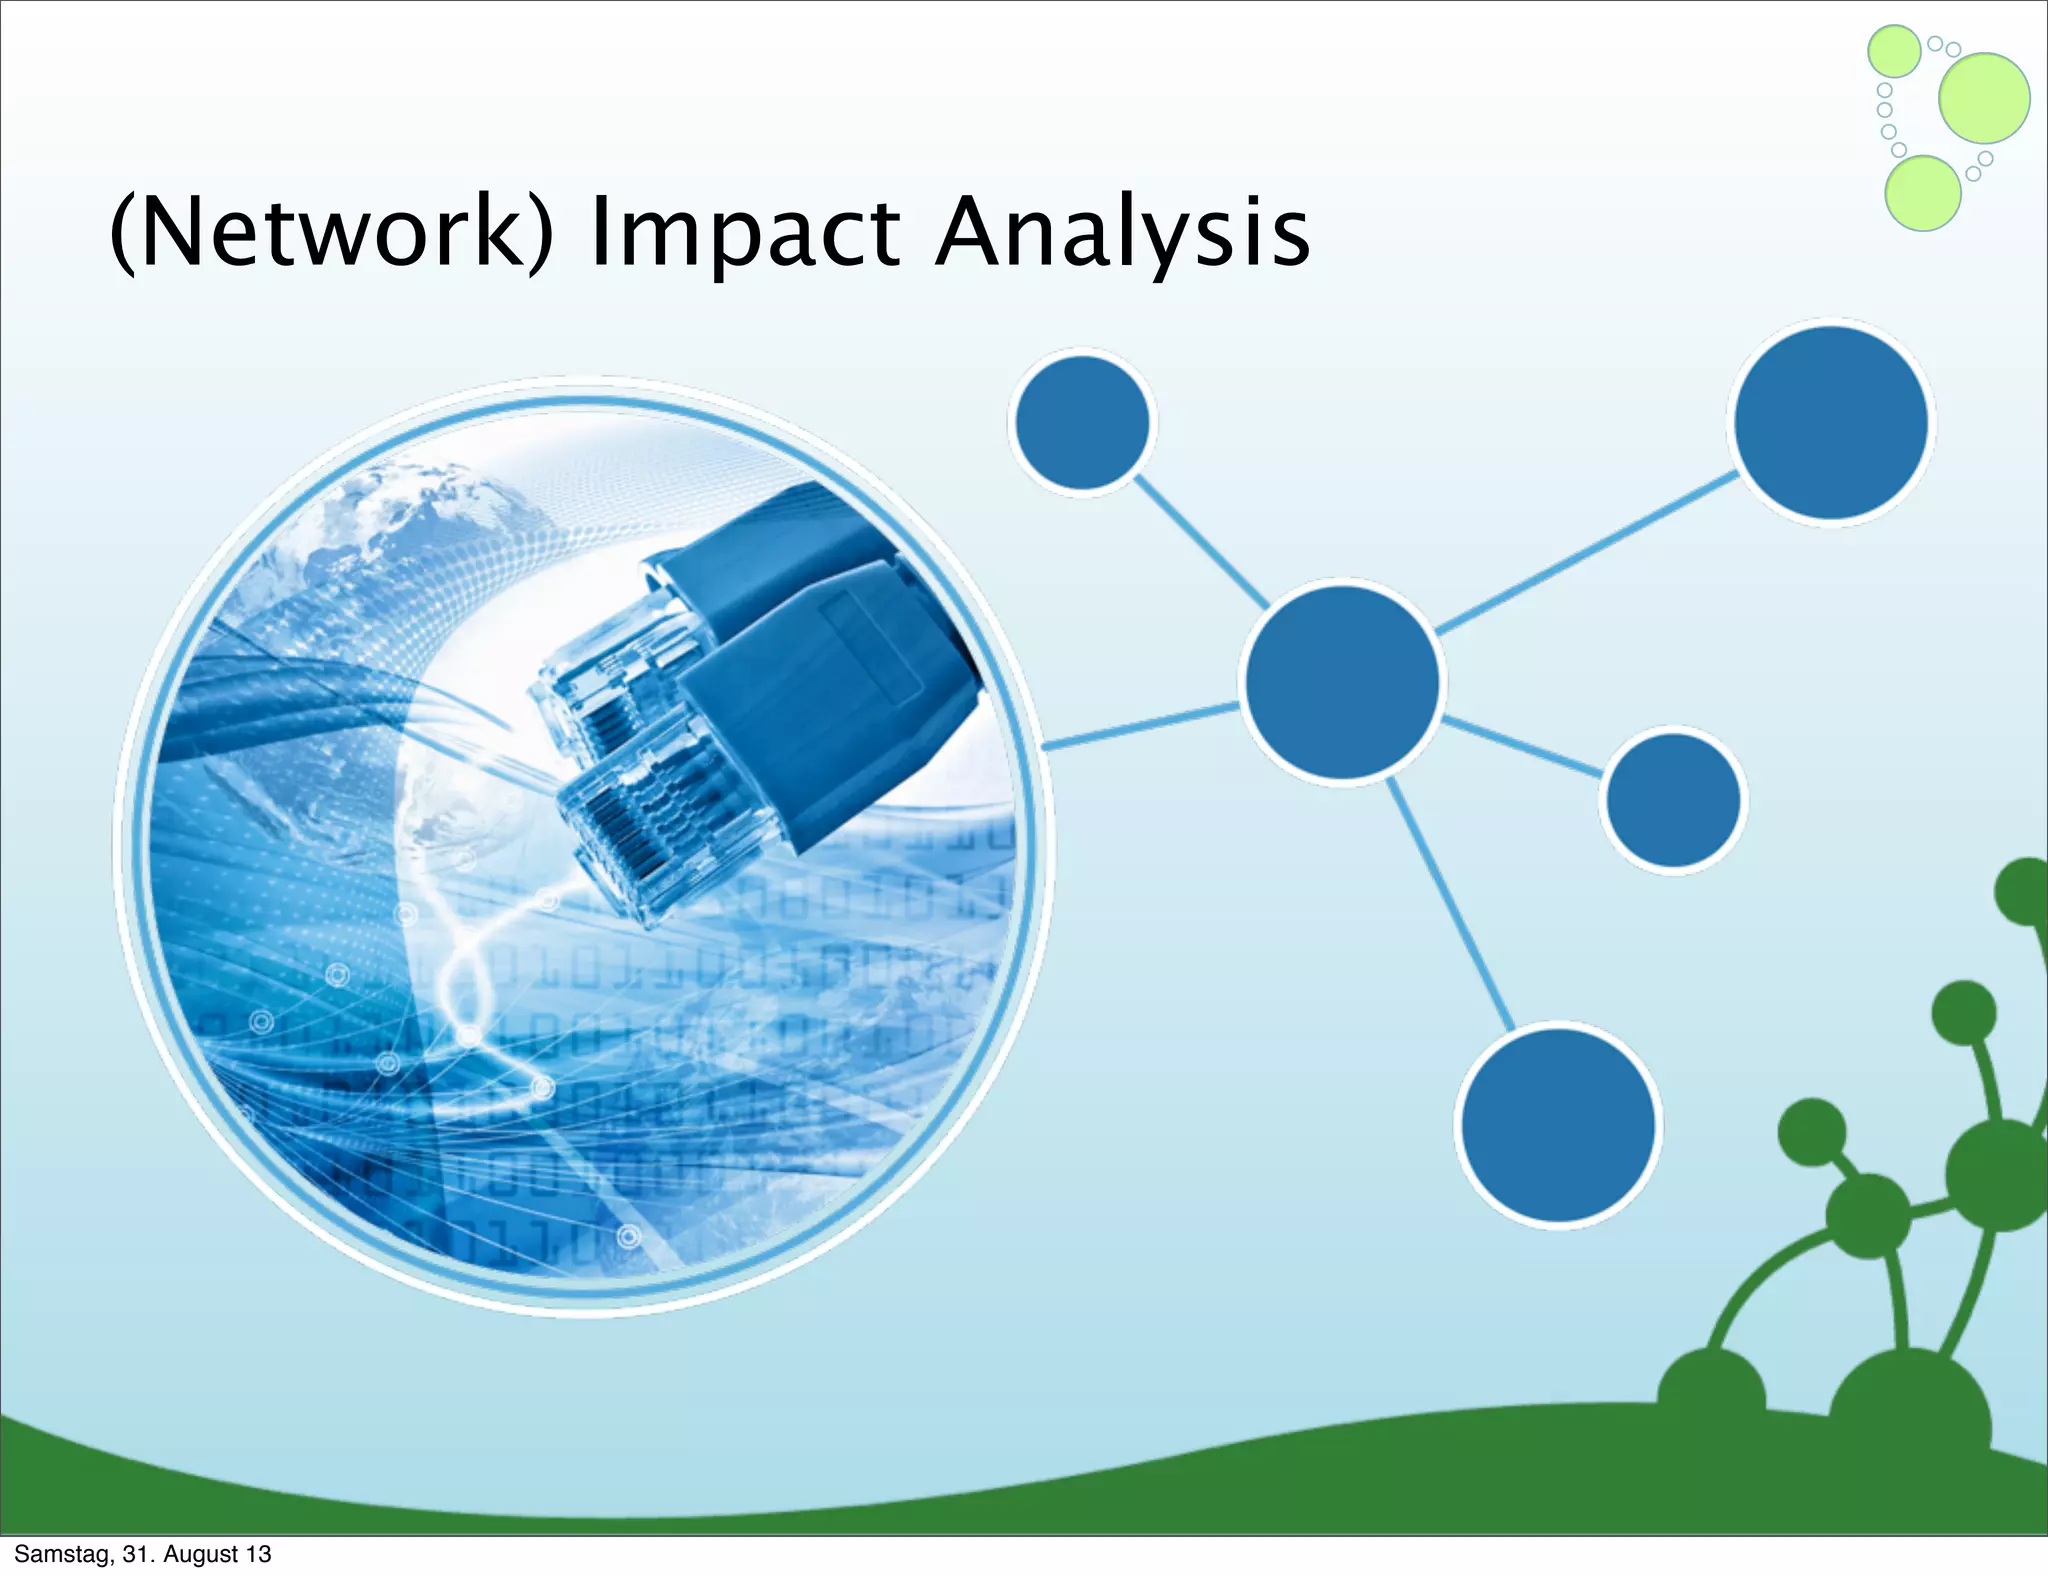
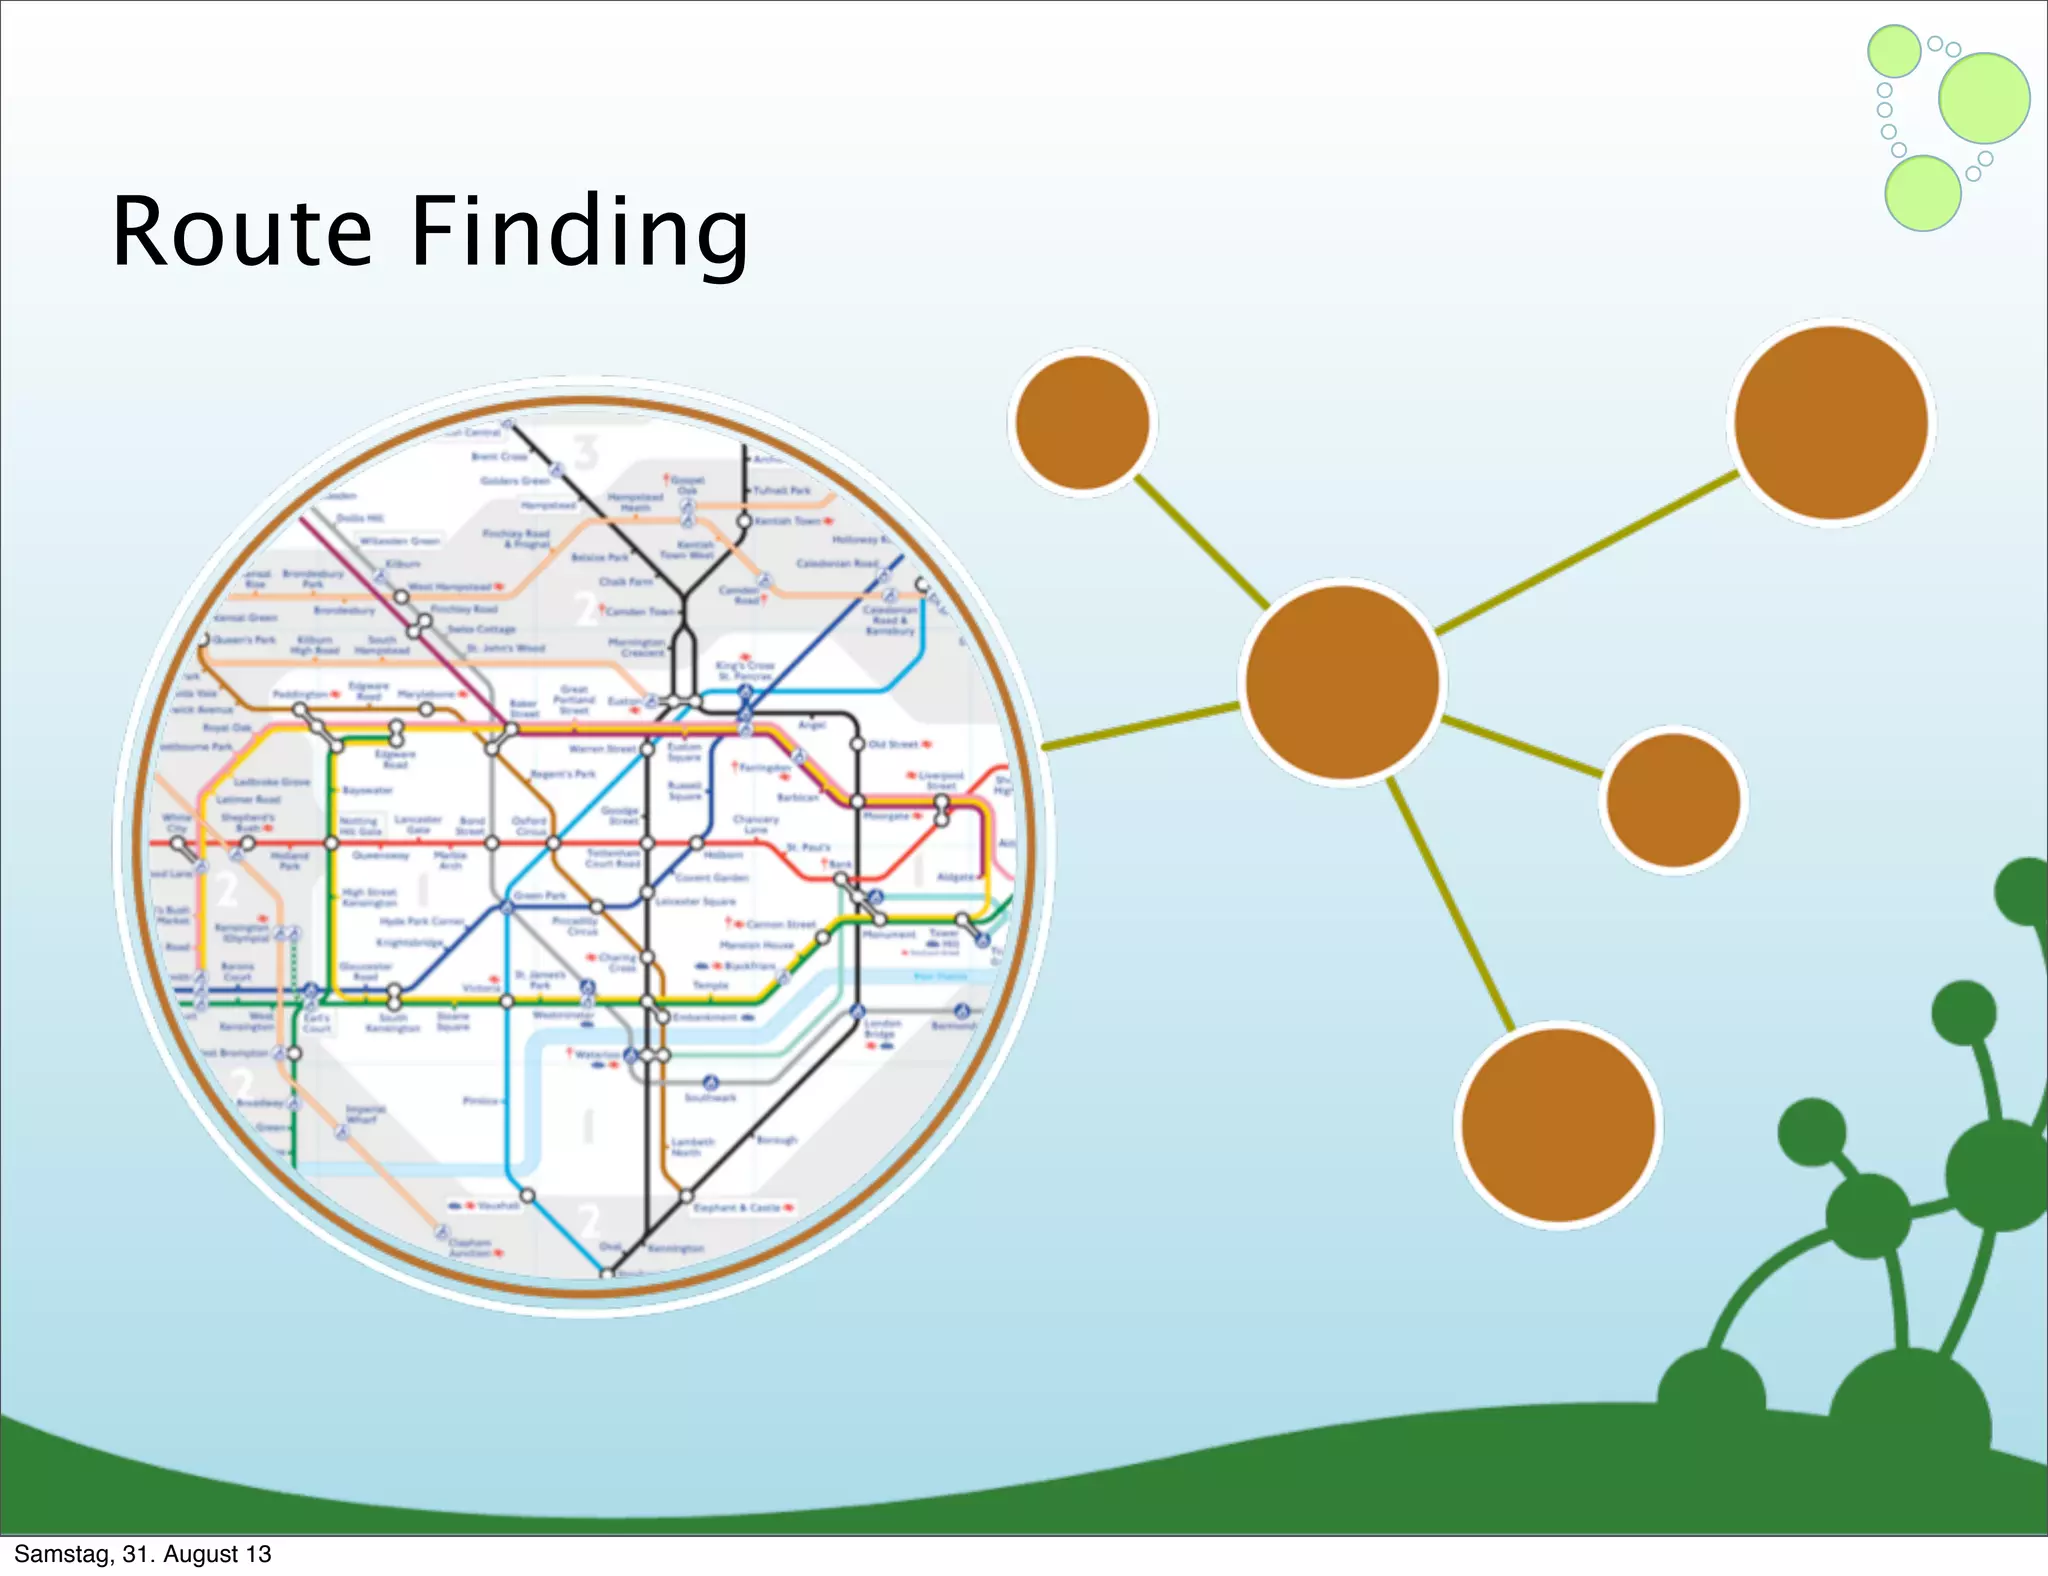
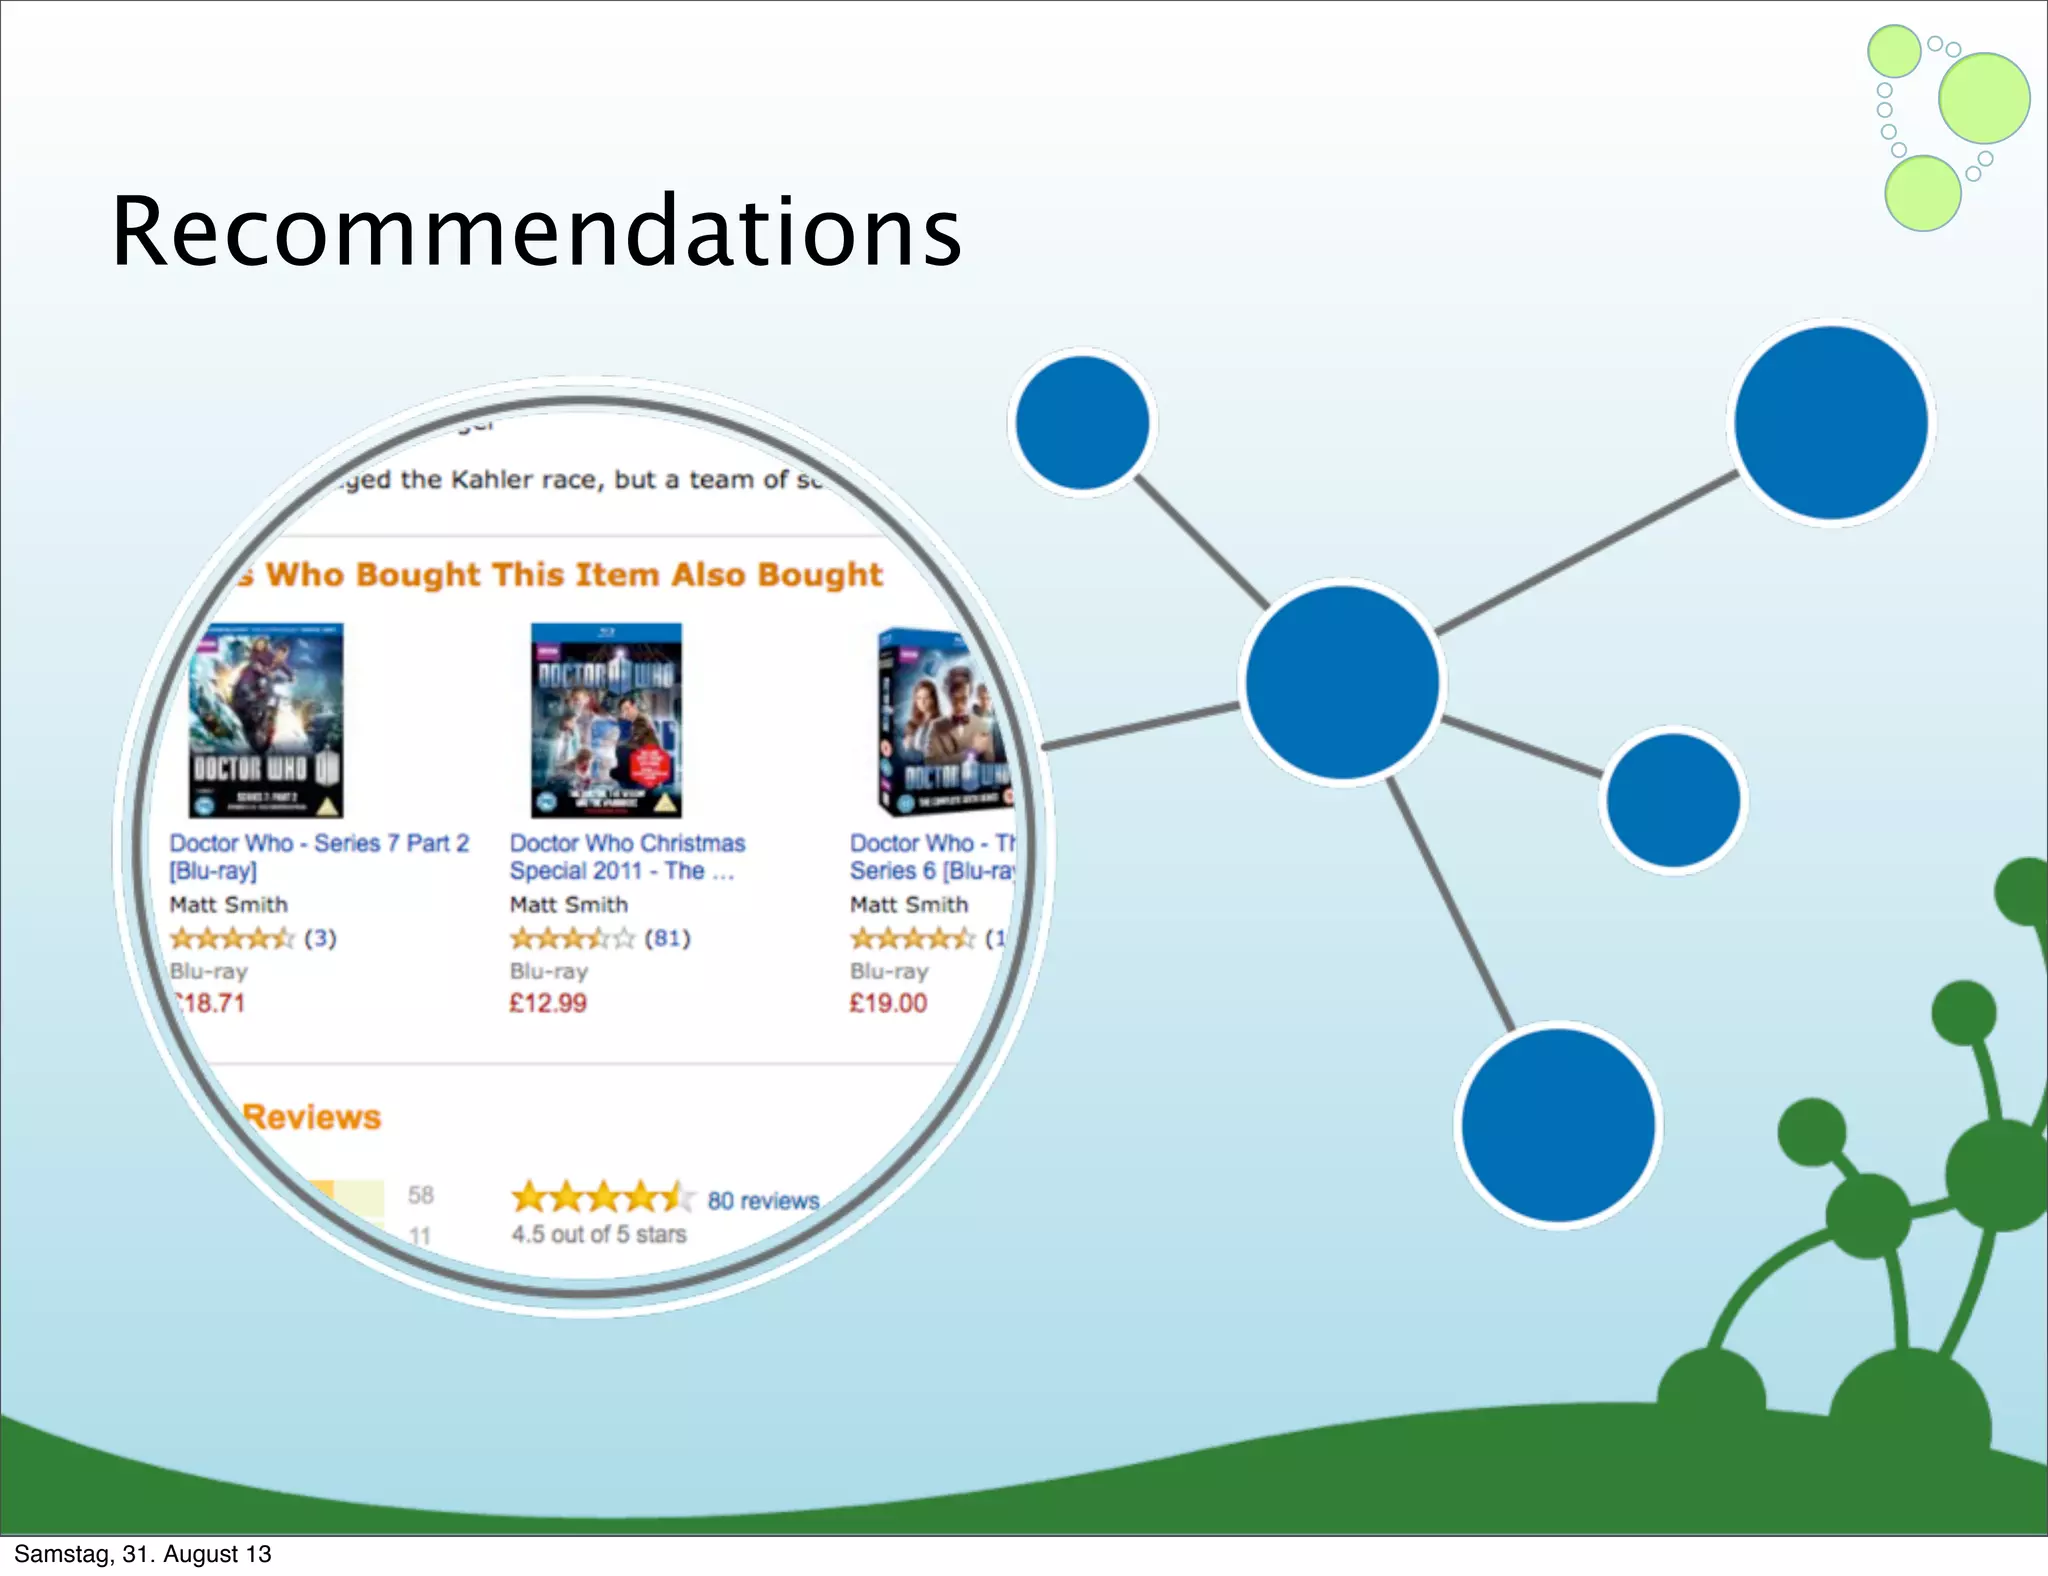
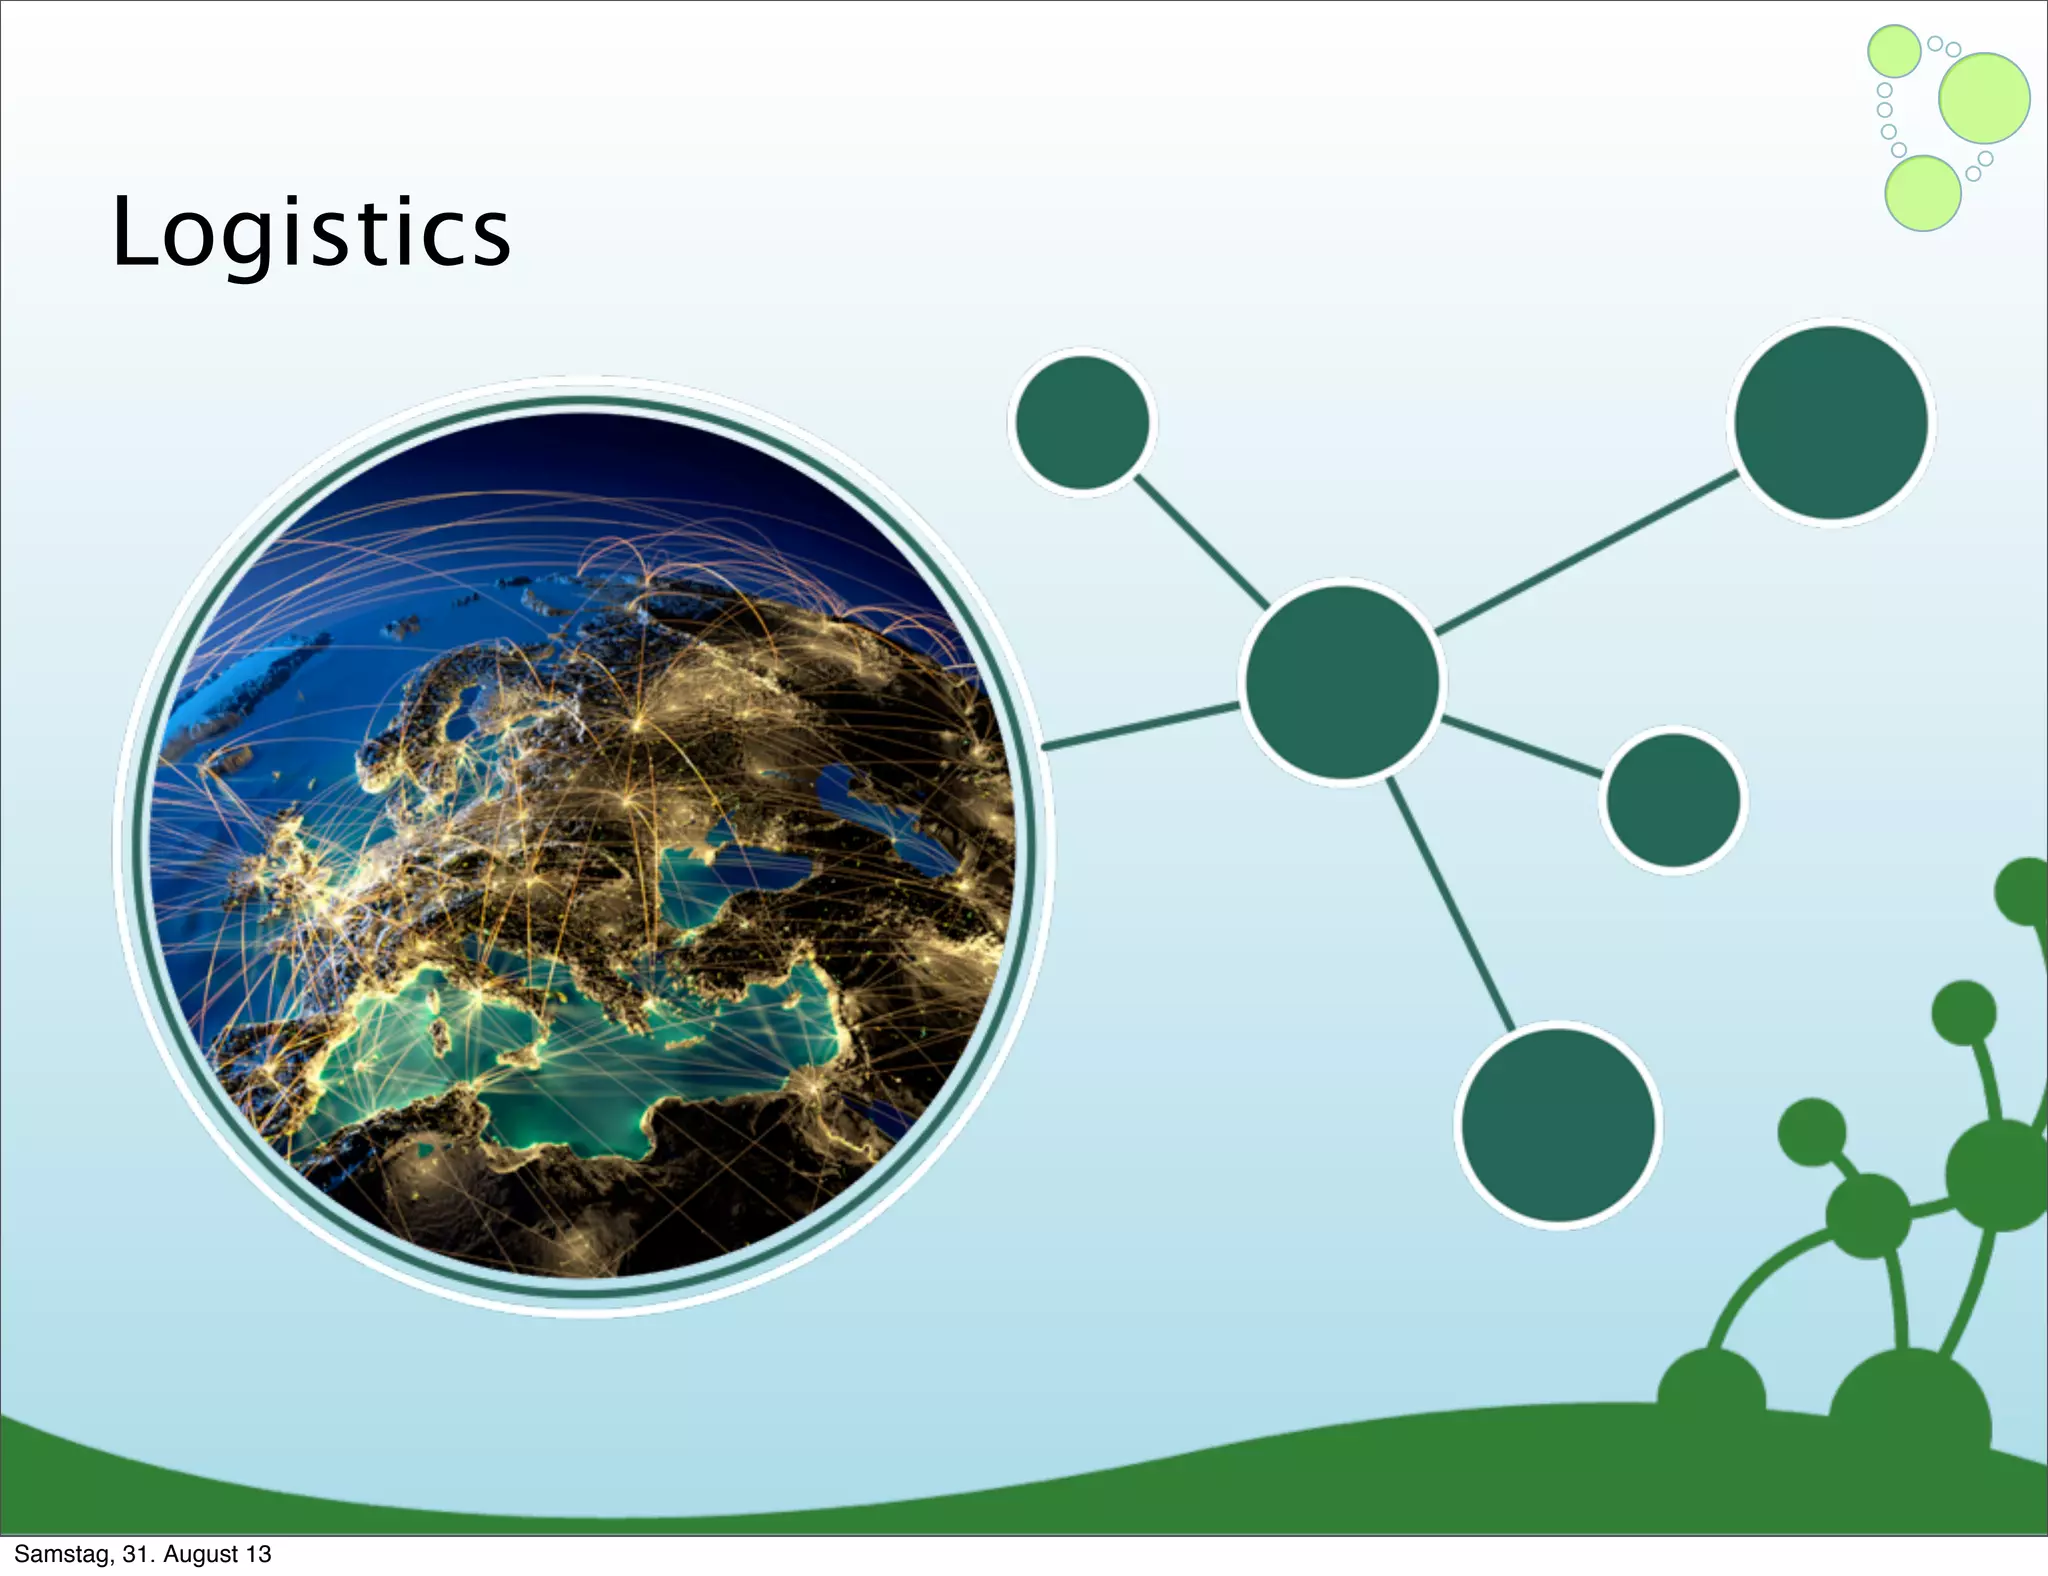
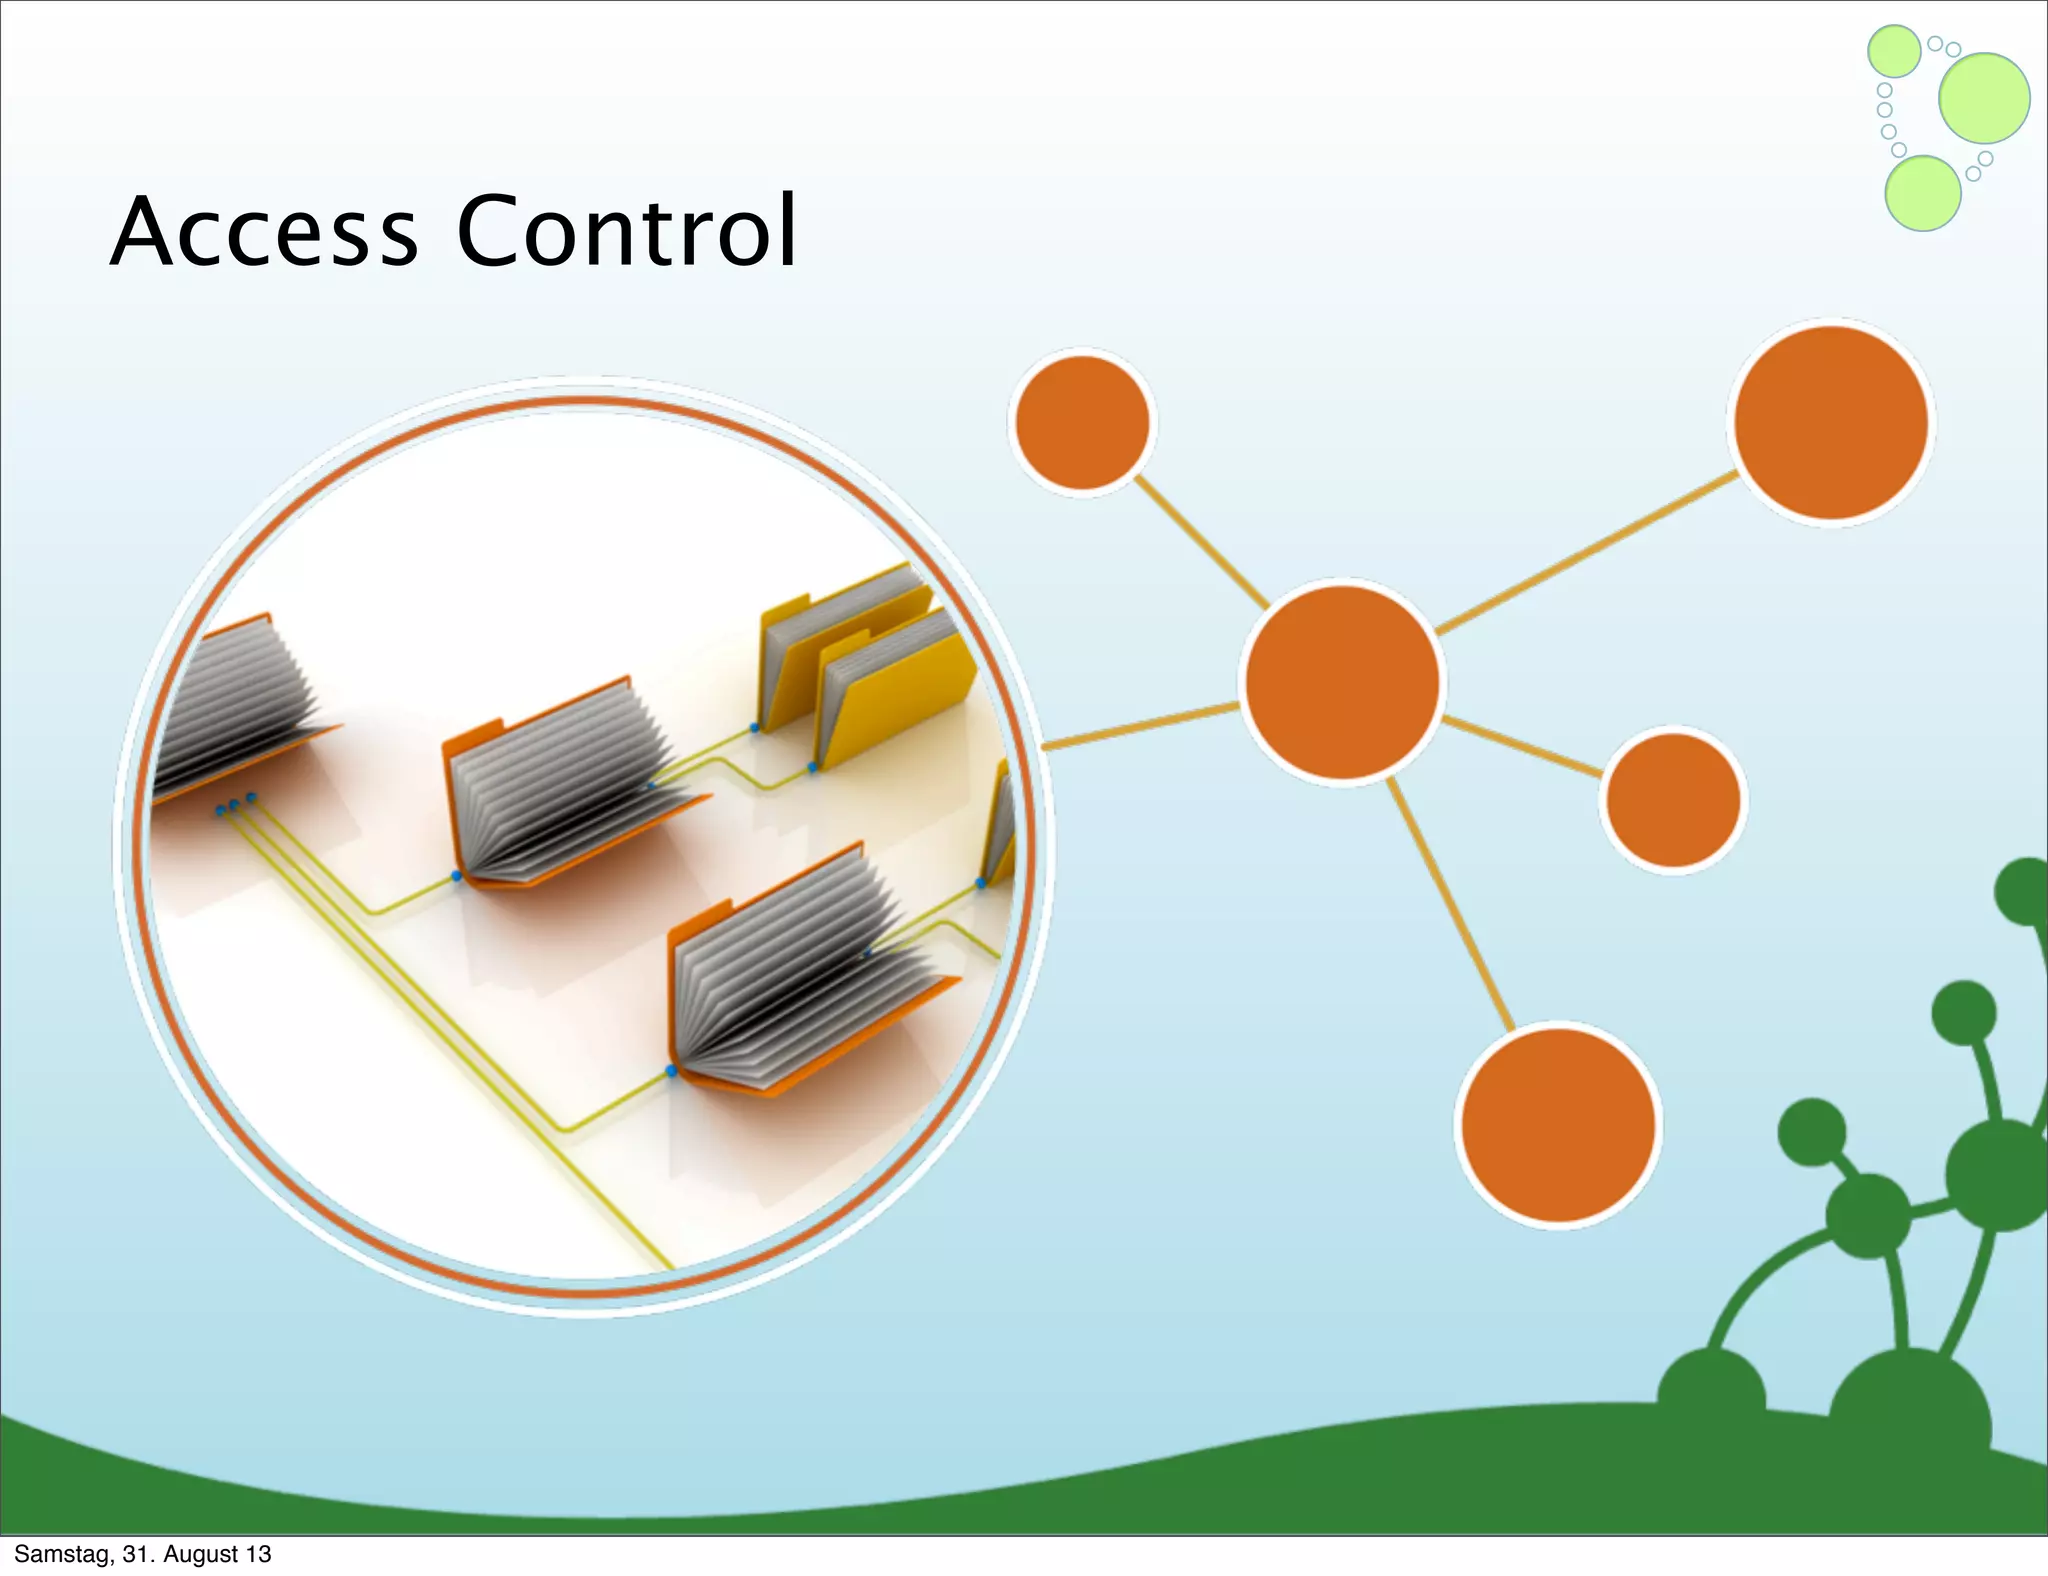
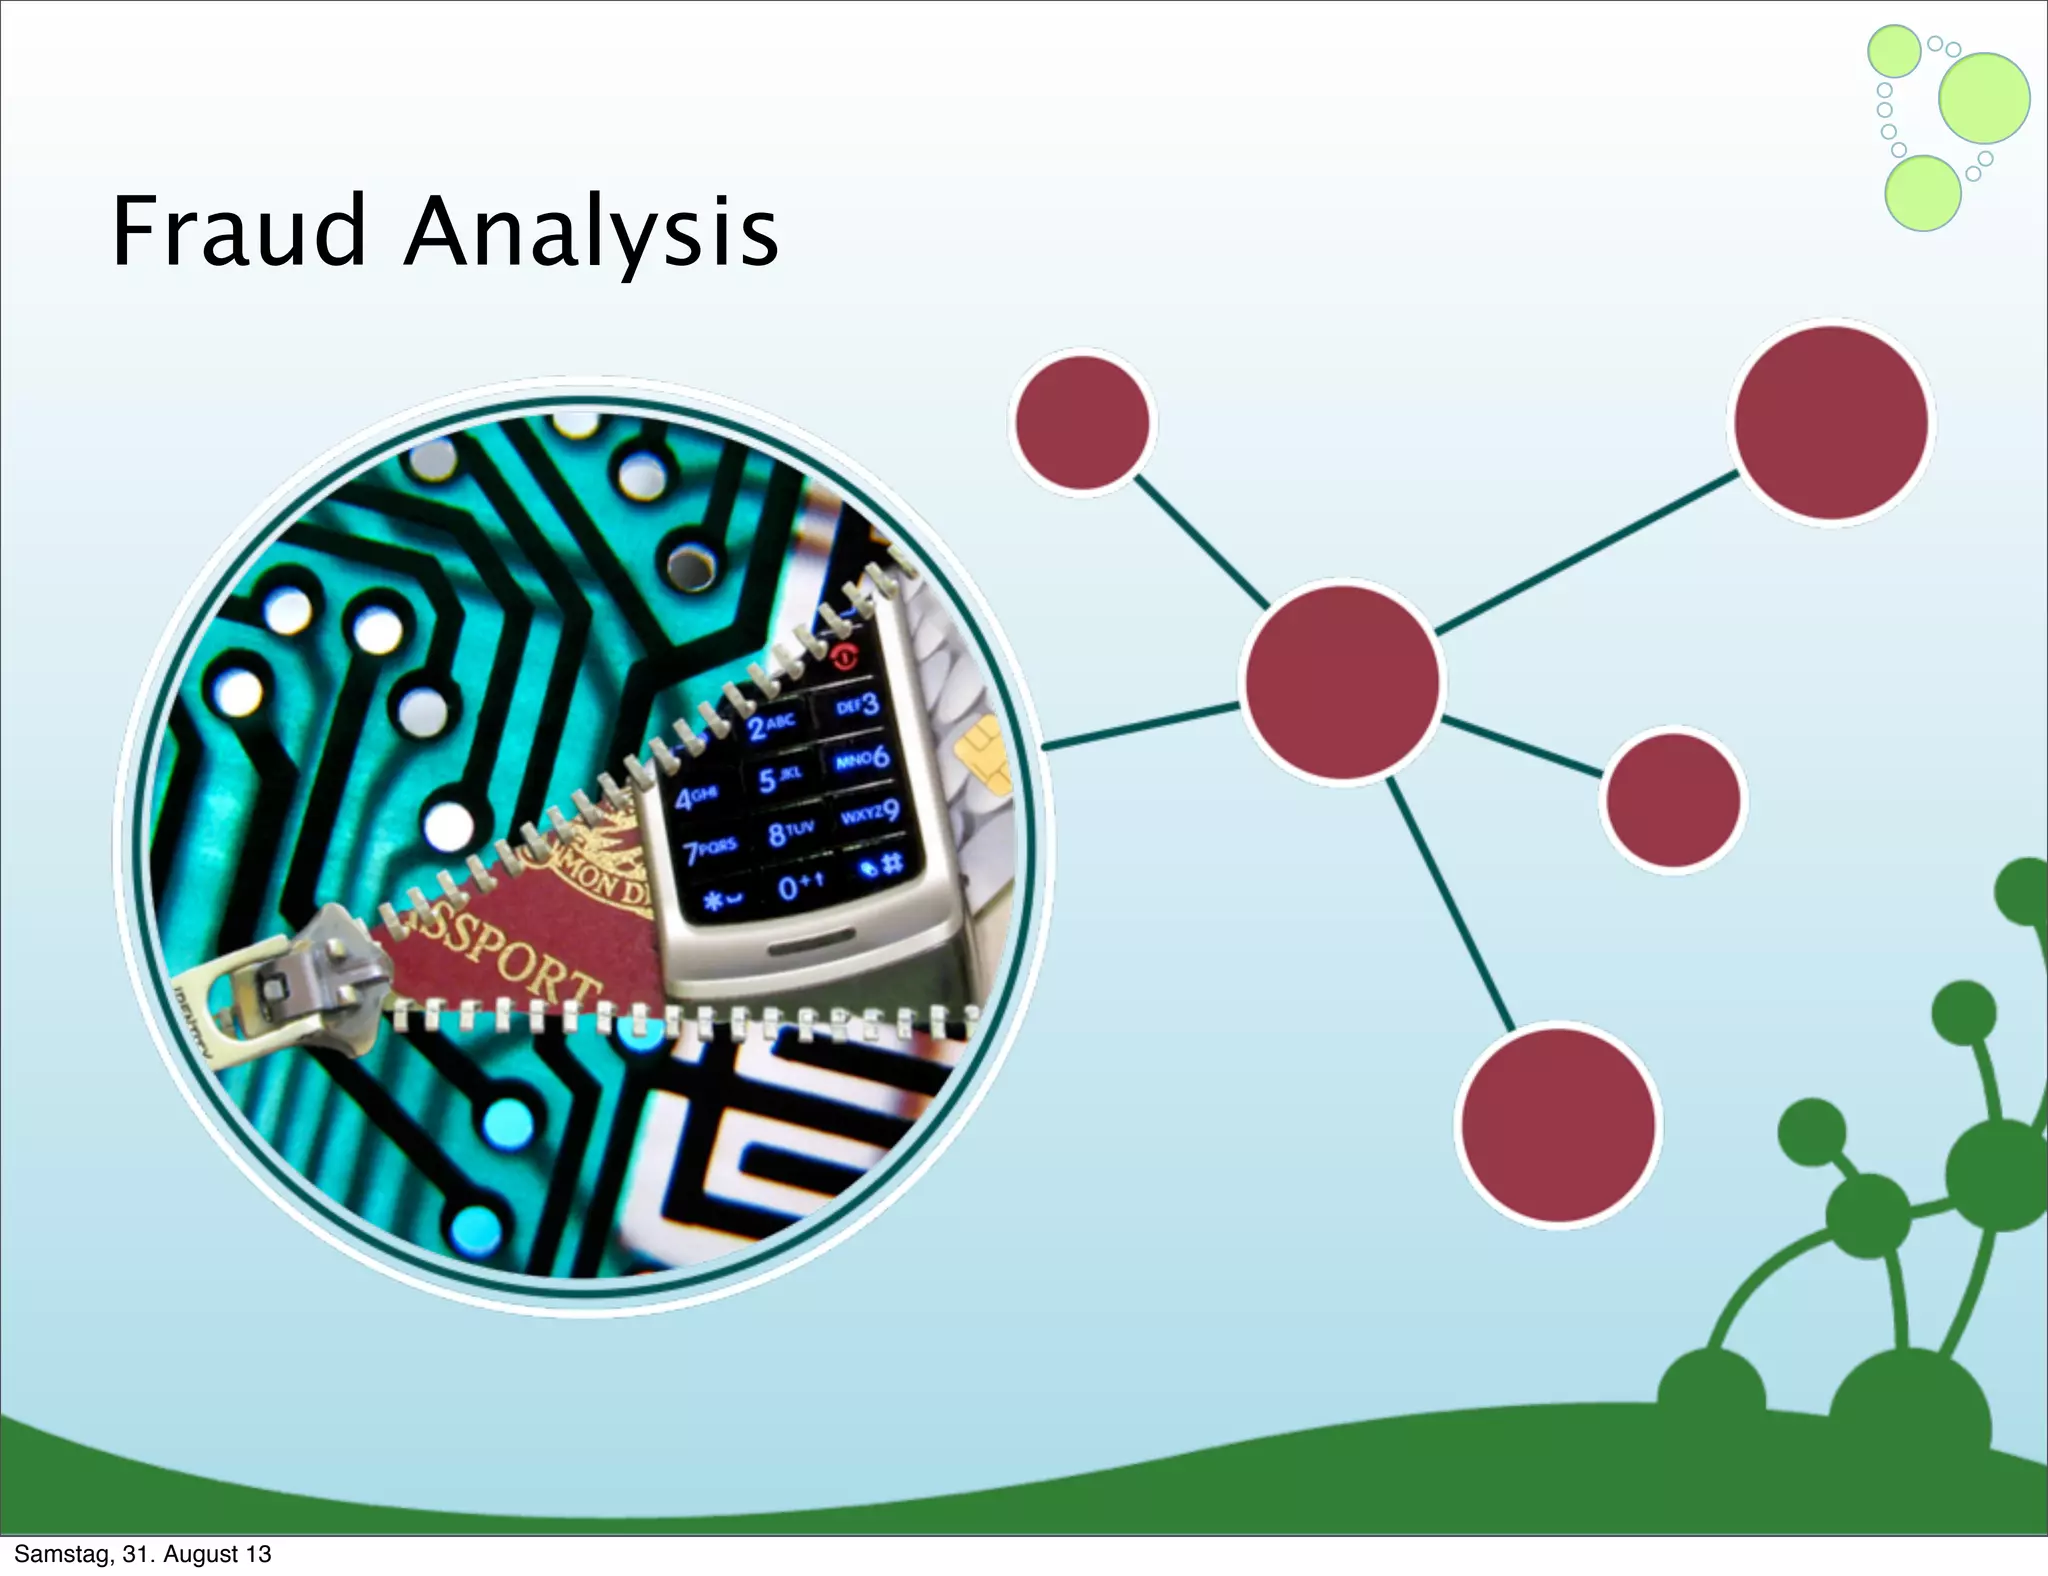
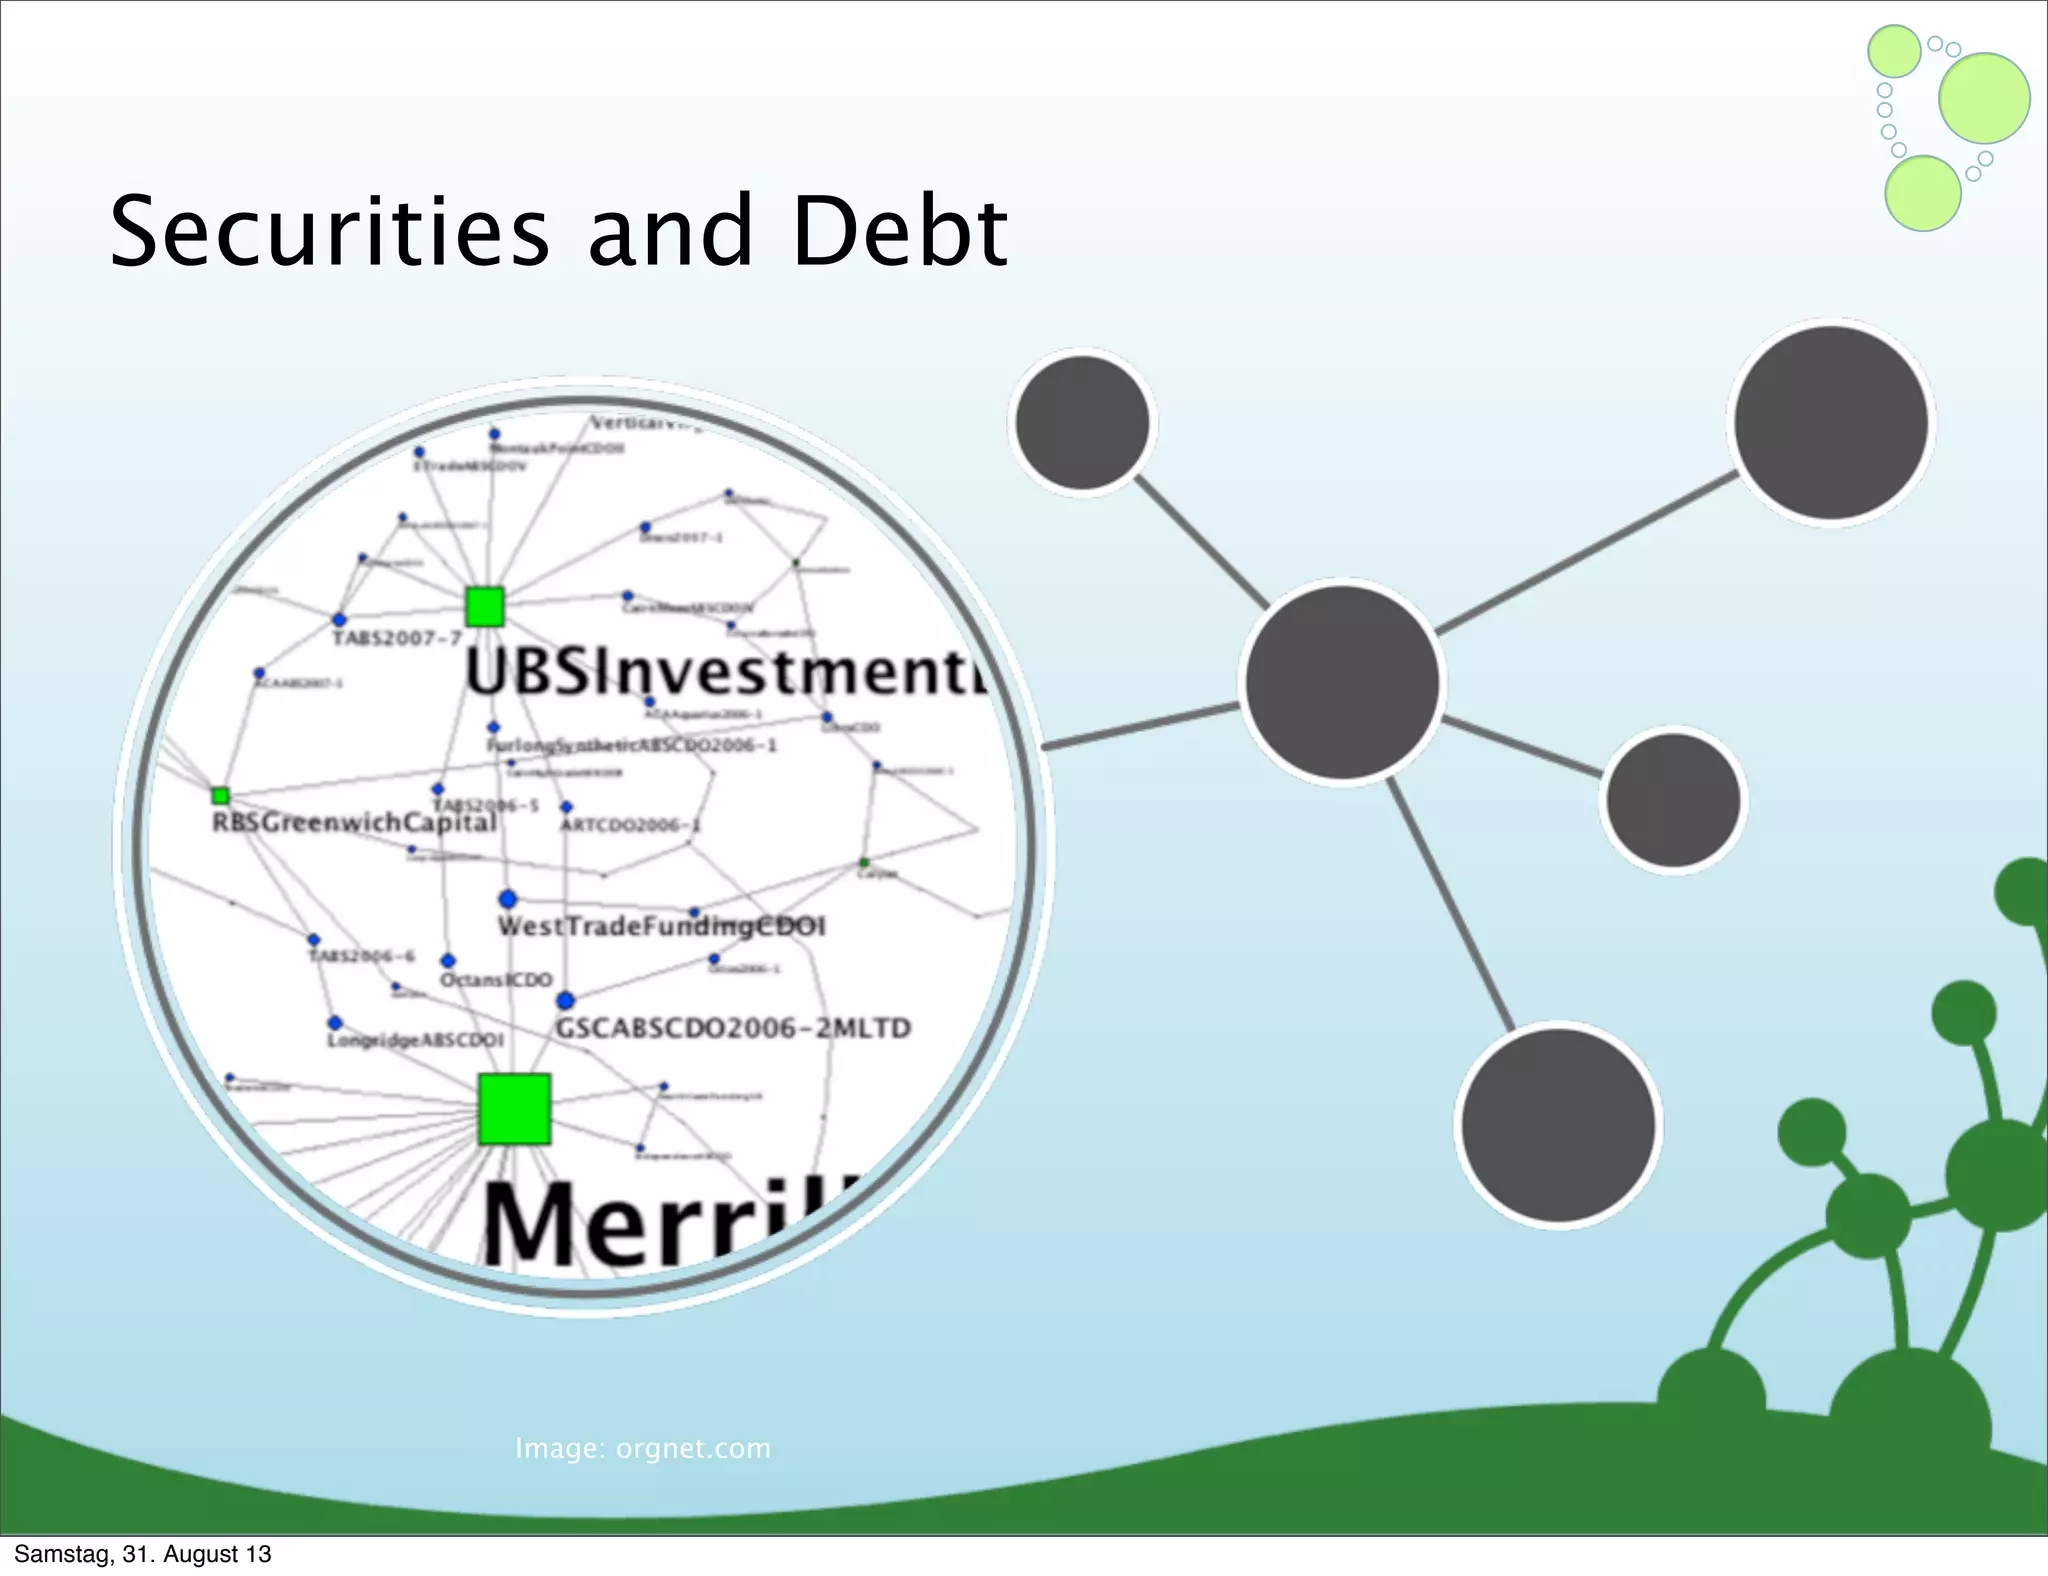
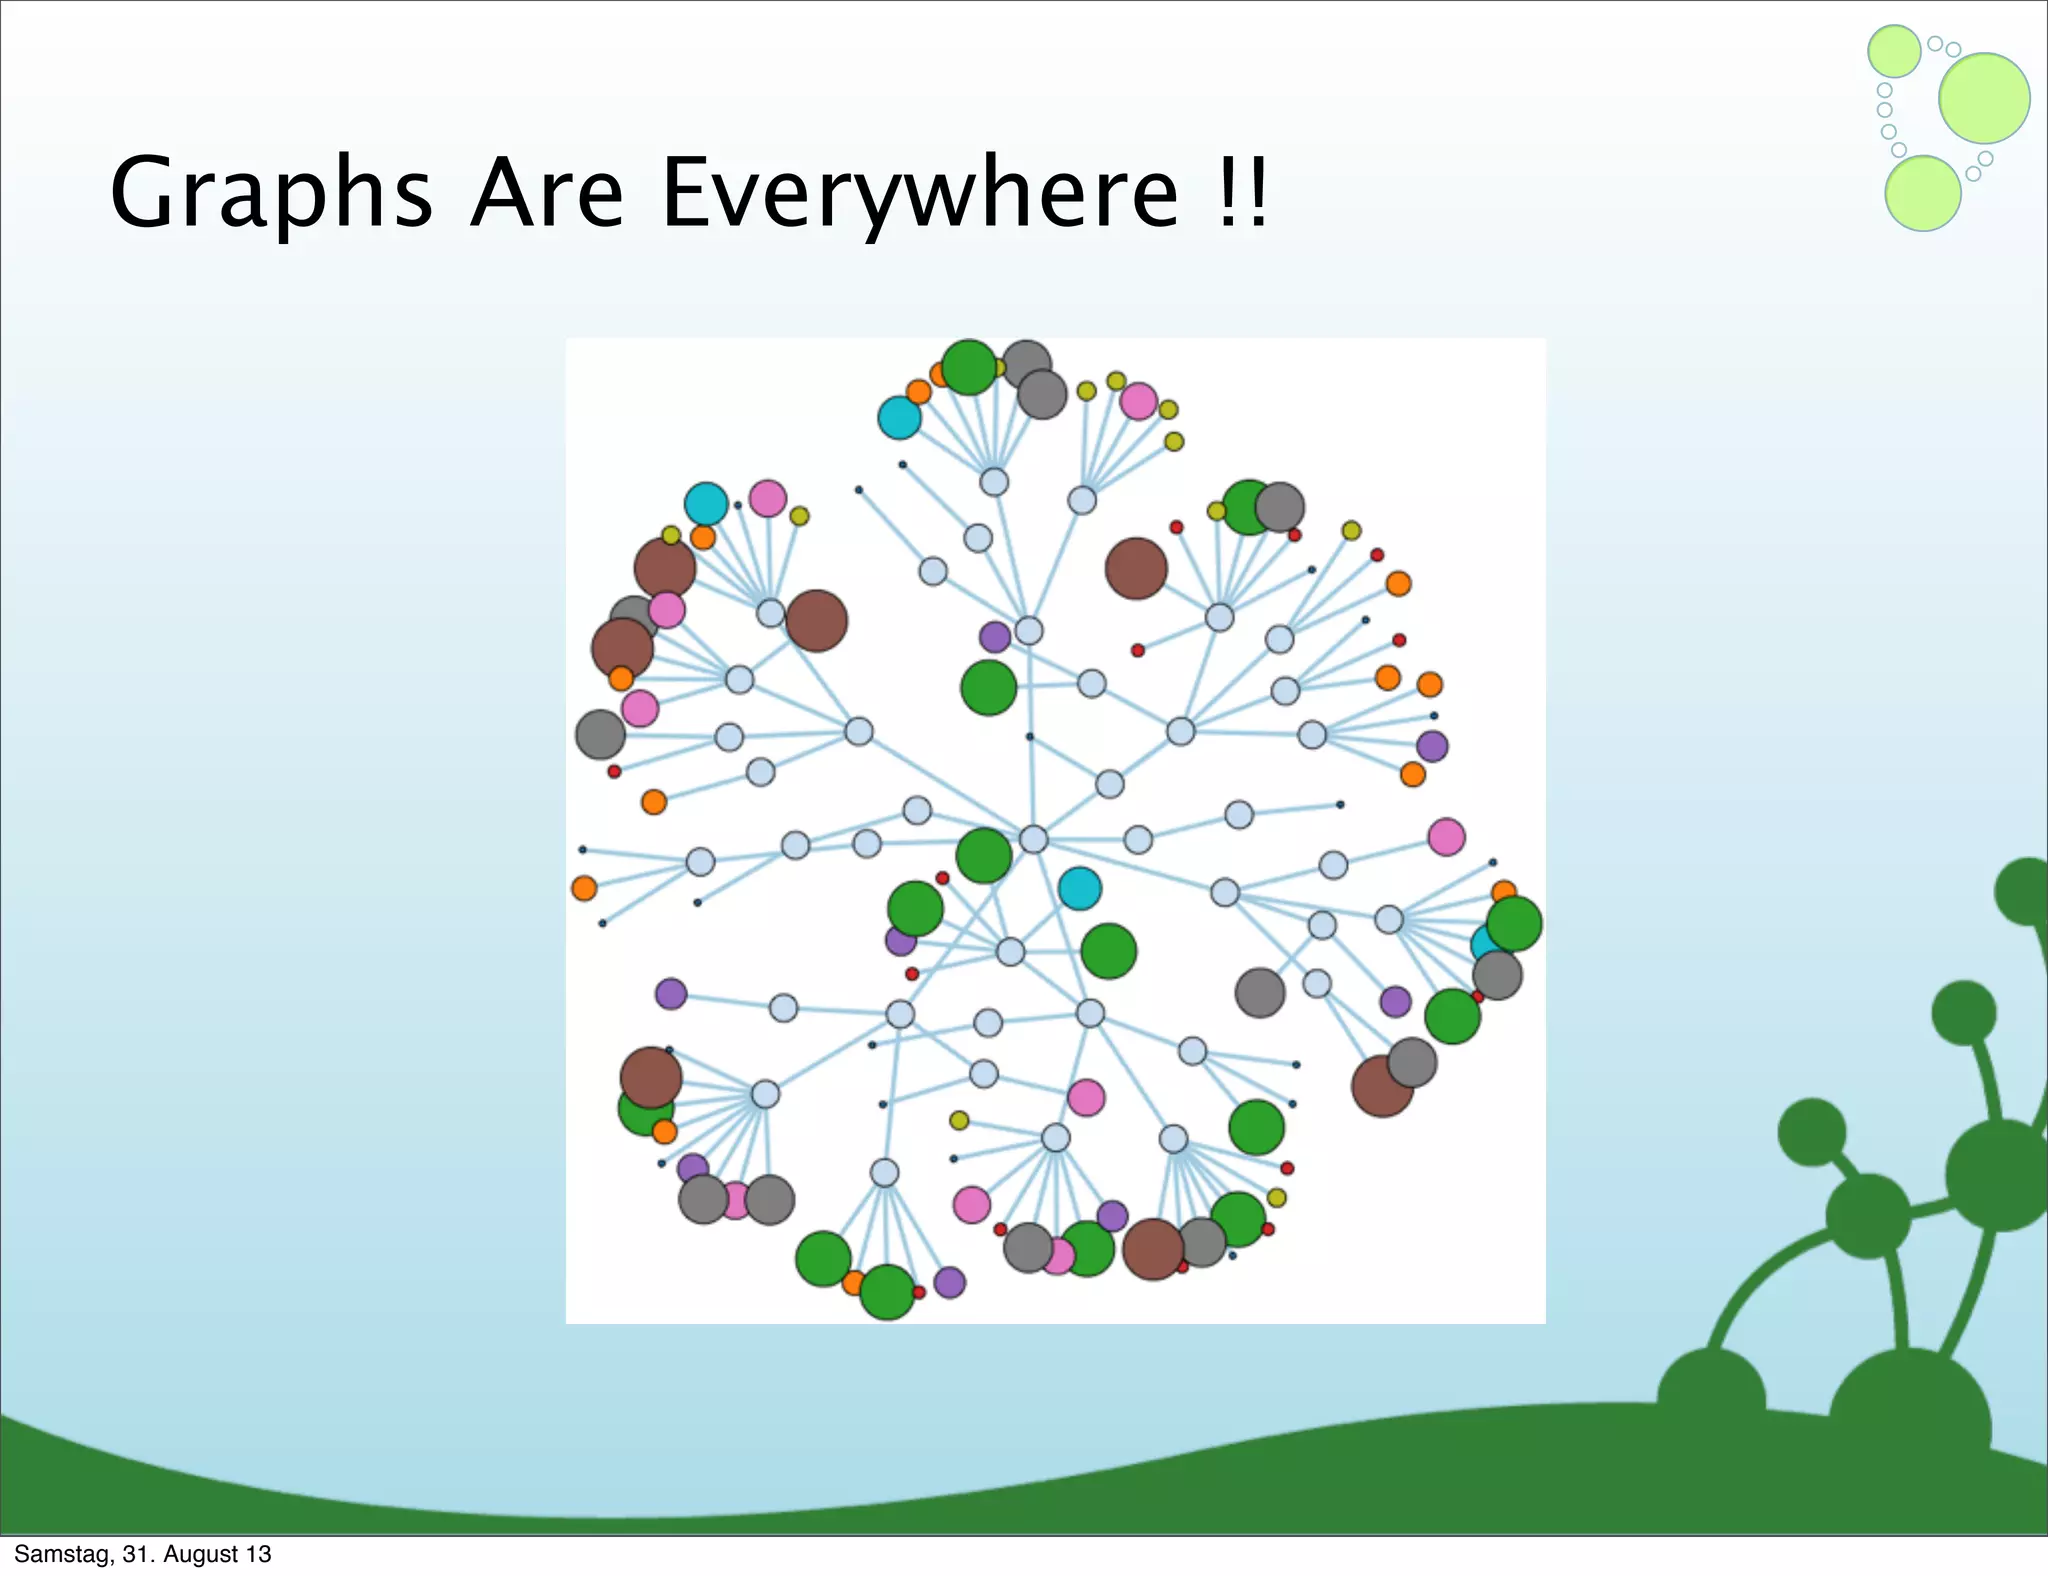
Graphs are widely applicable in social networks, impact analysis, route finding, recommendations, logistics, access control, and fraud analysis.
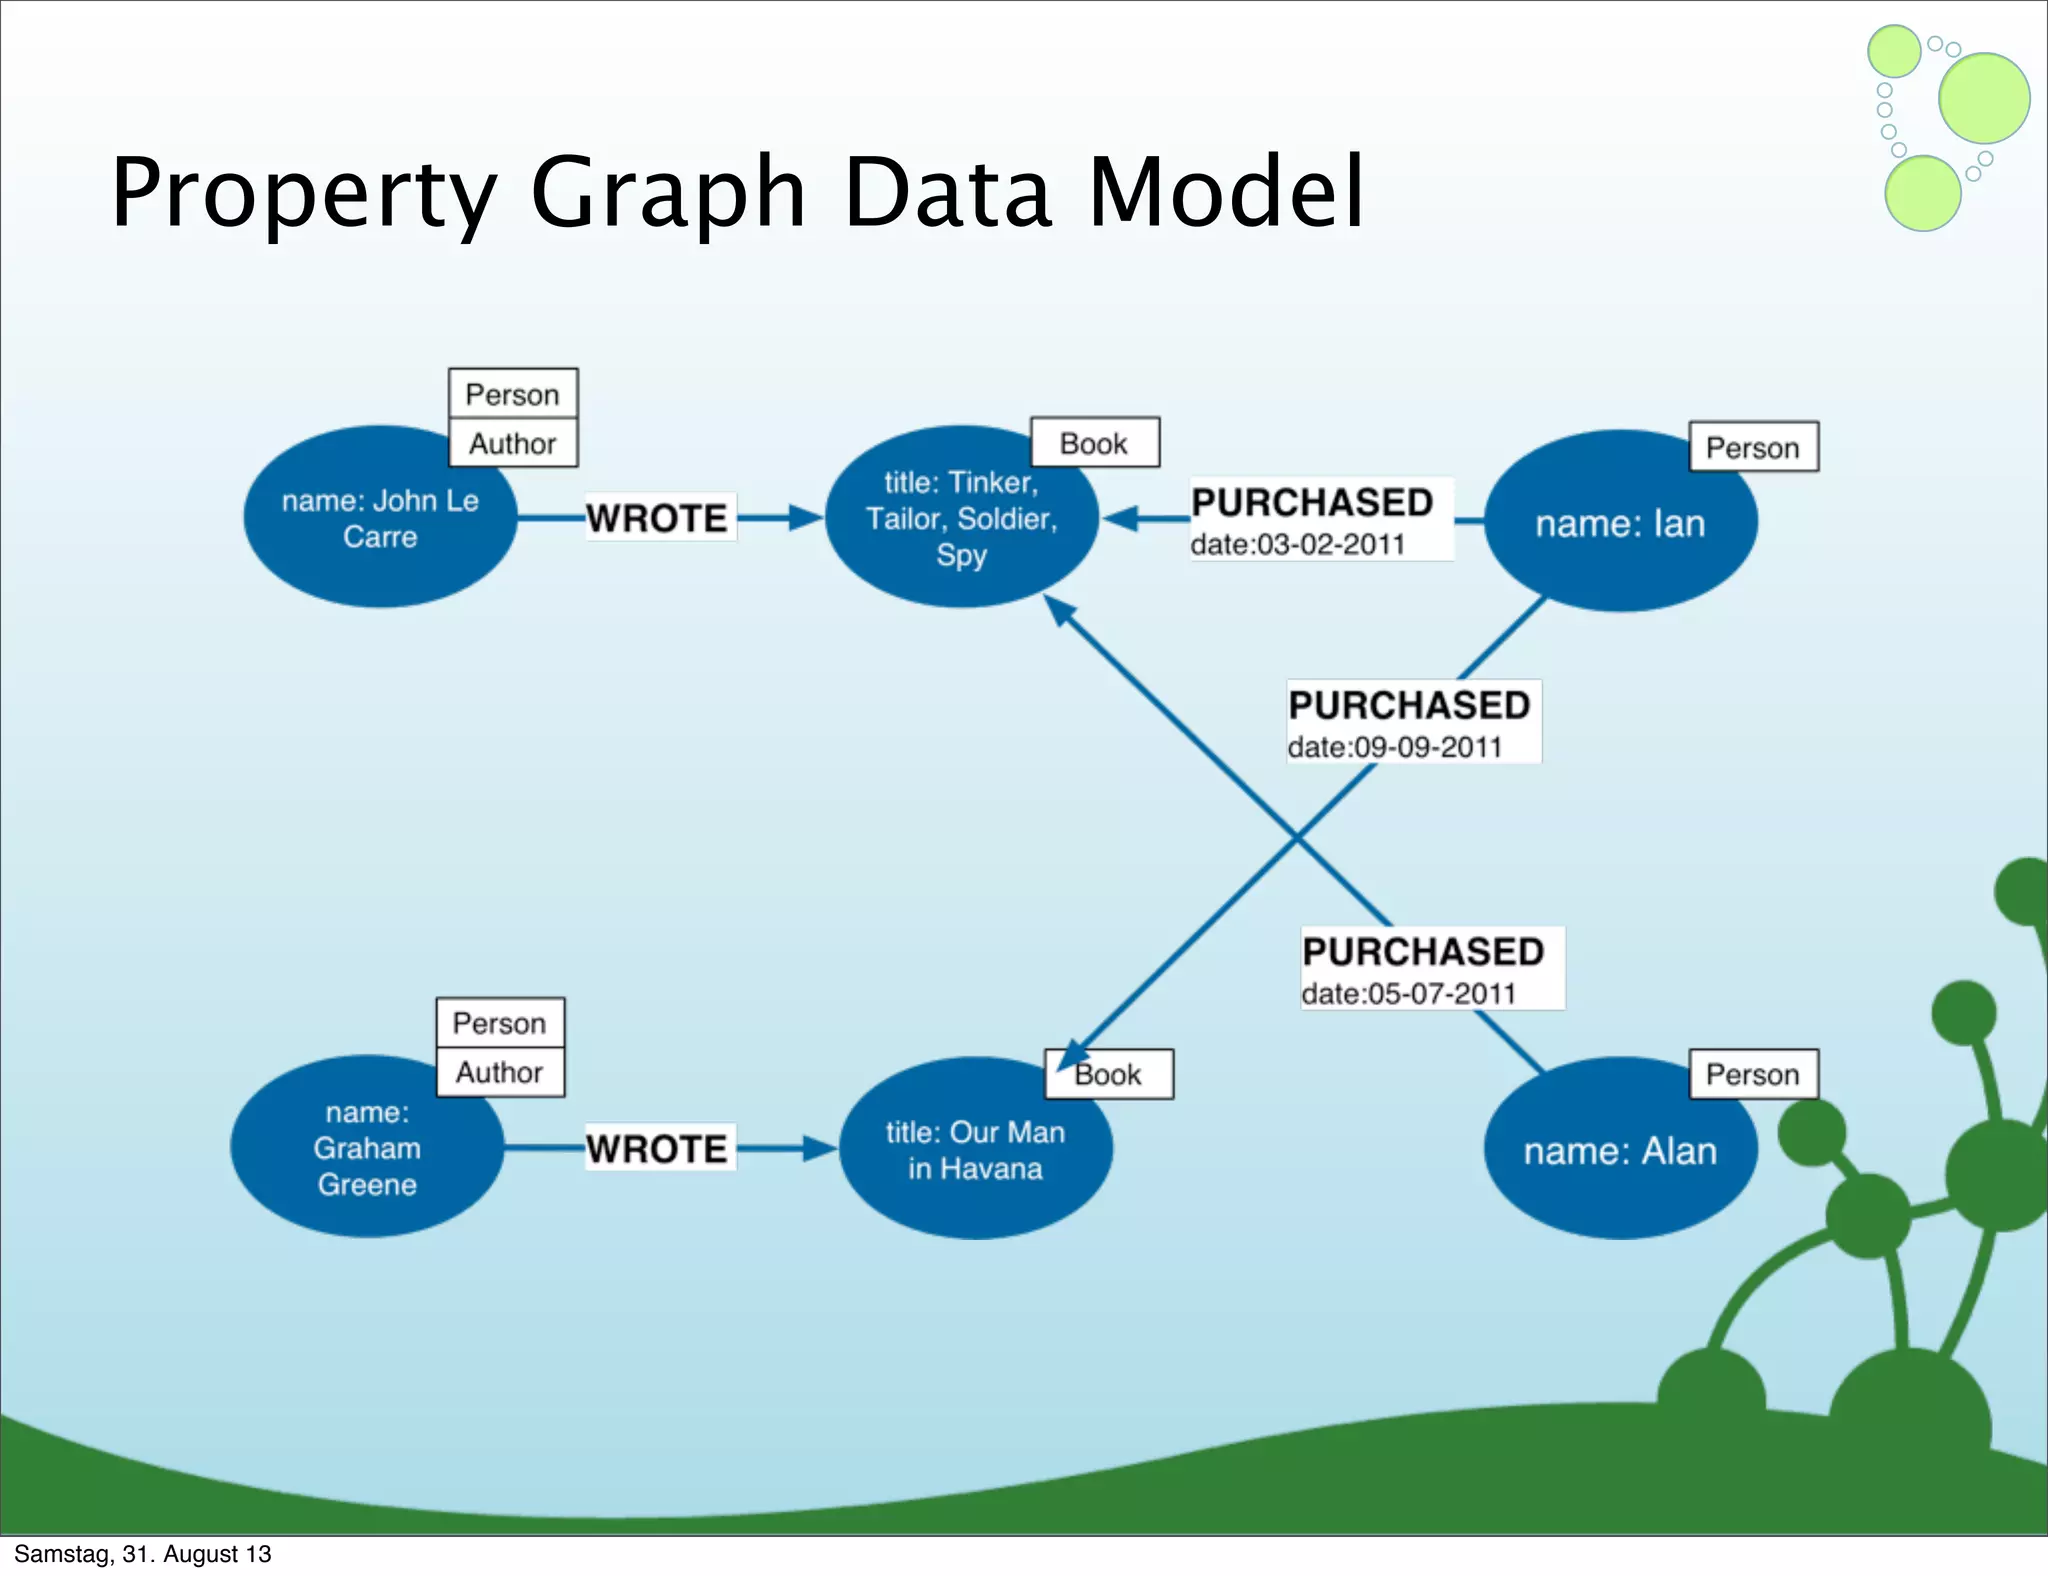
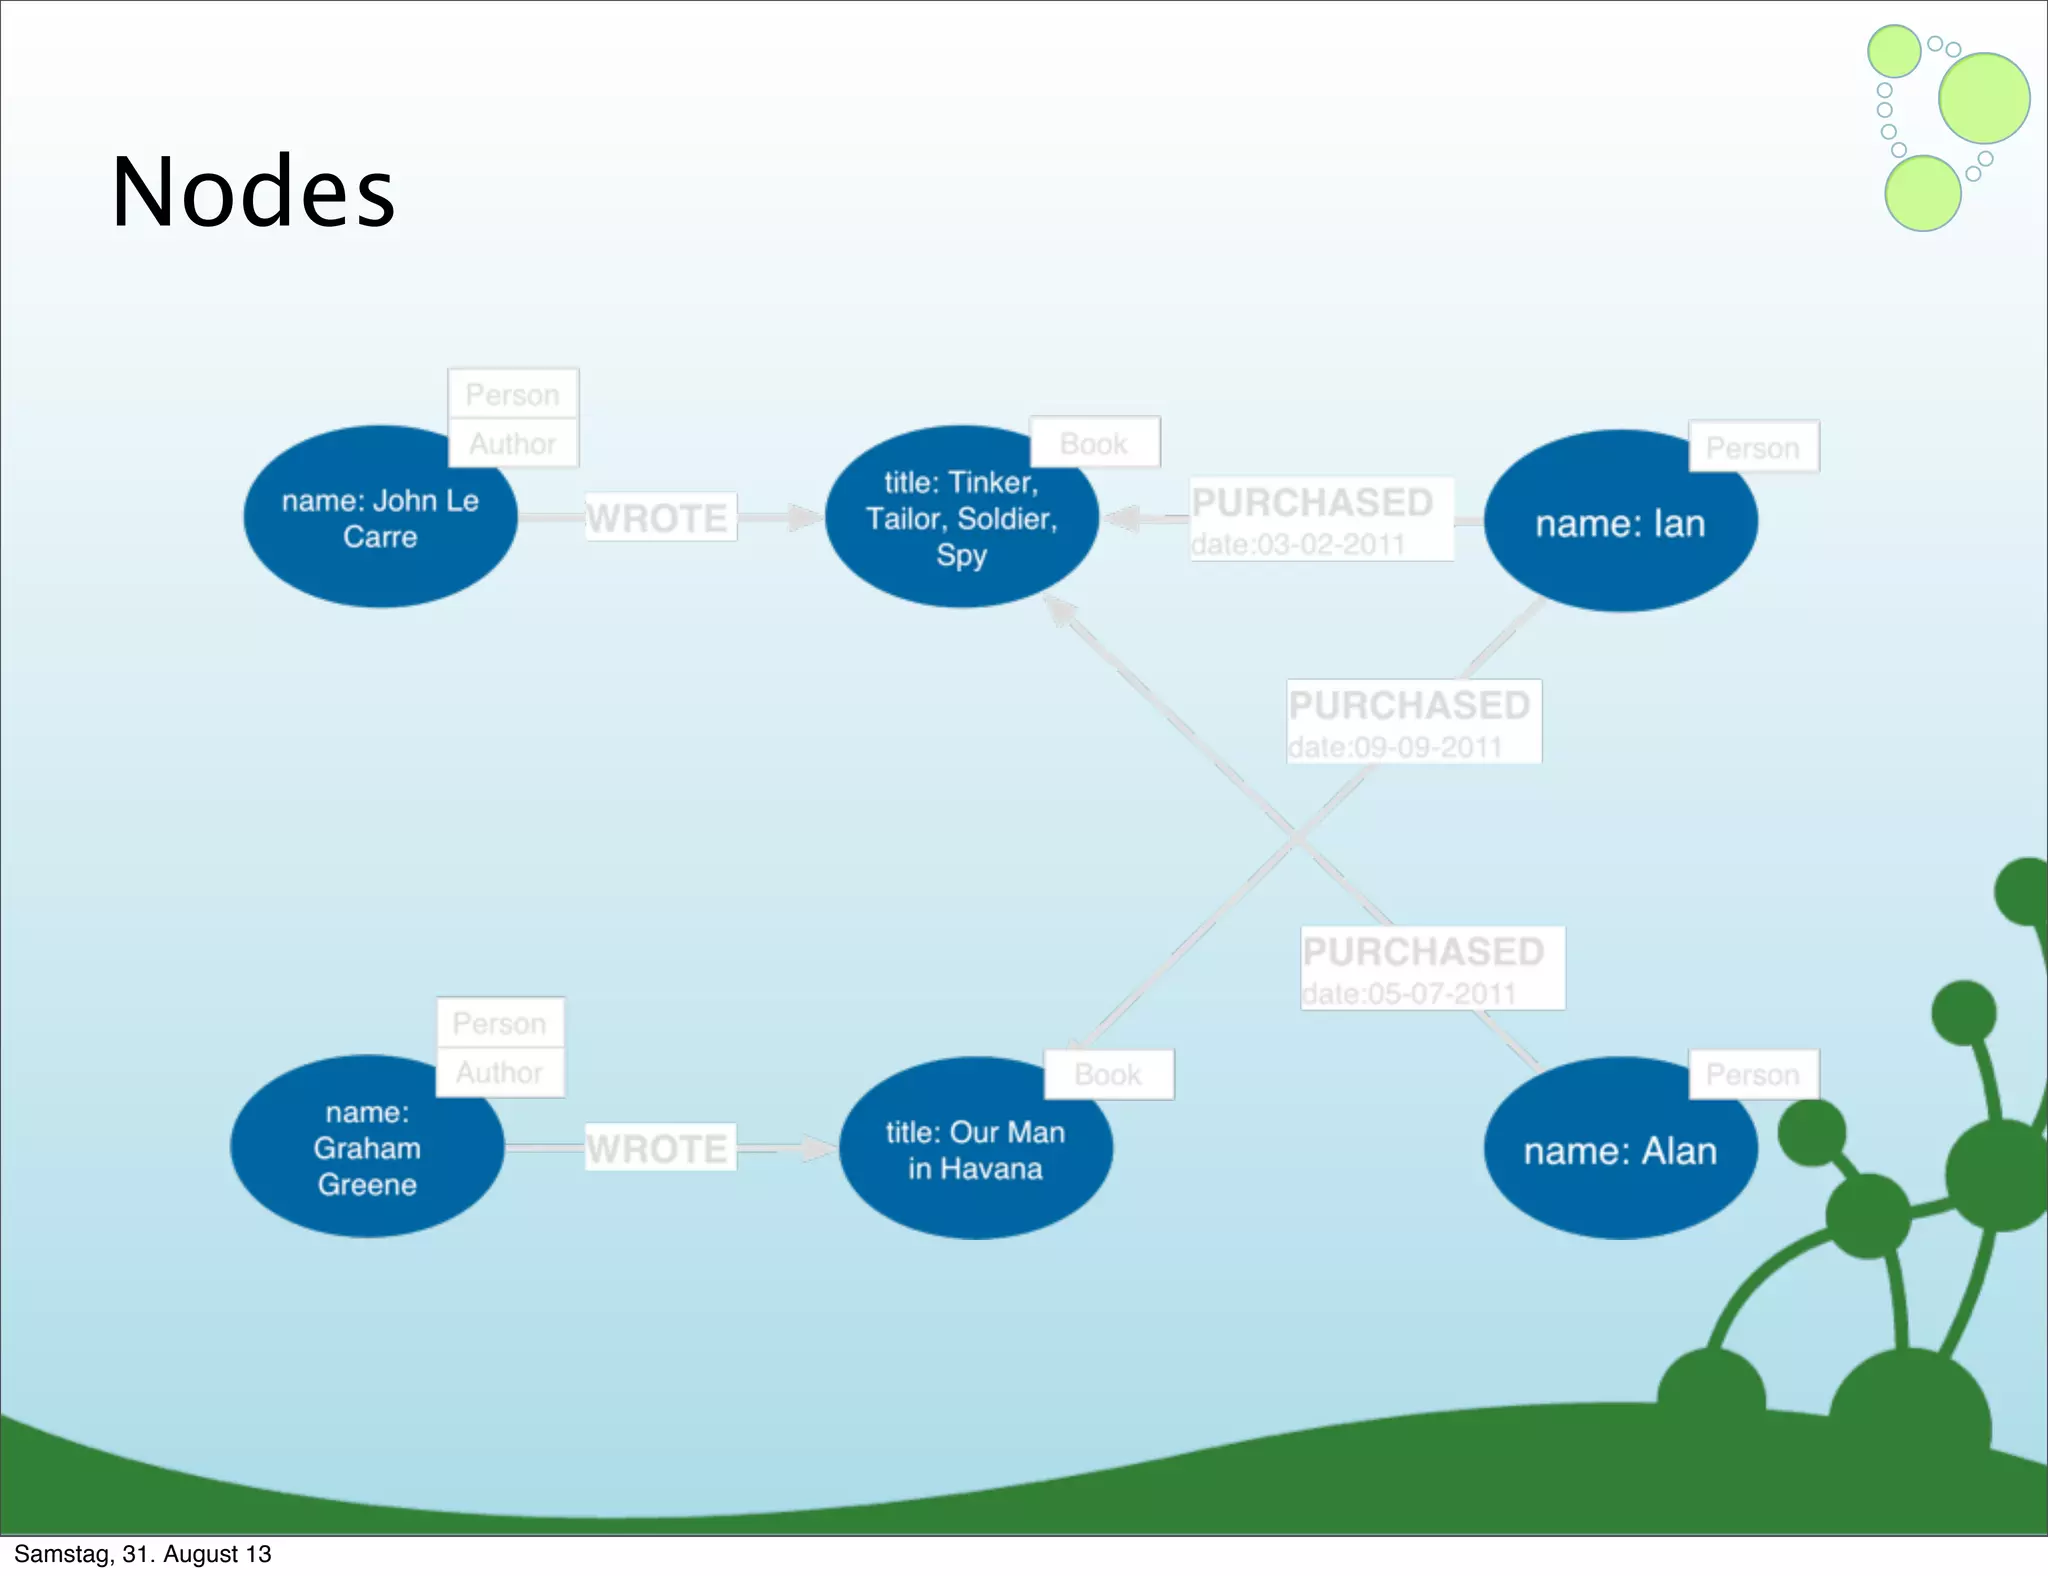
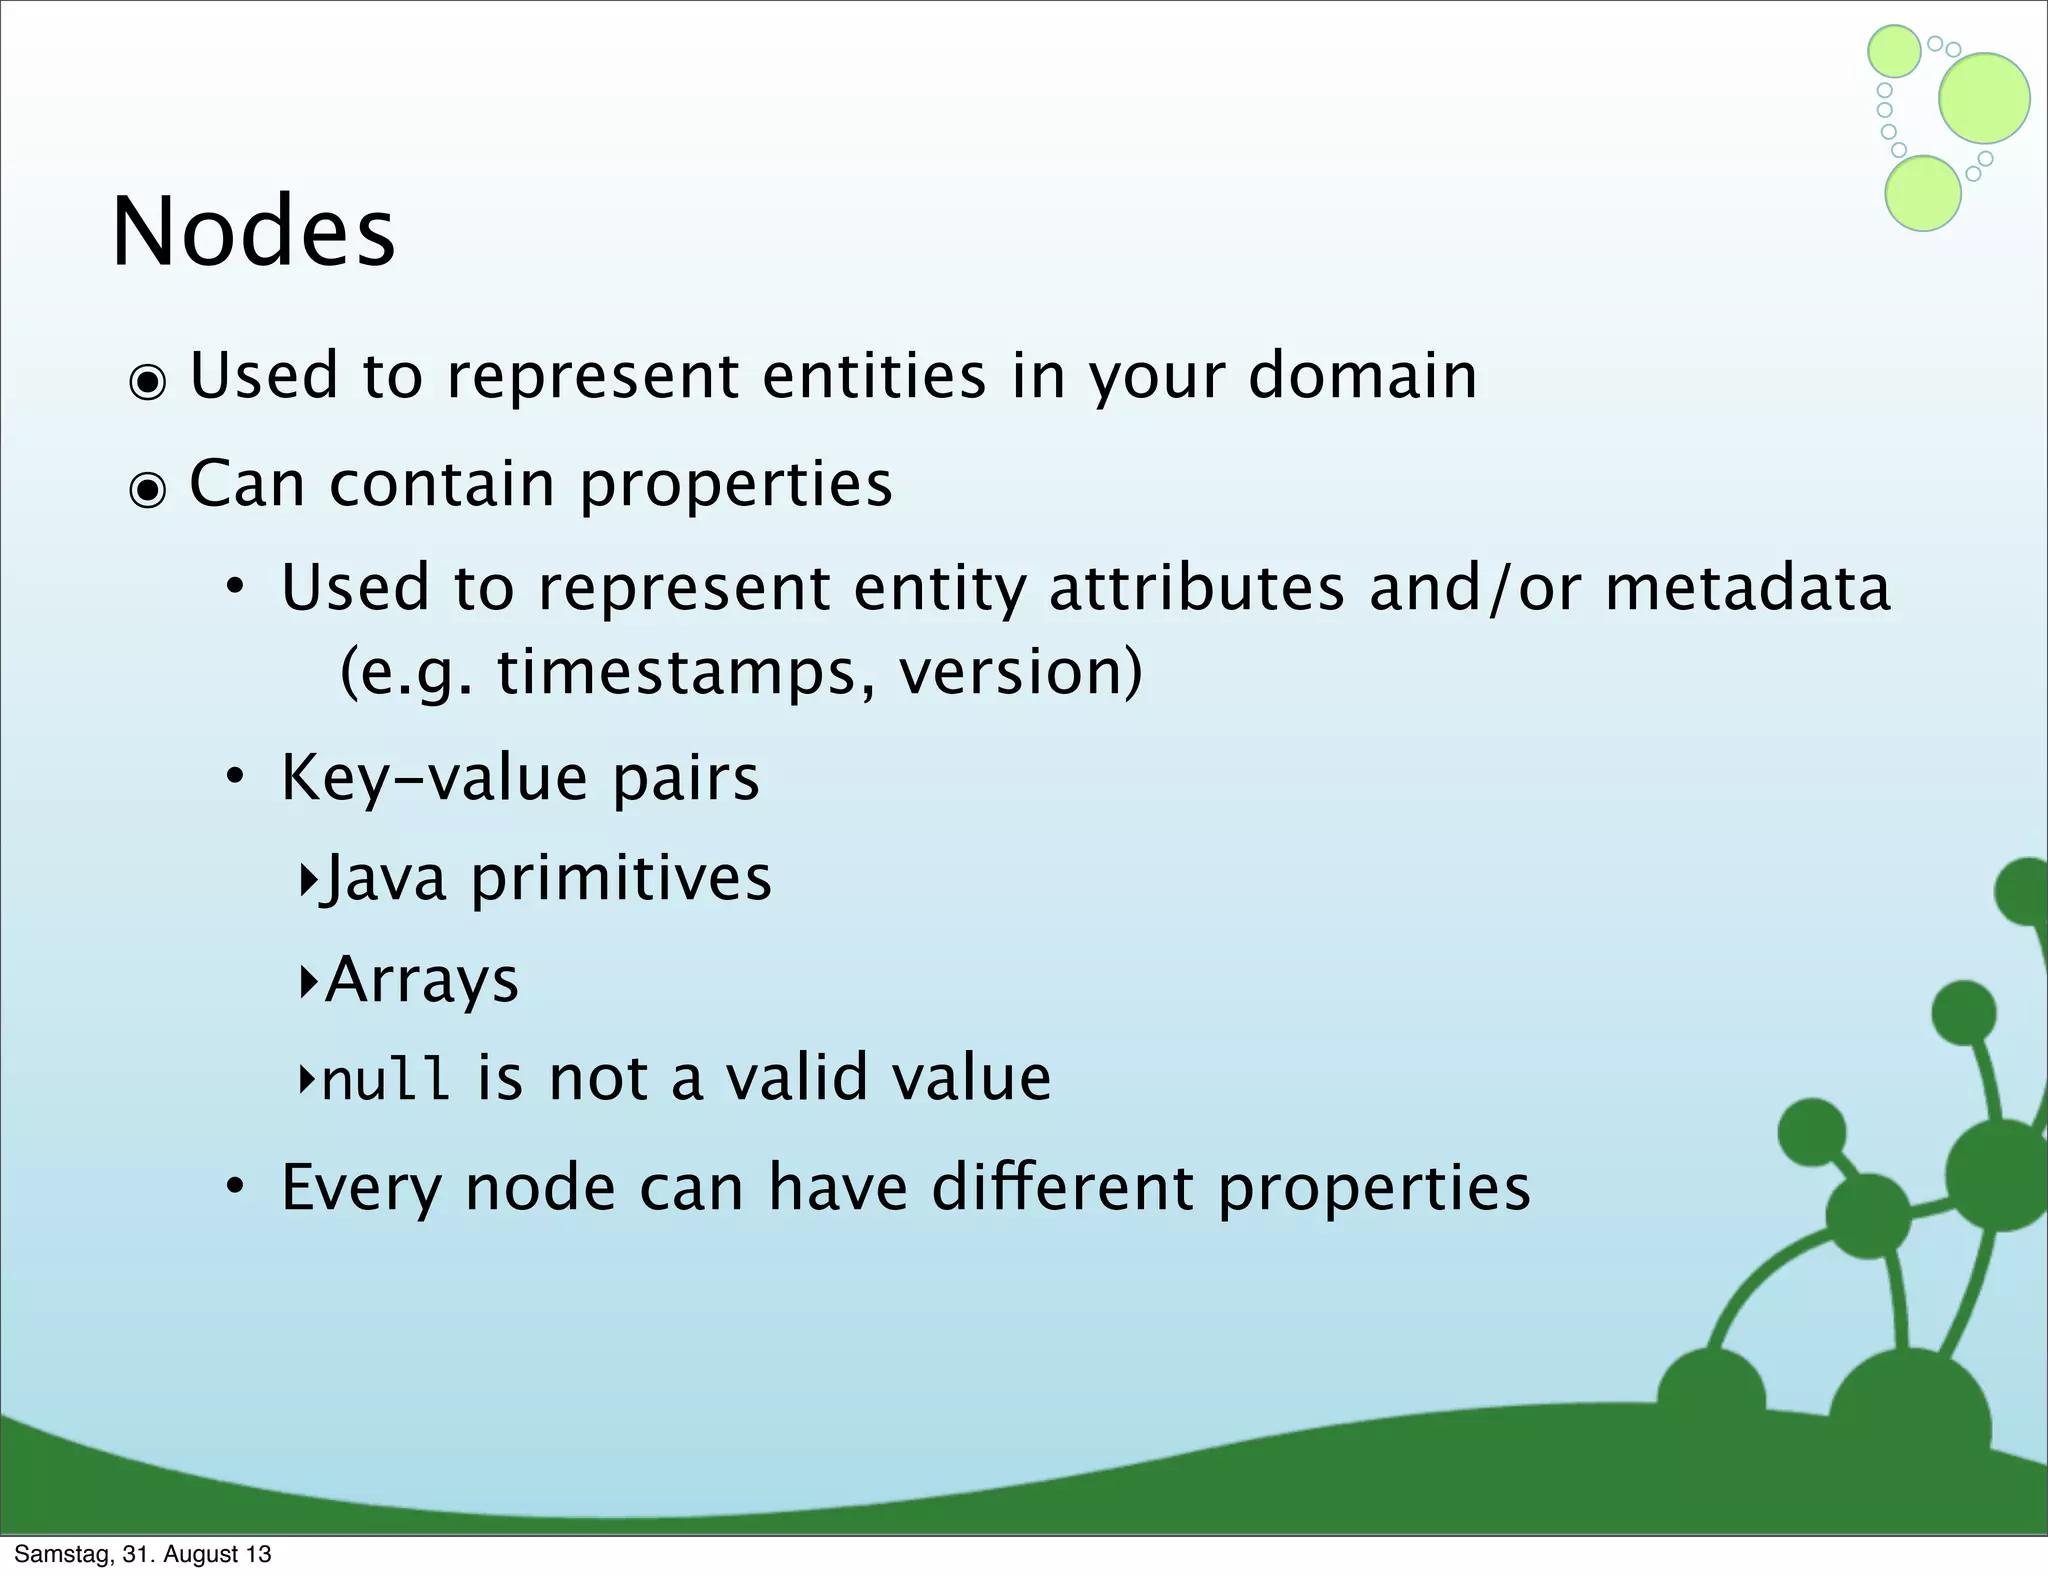
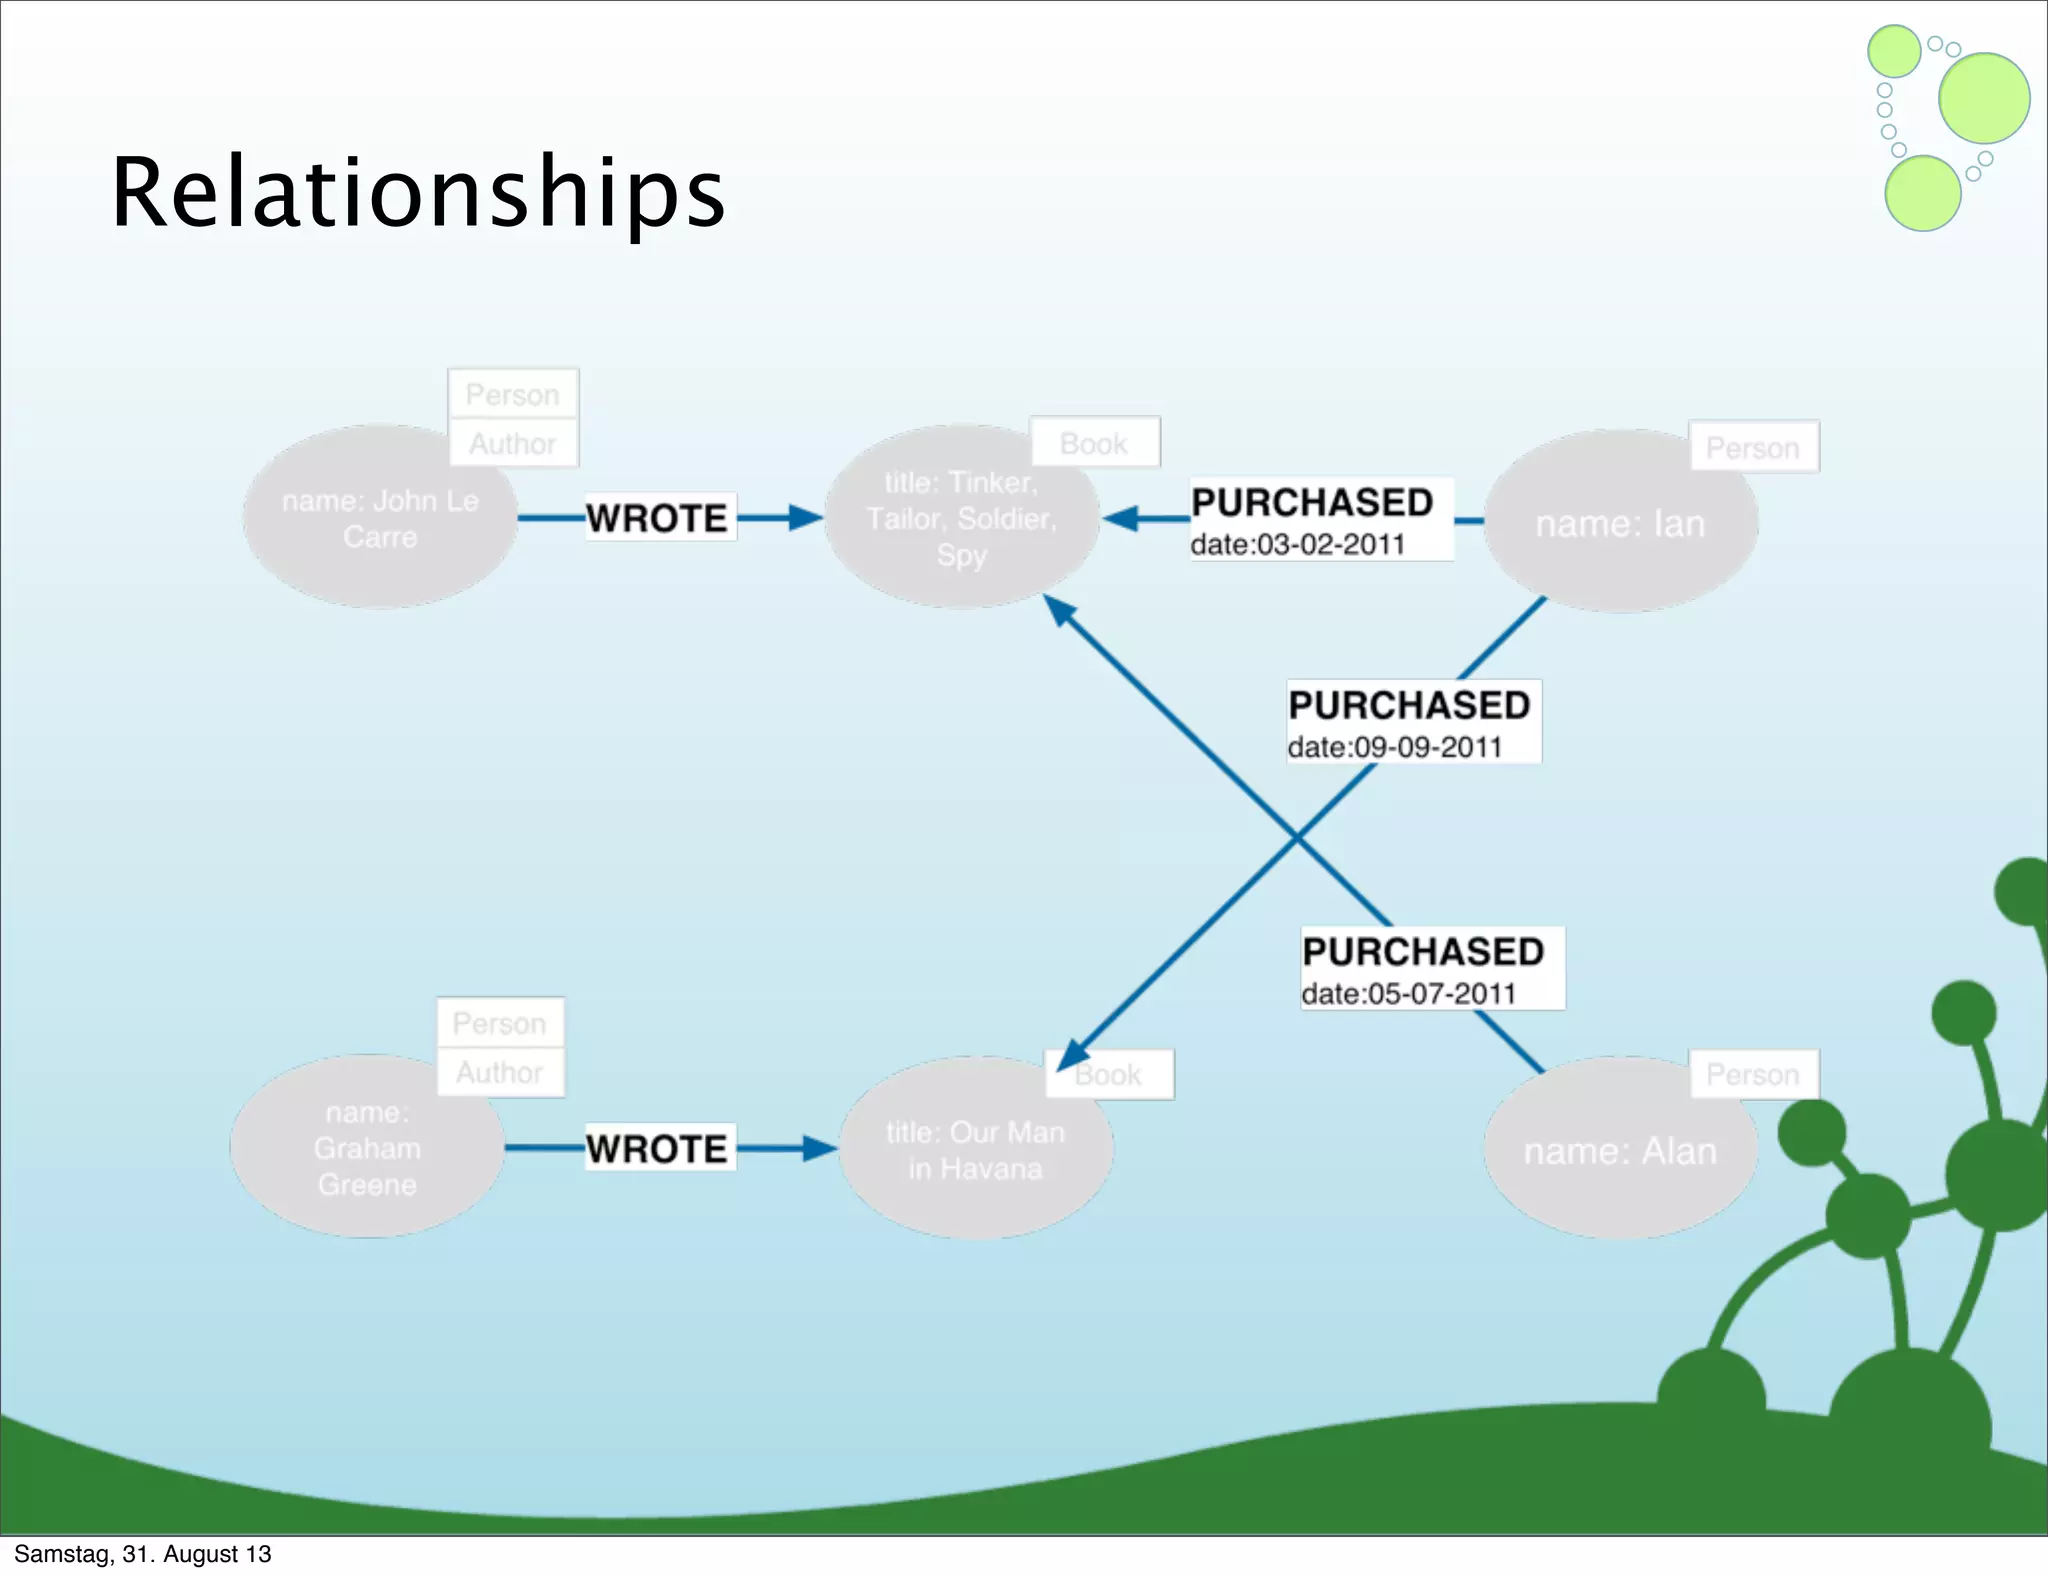
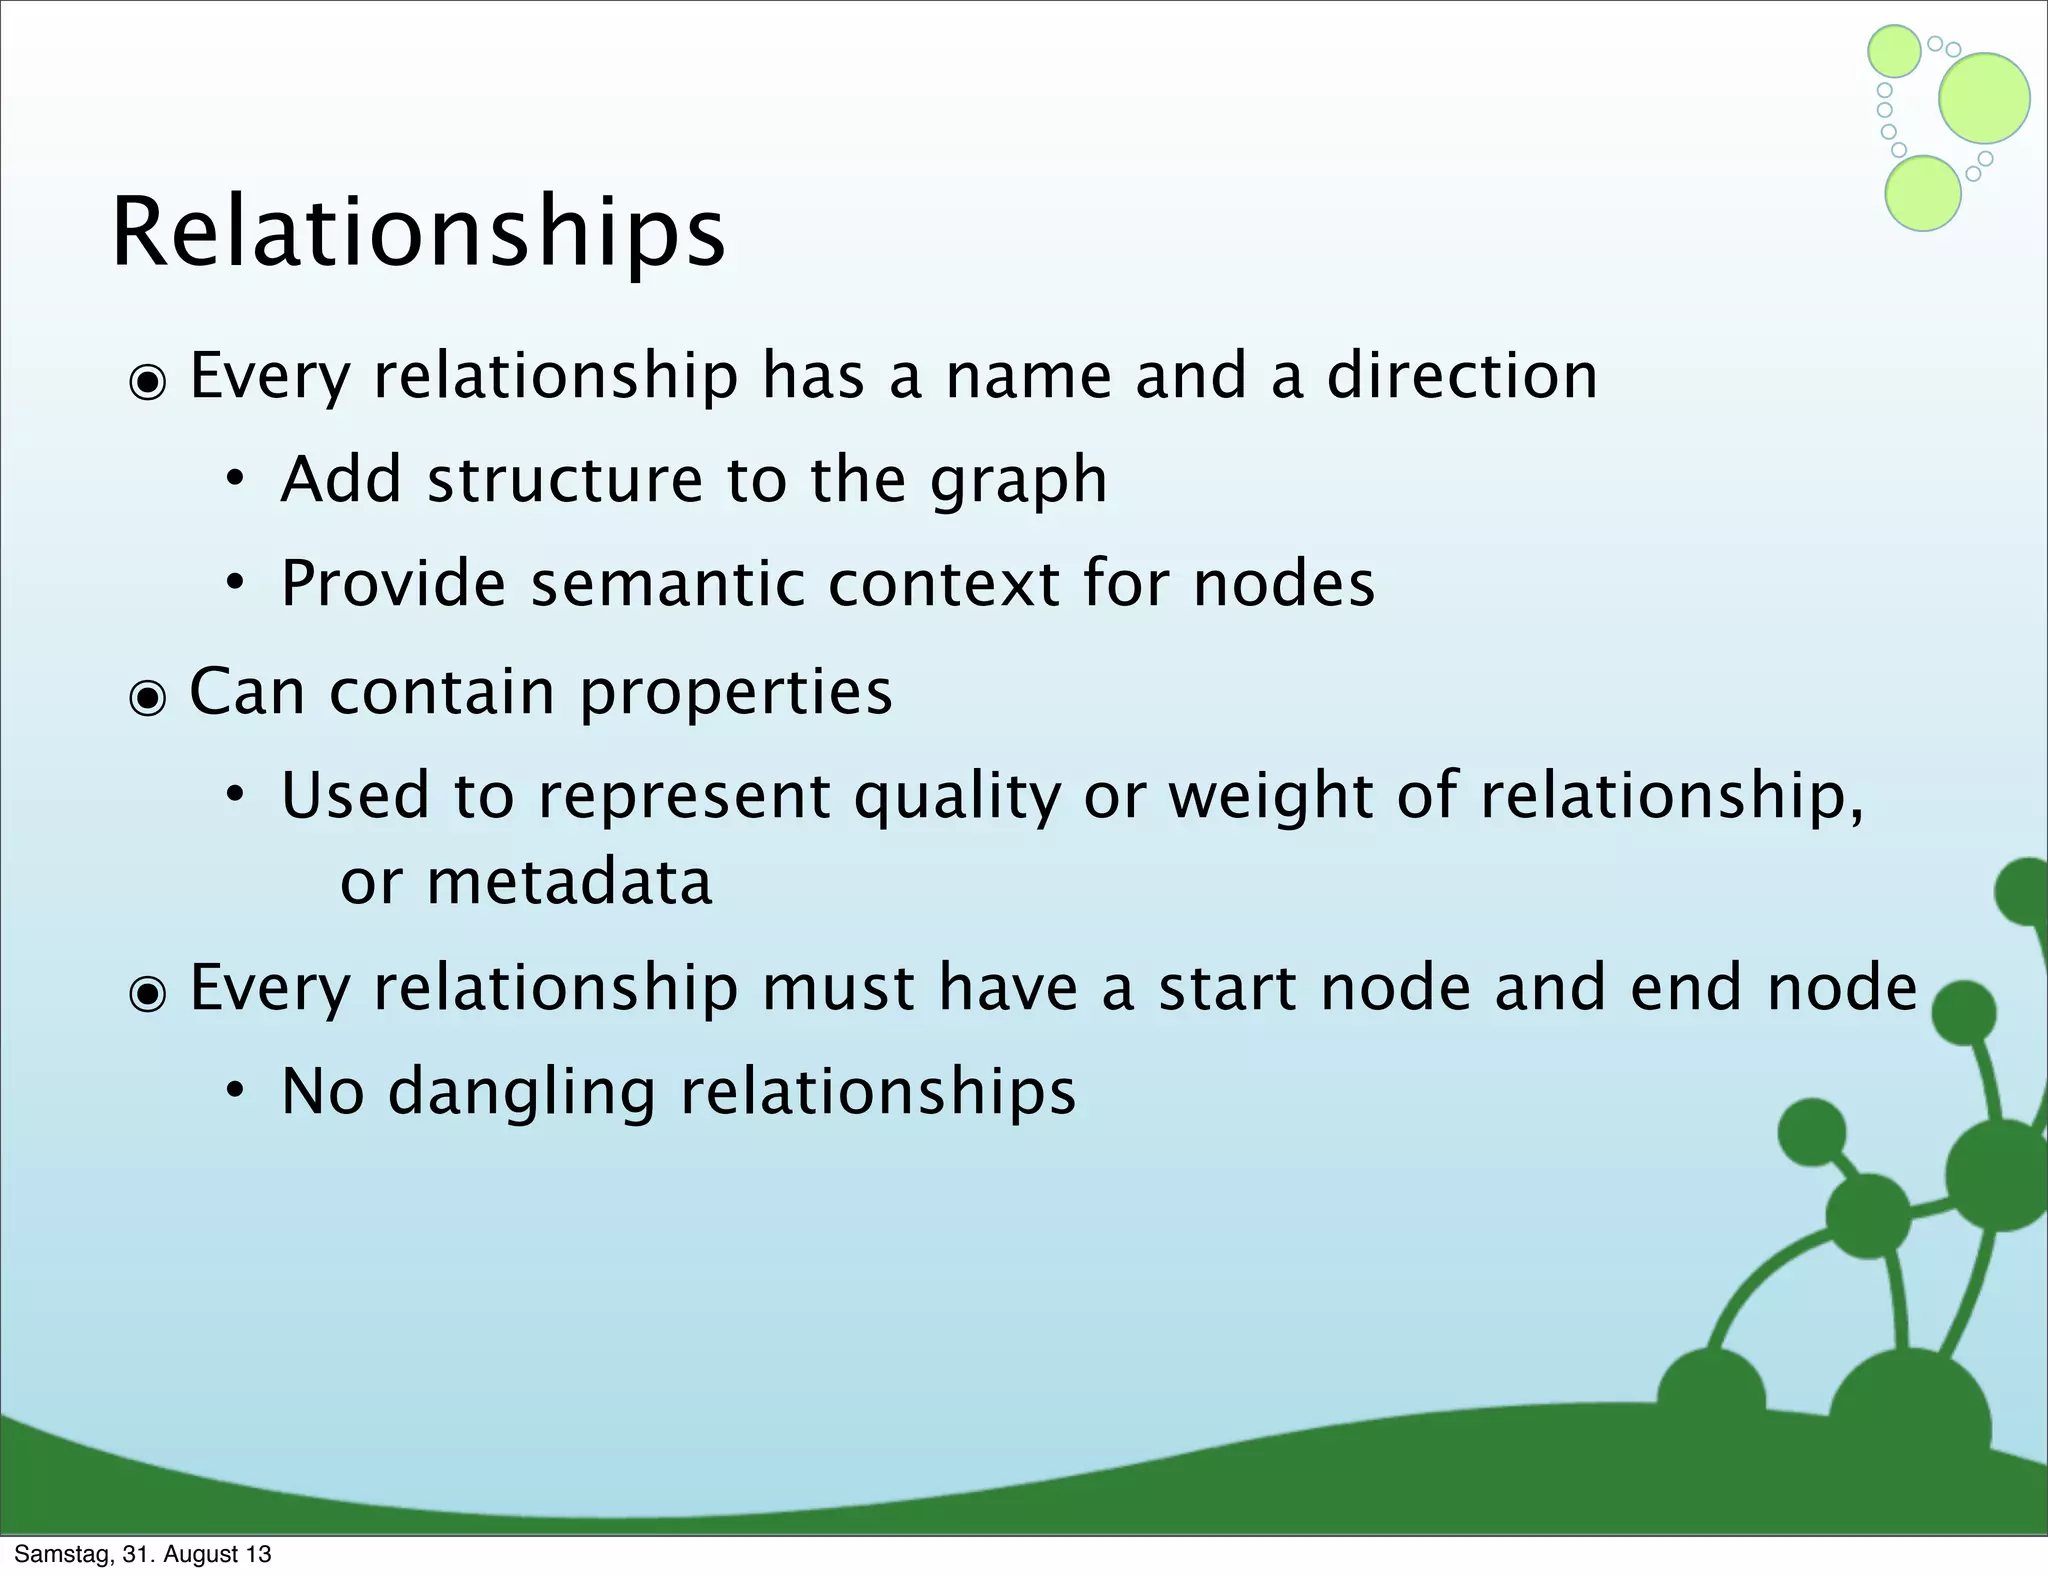
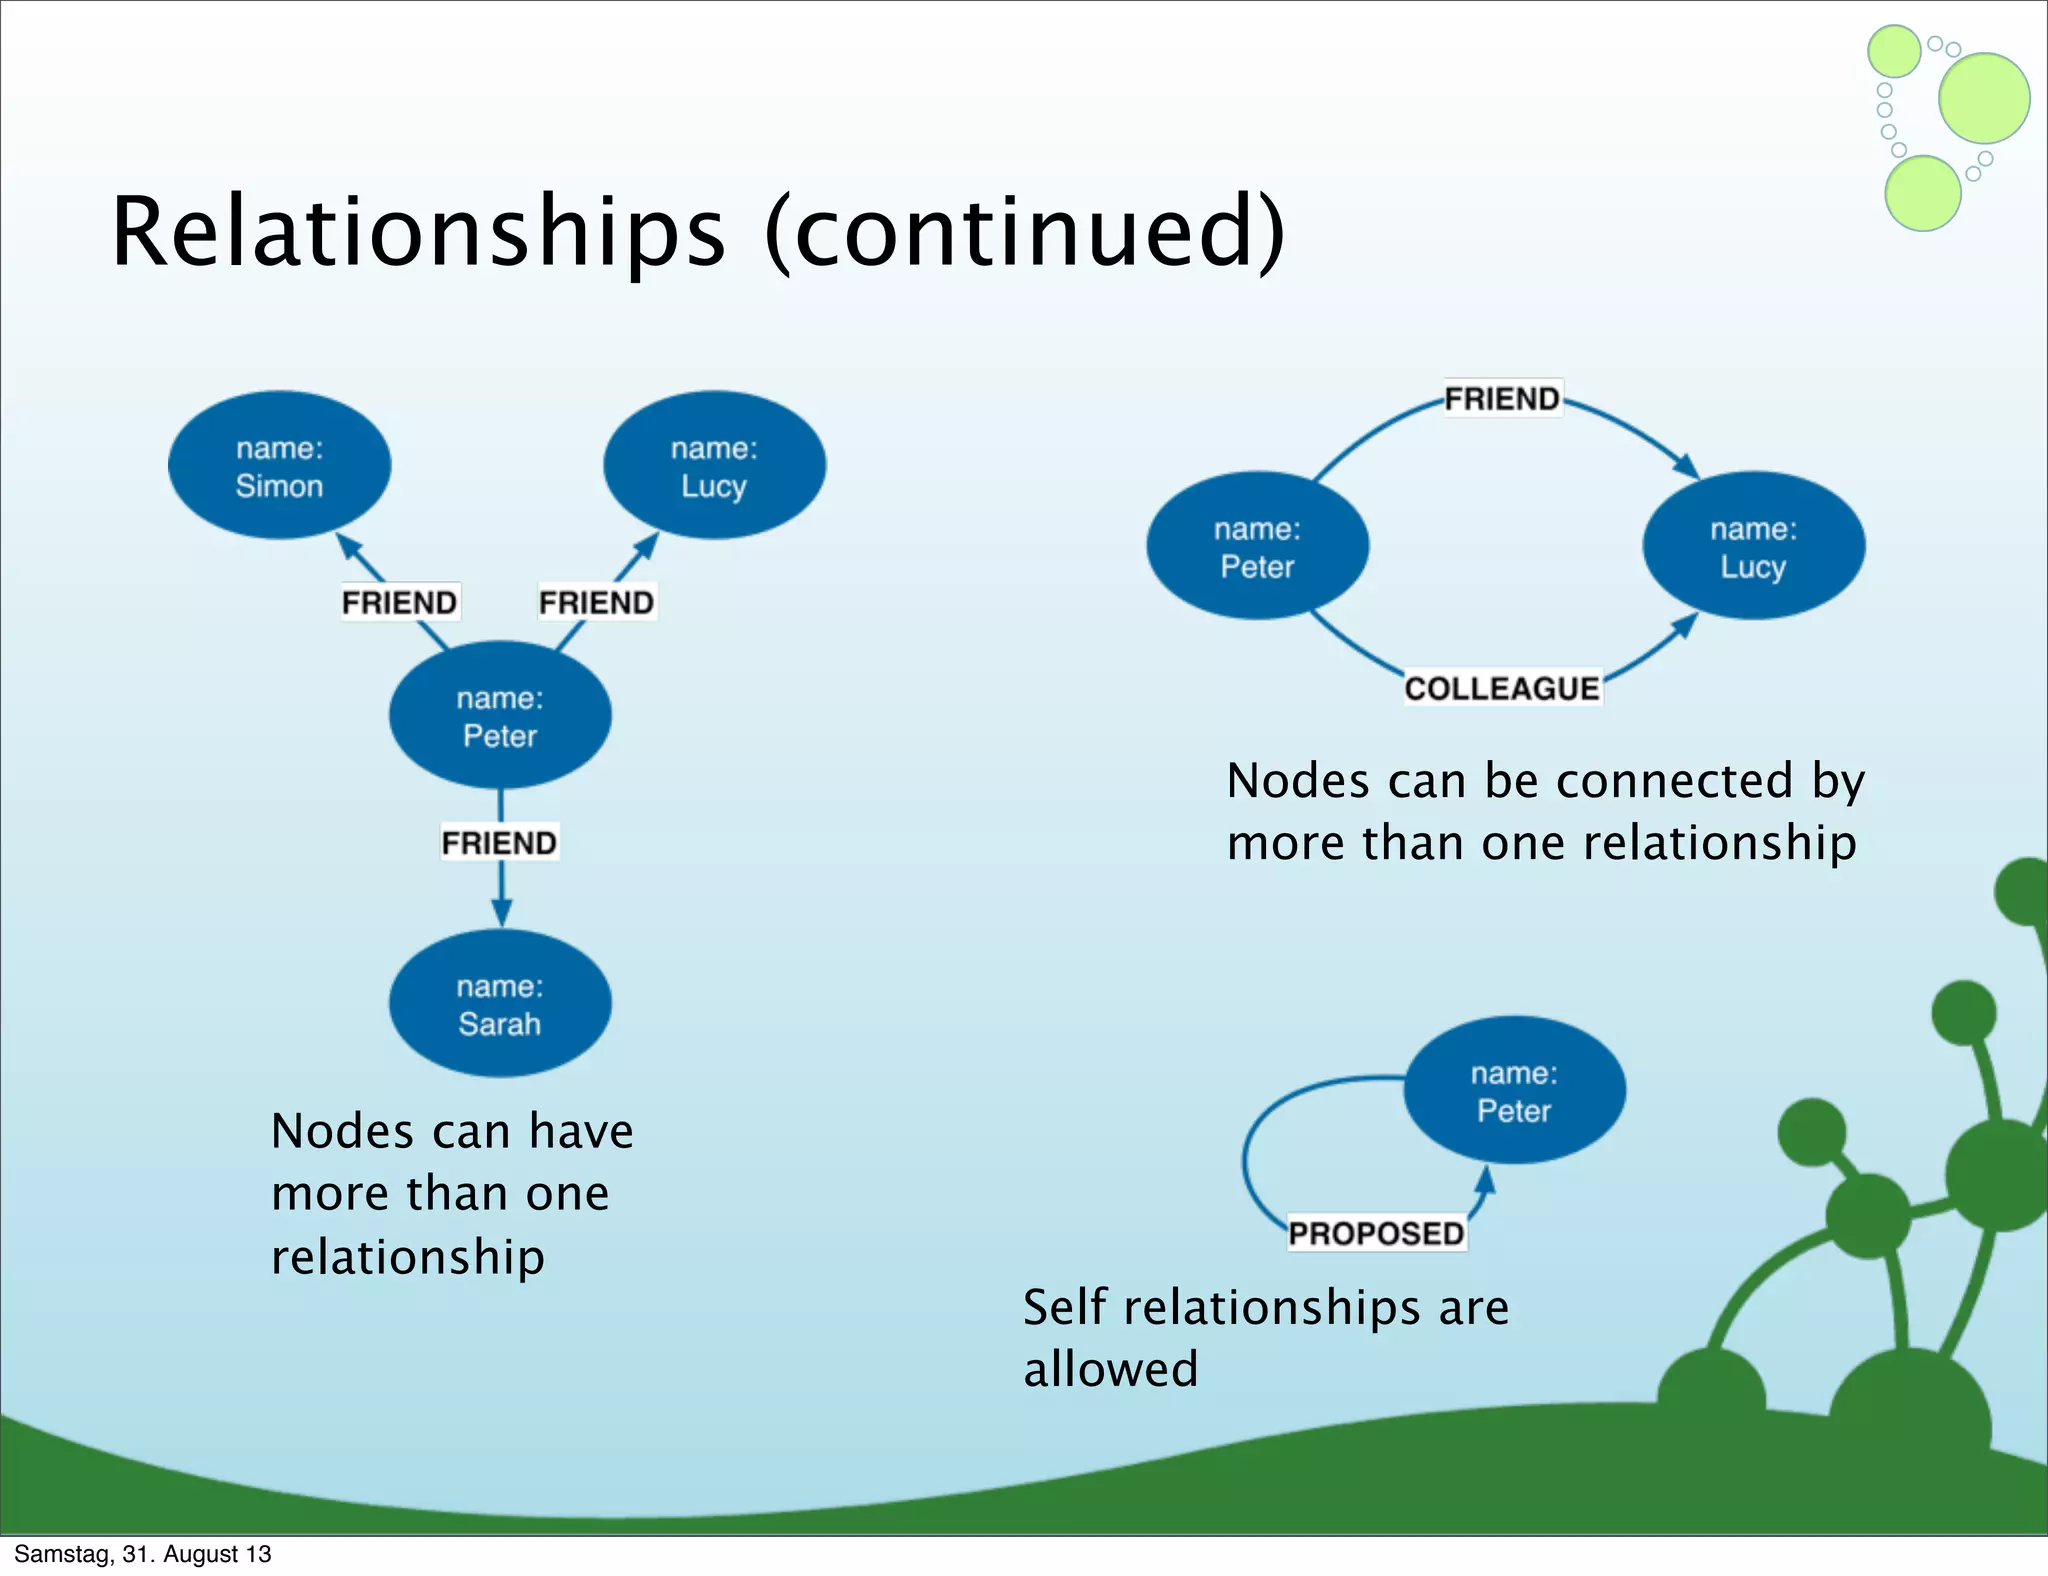
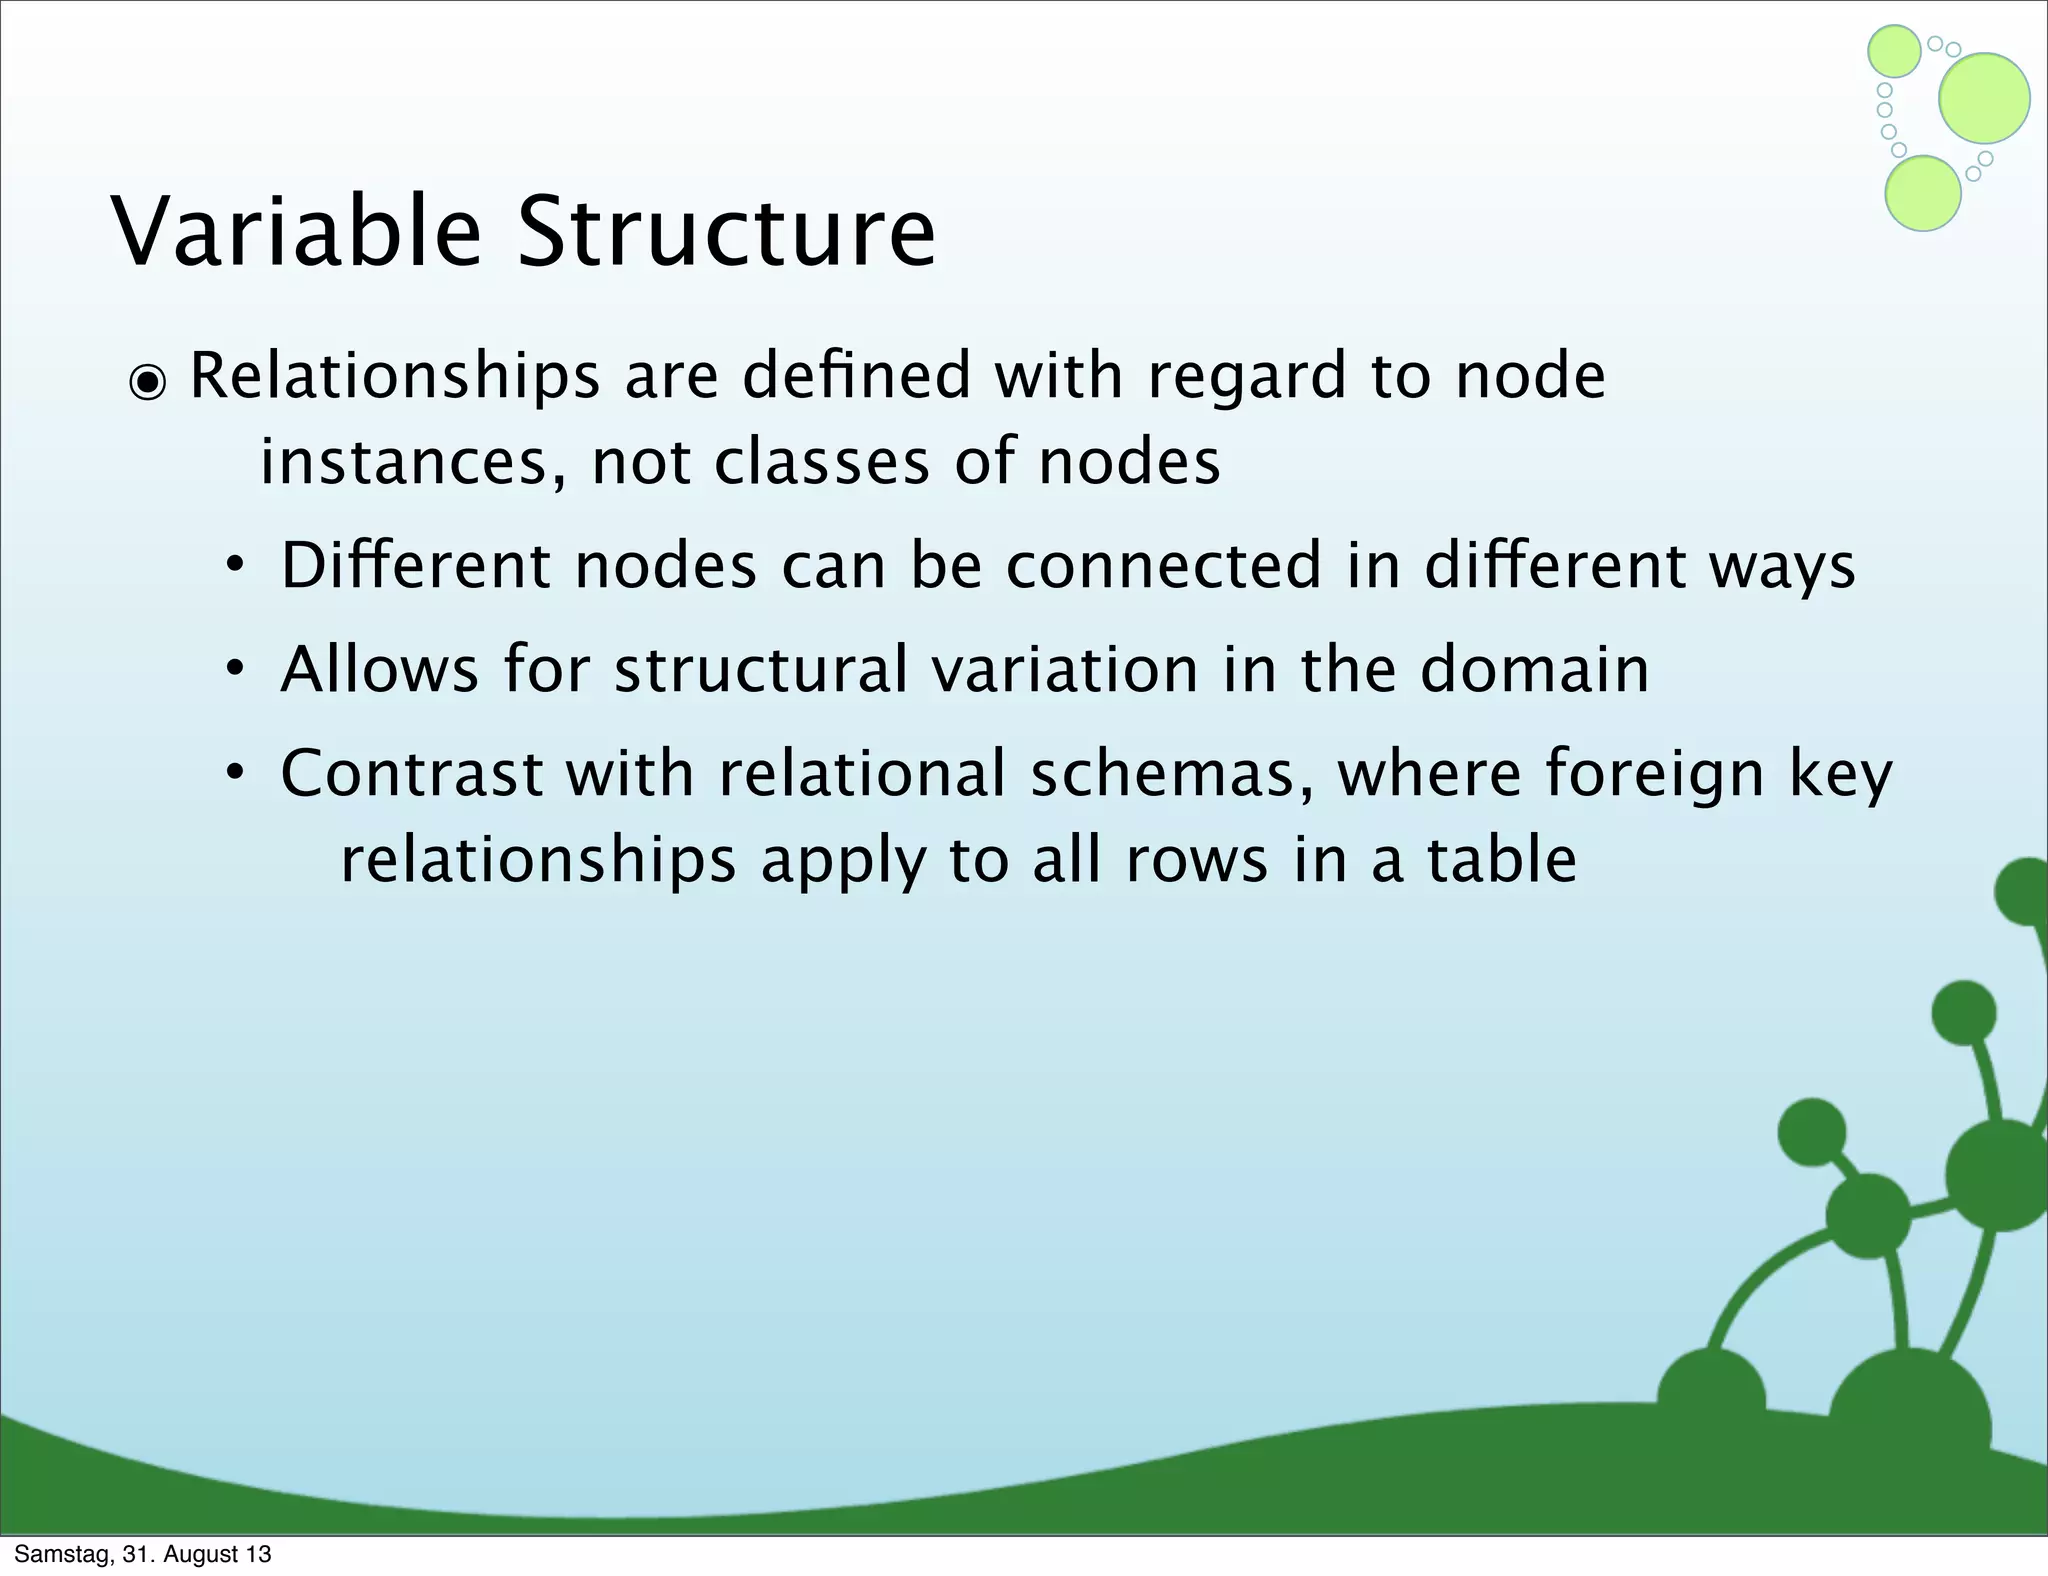
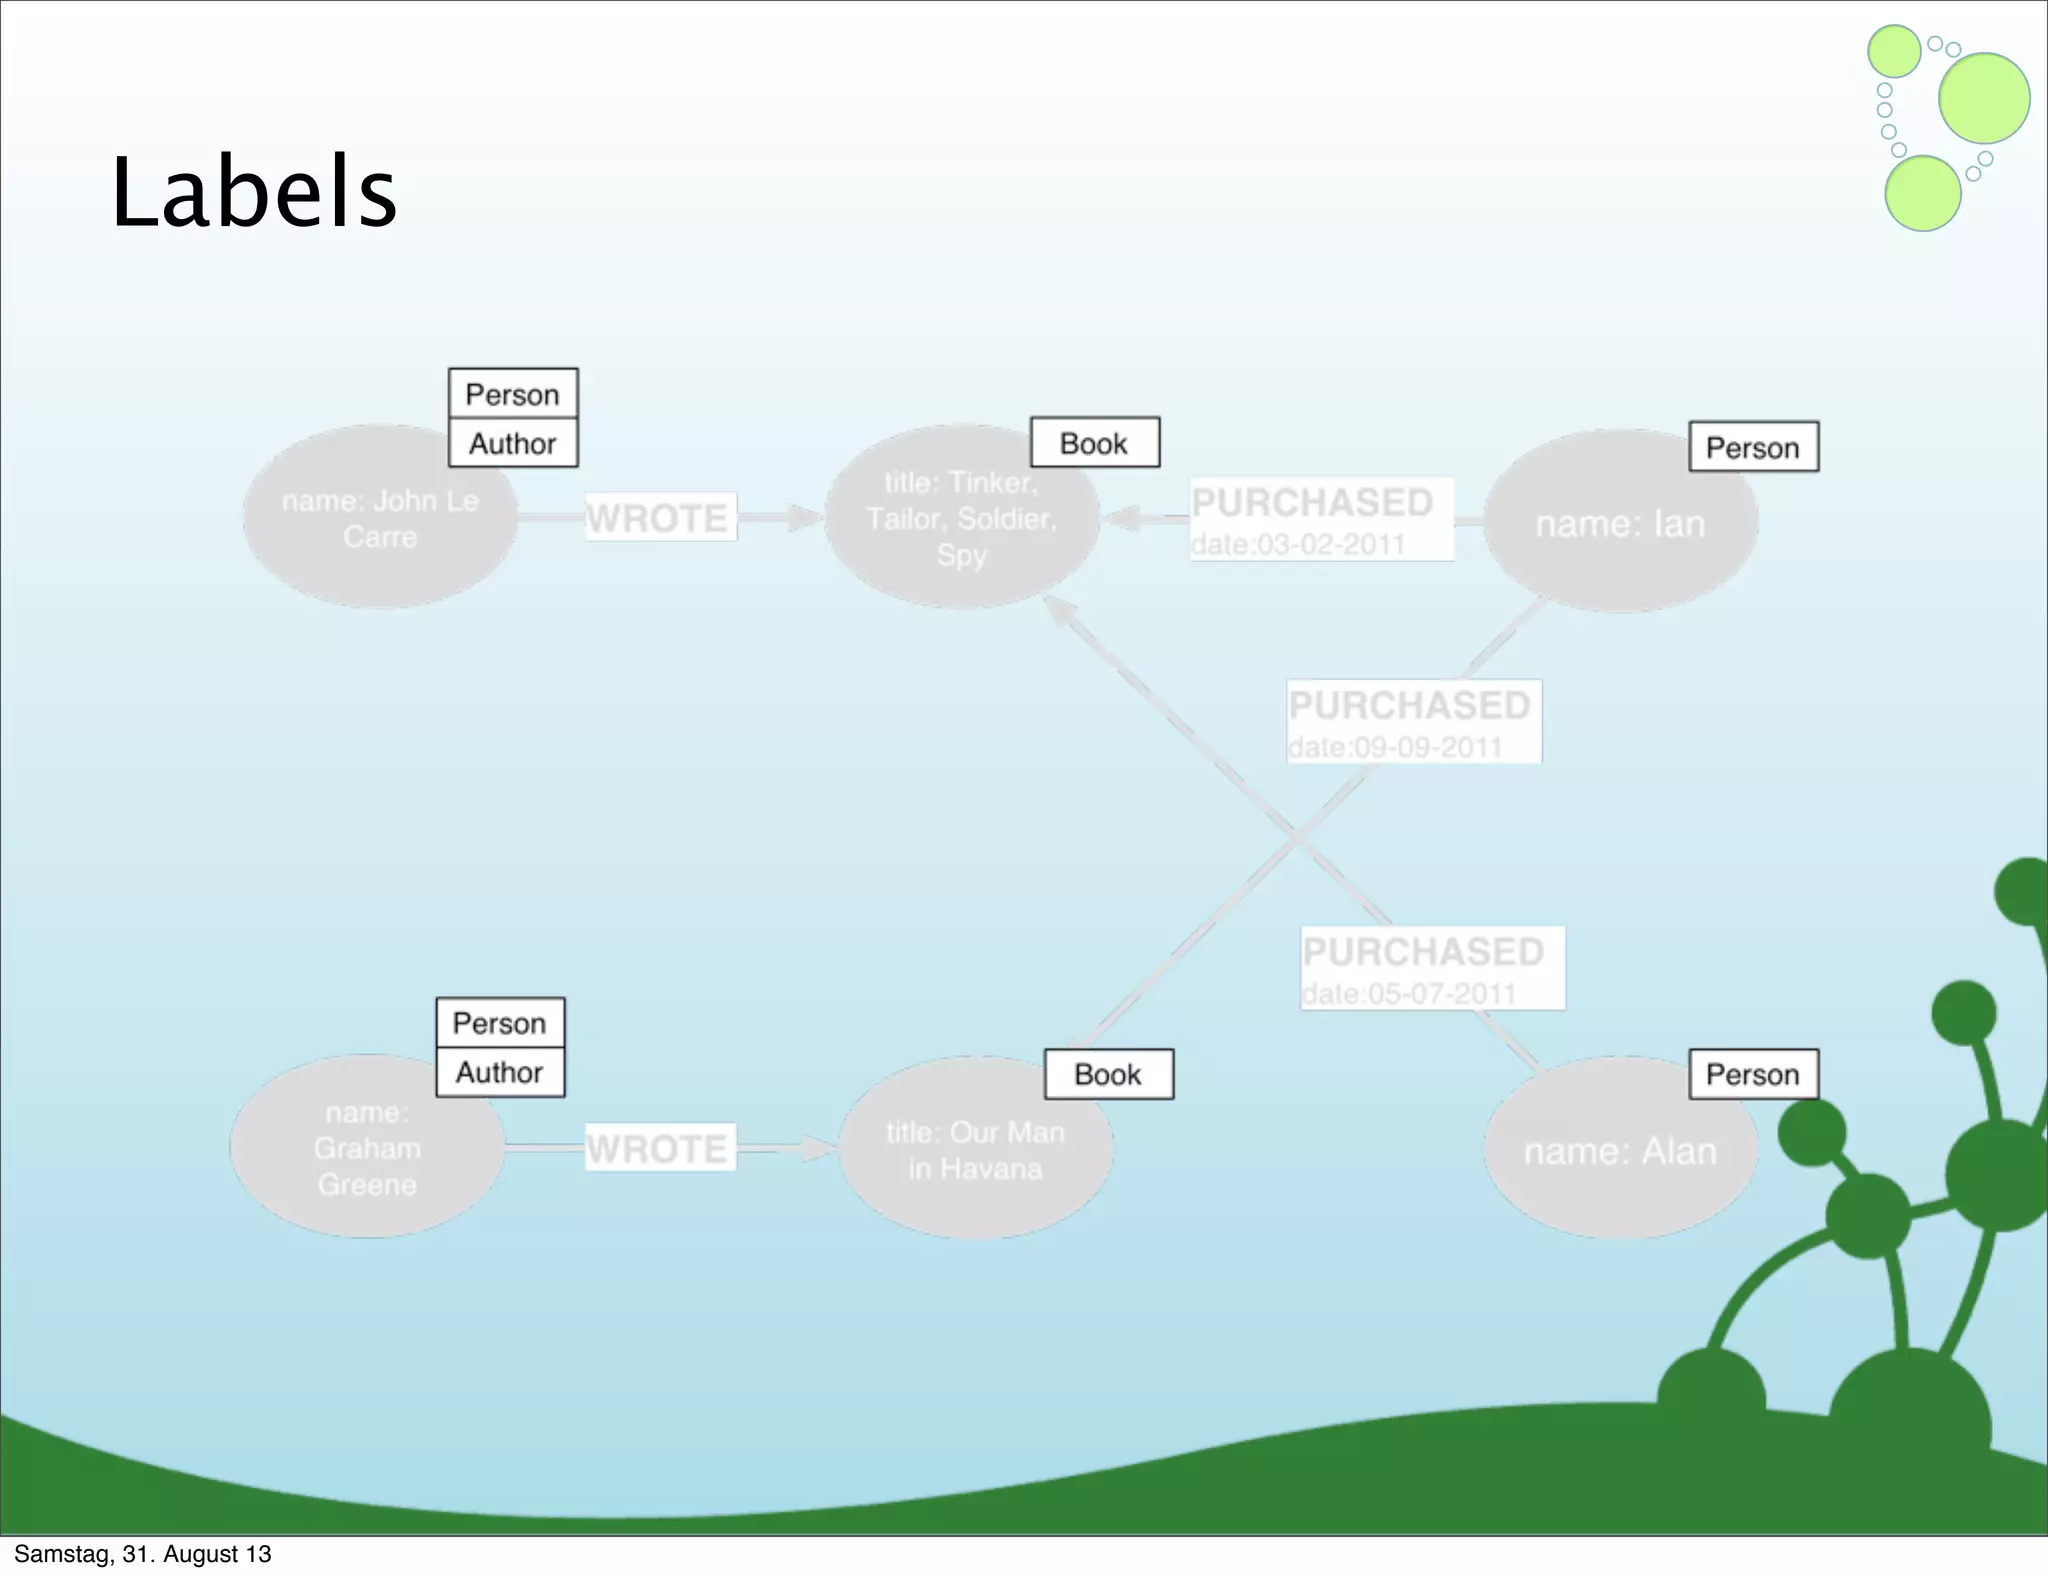
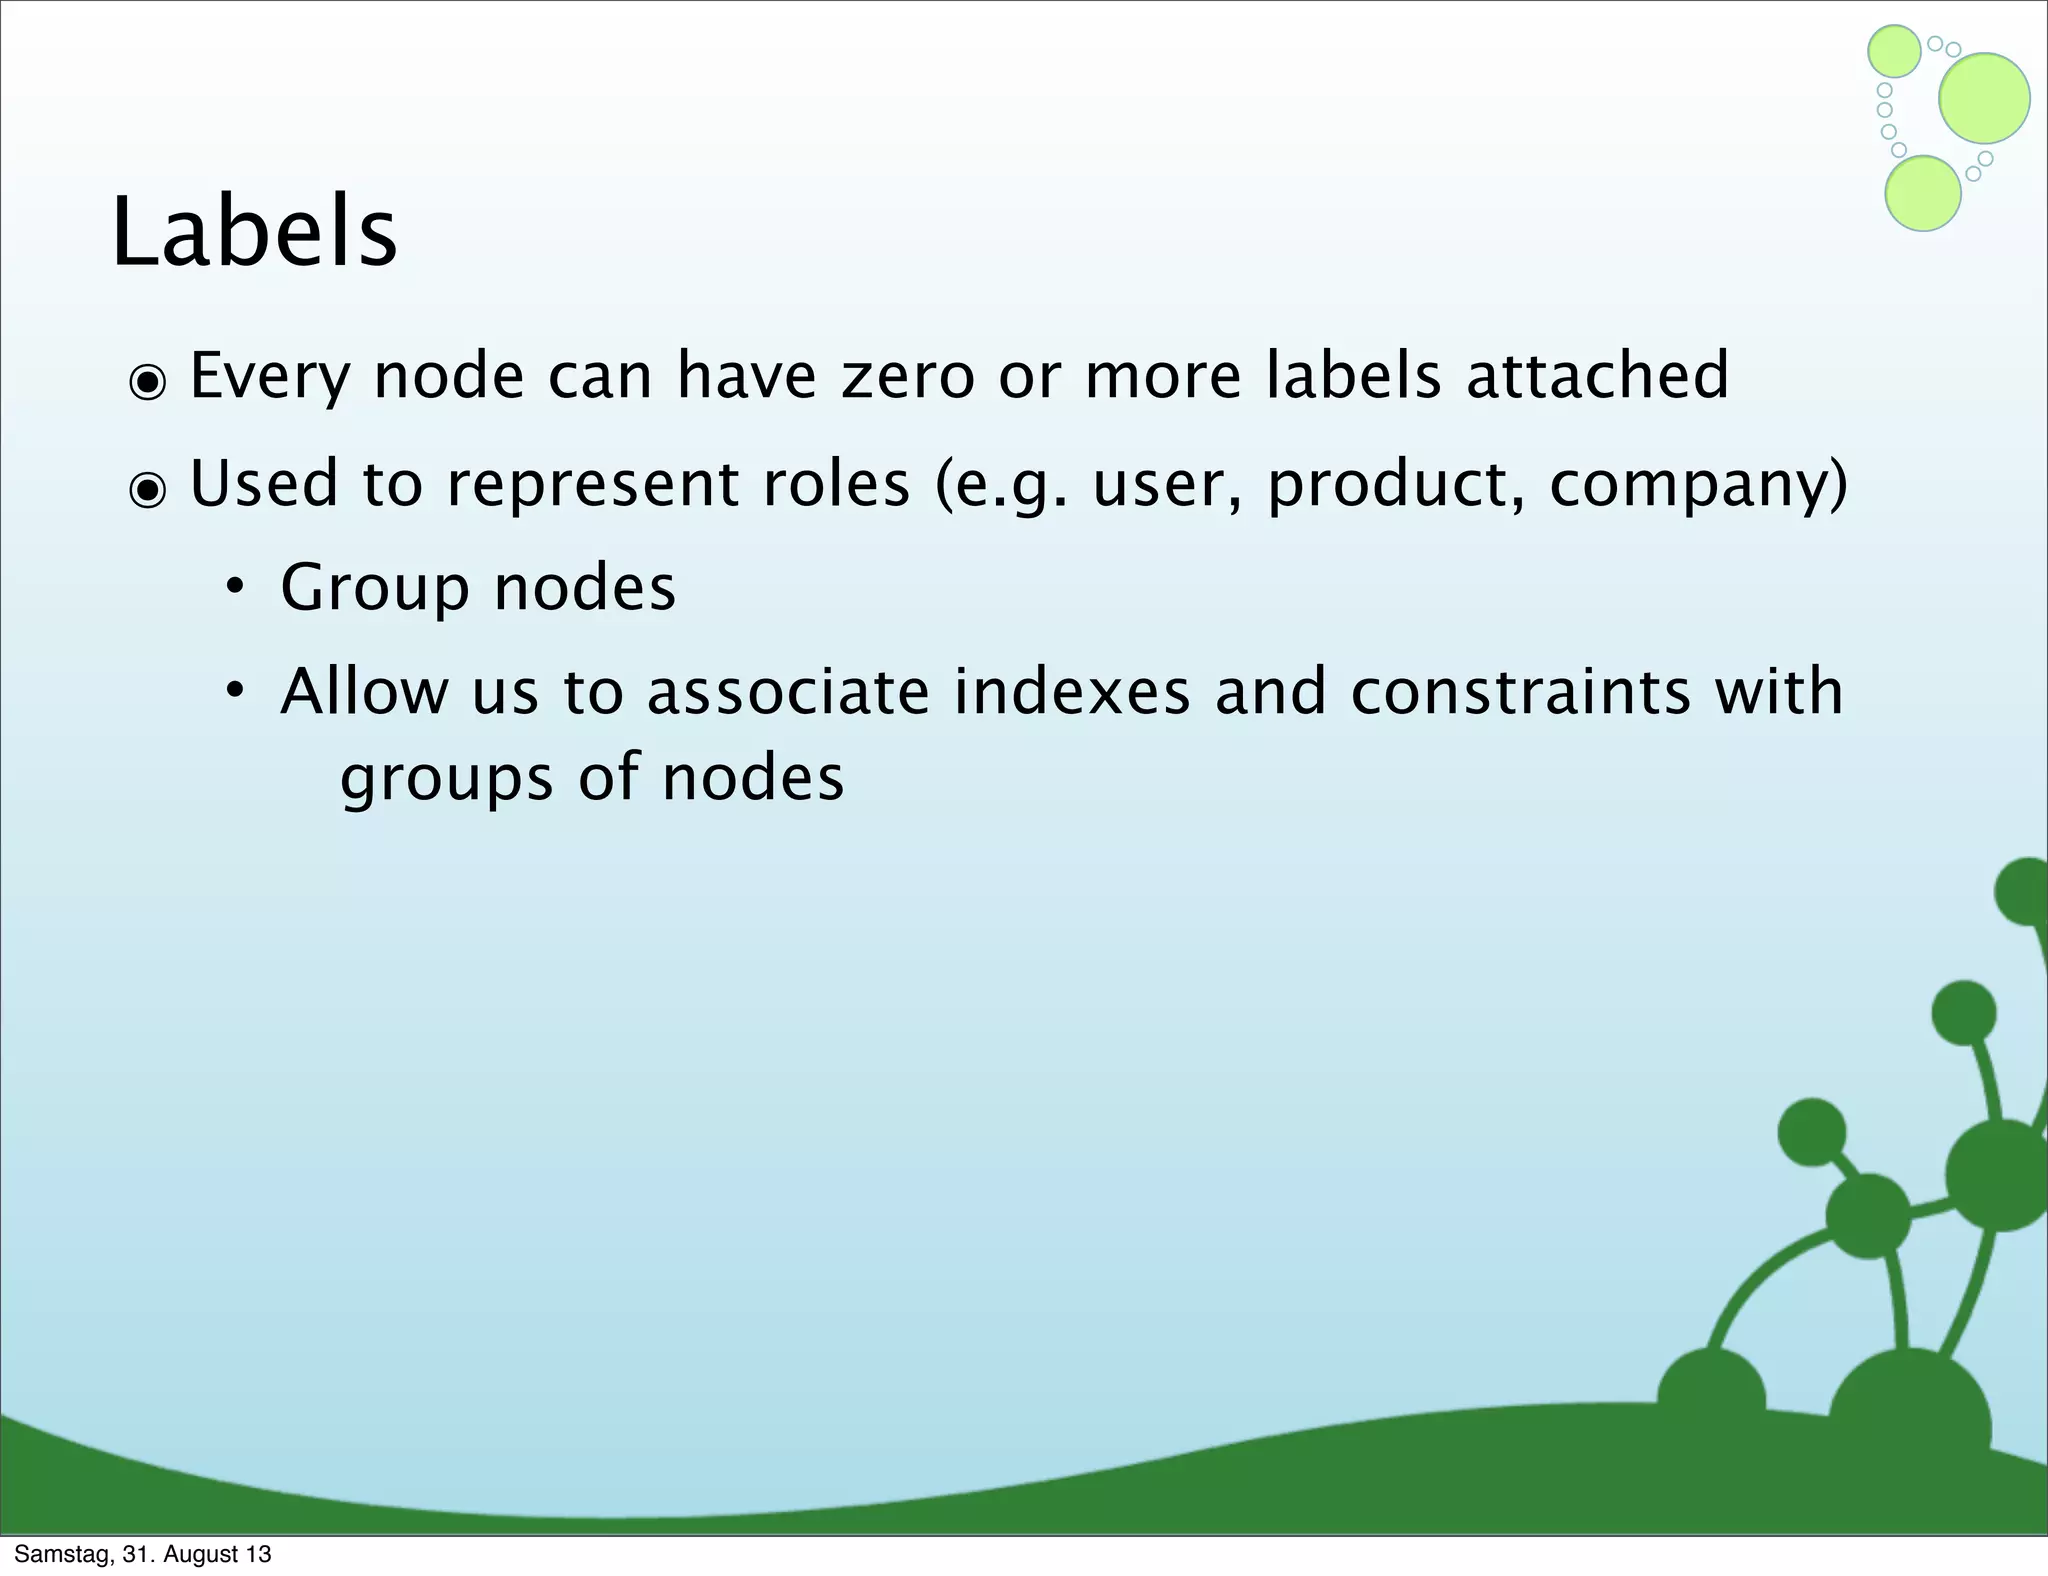
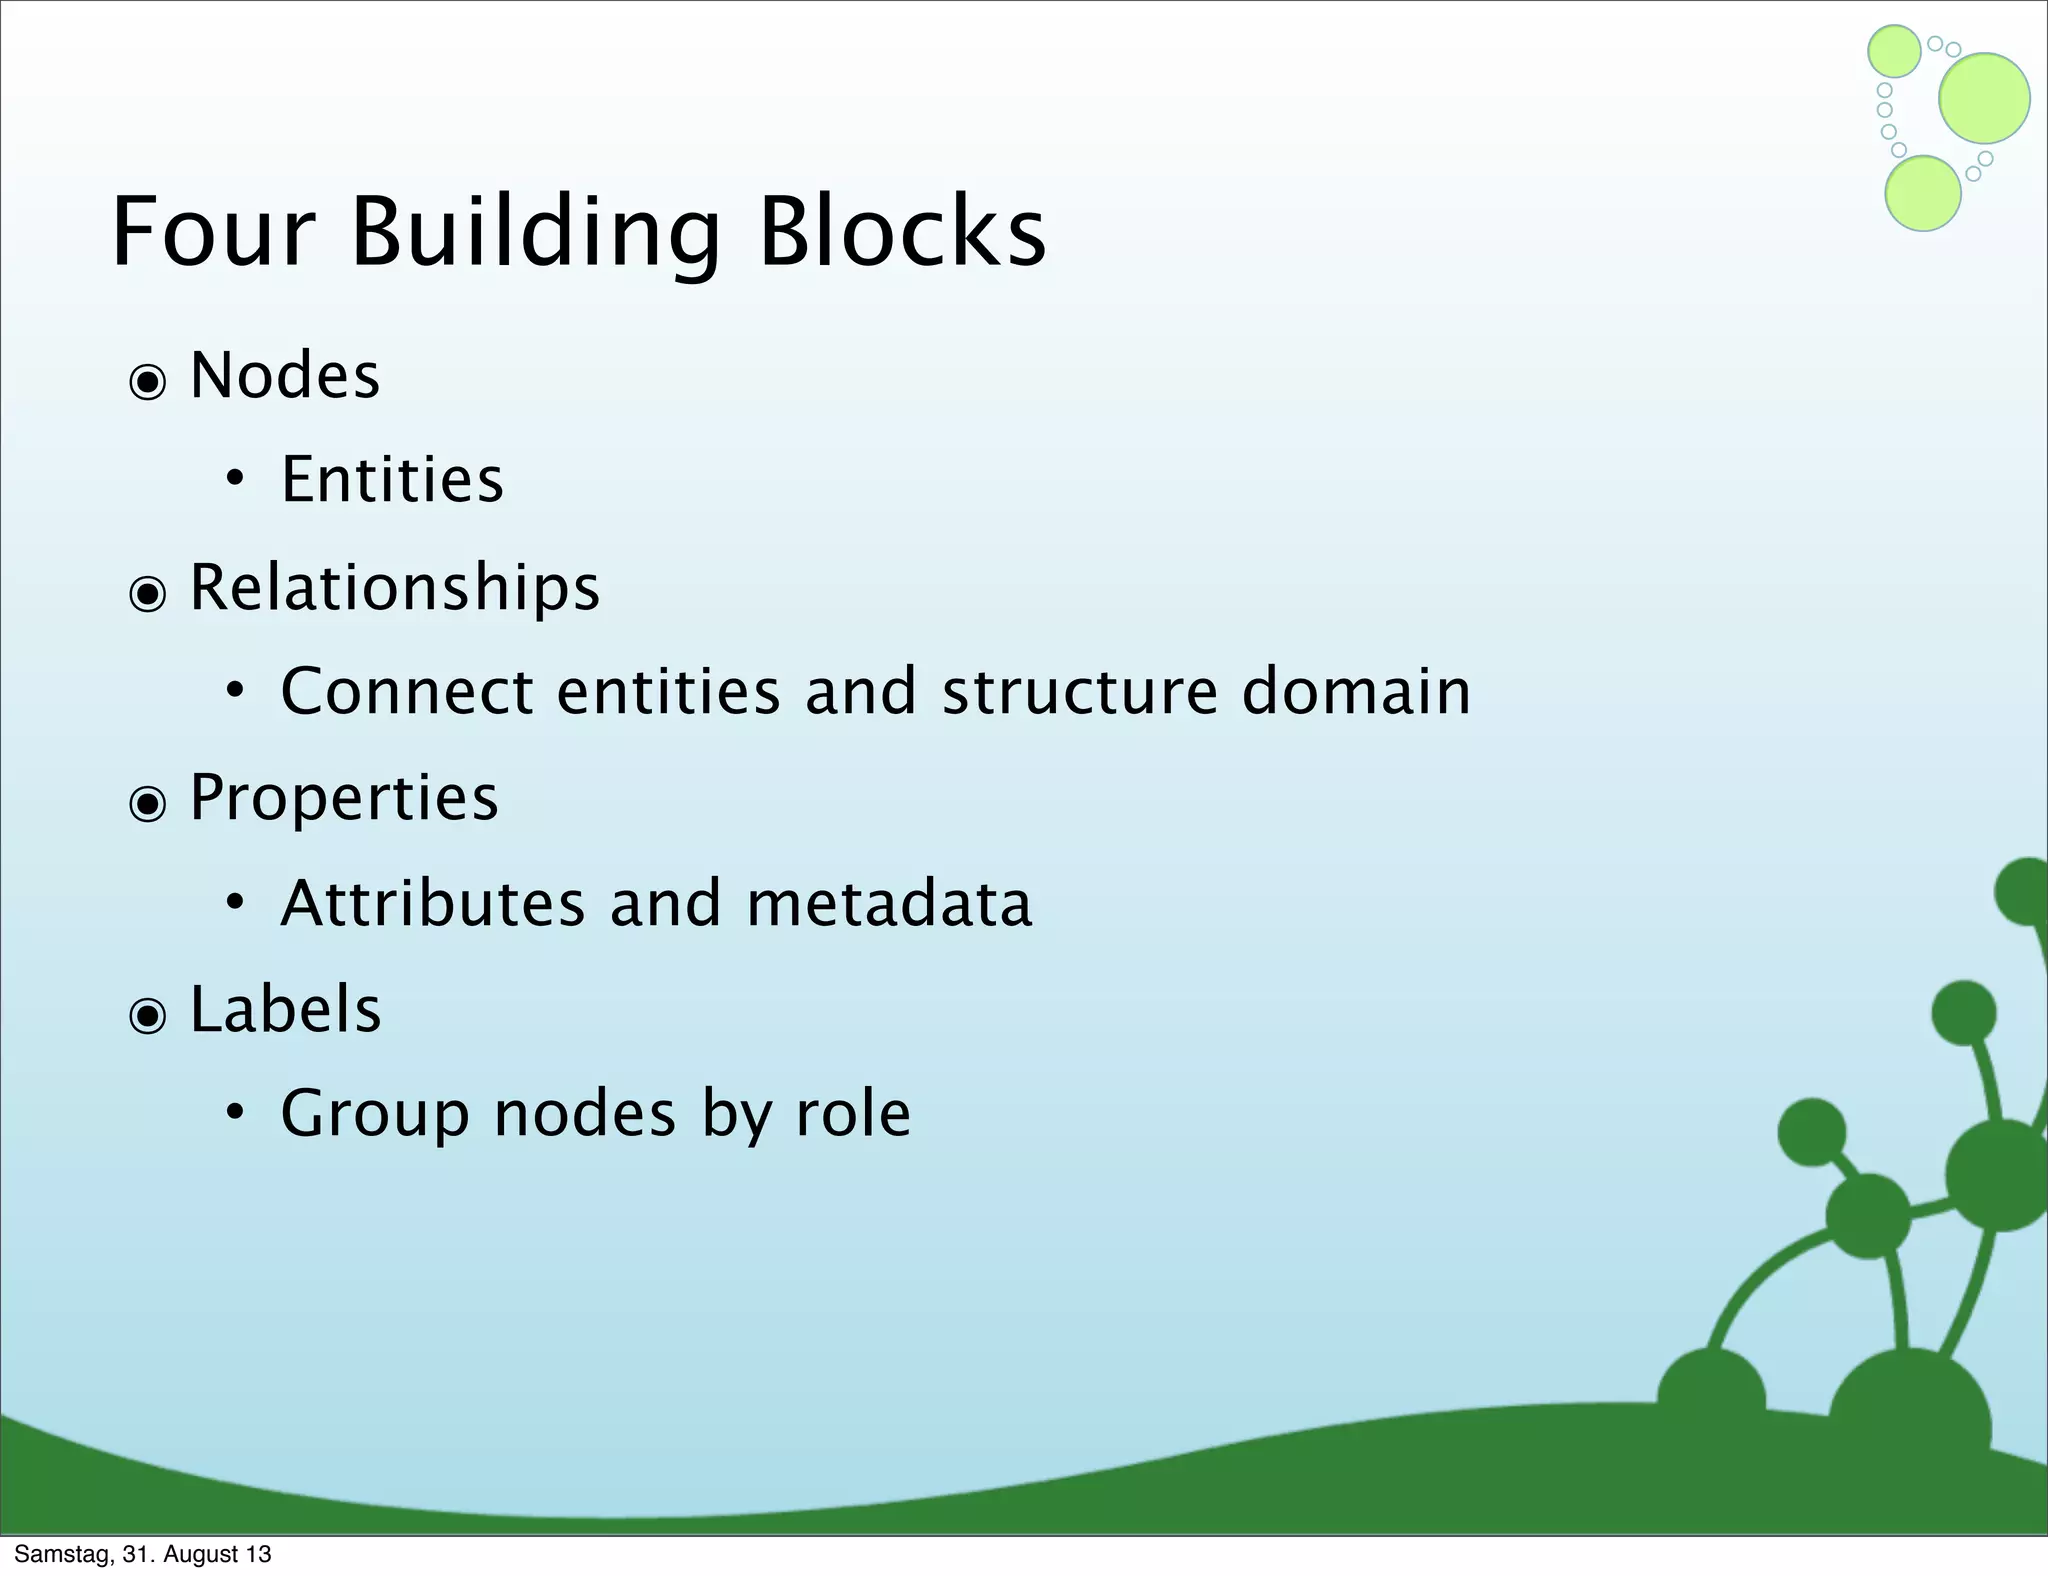
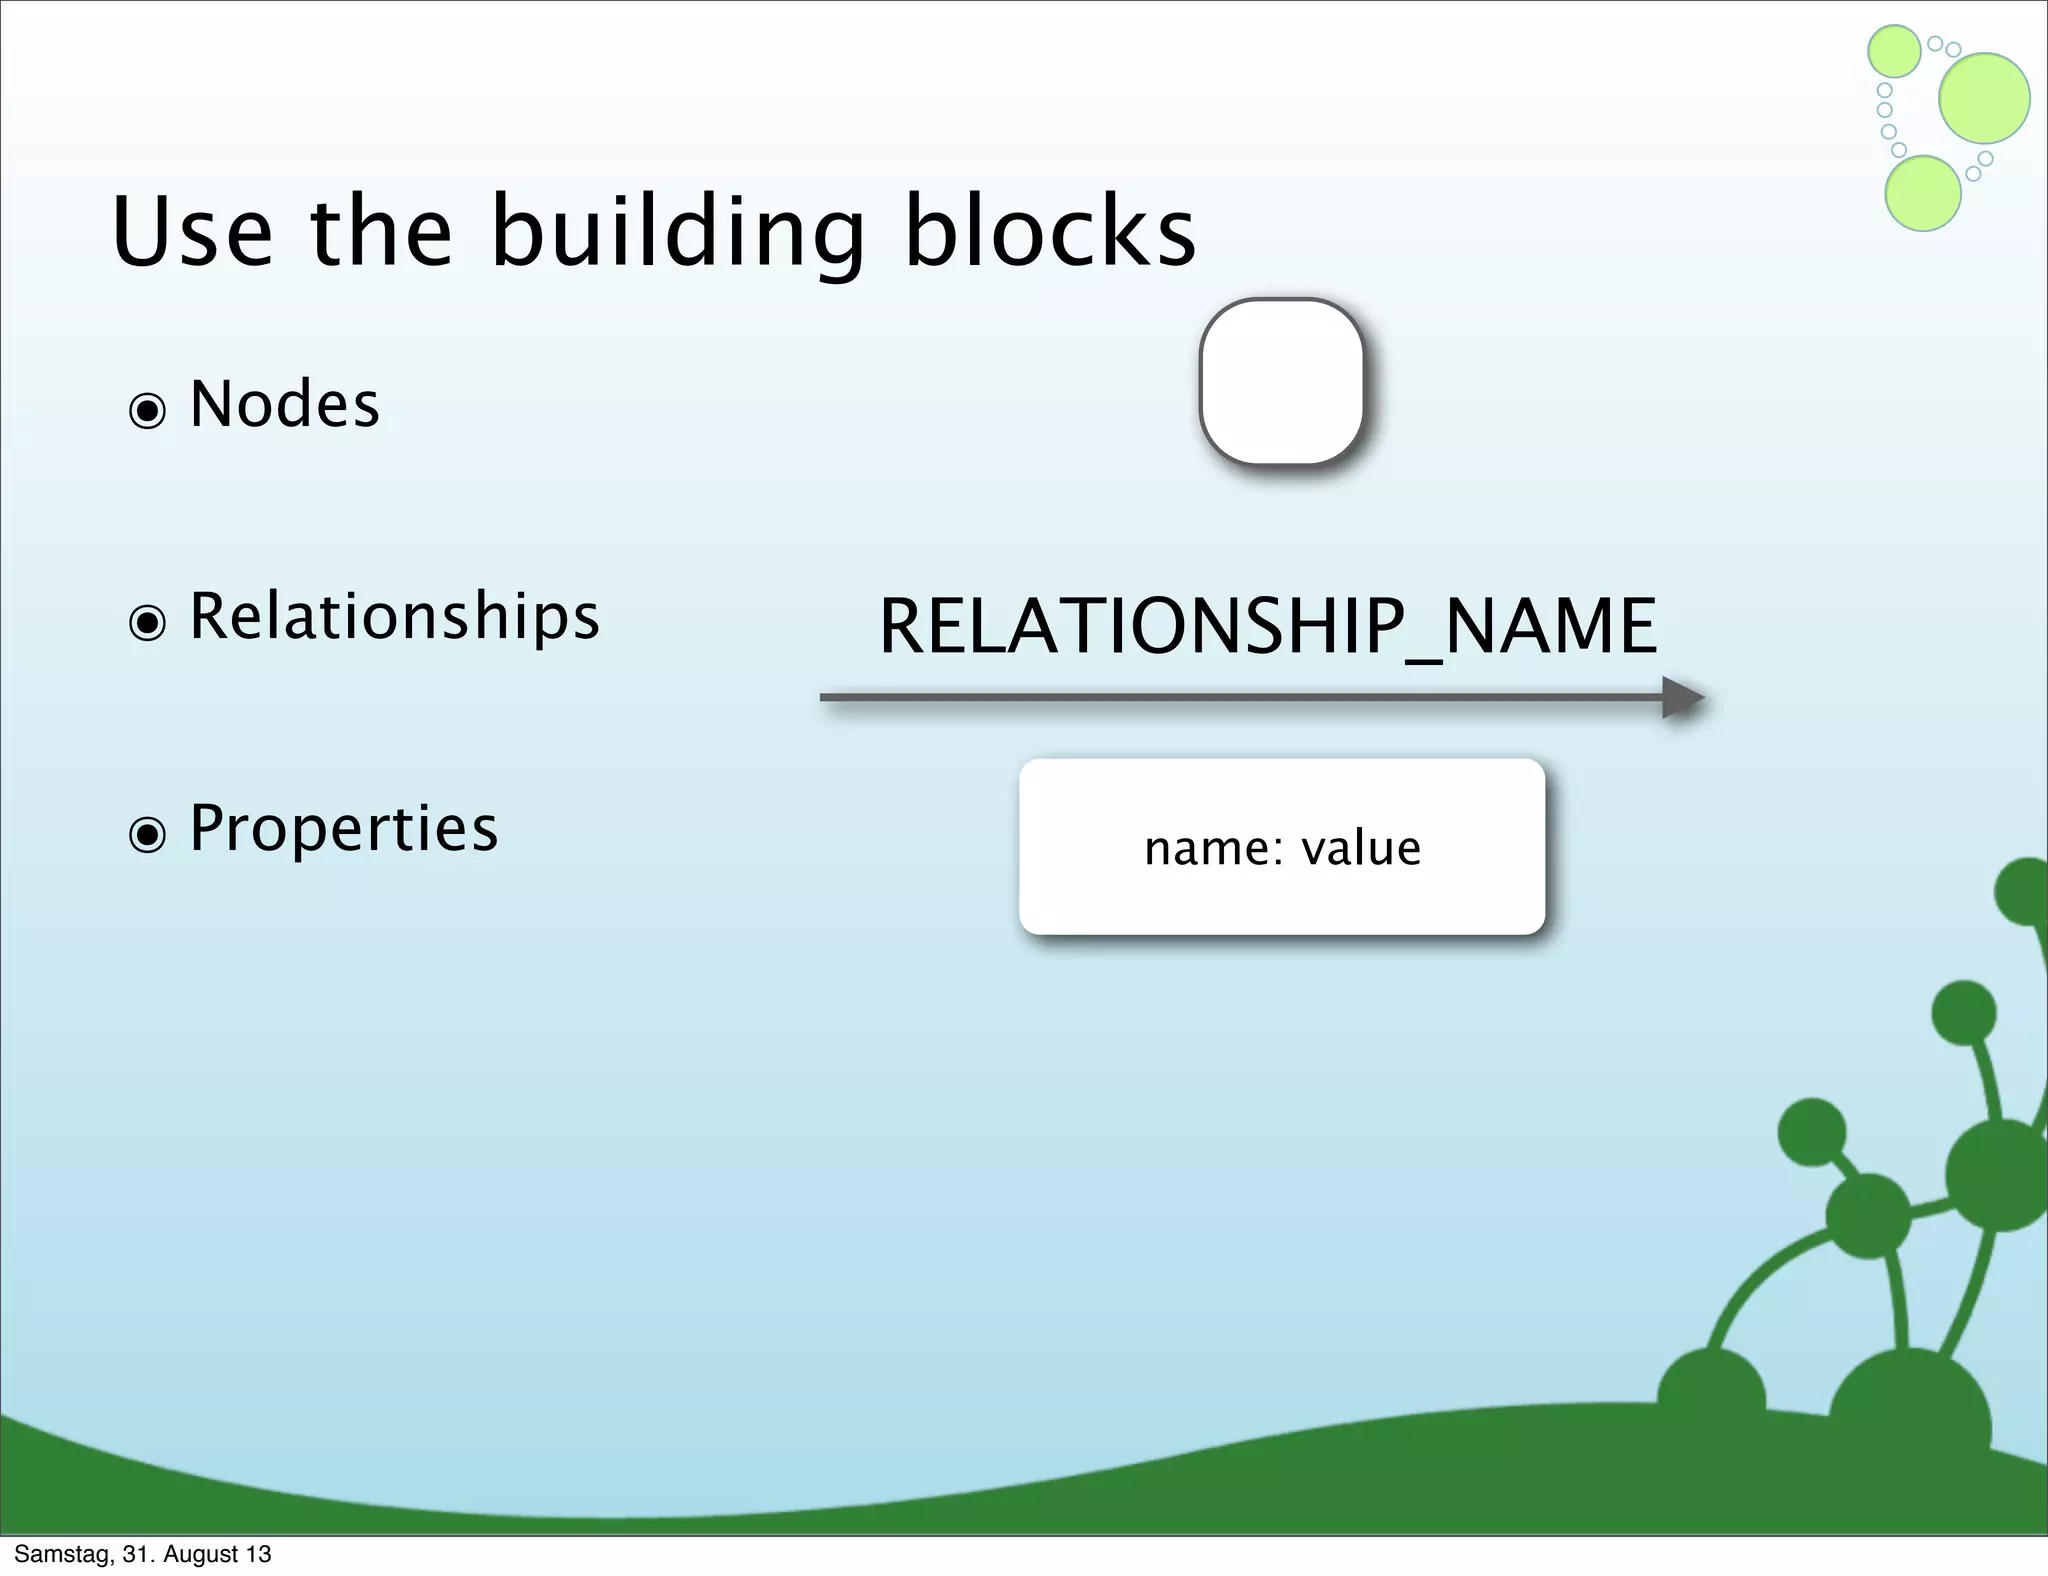
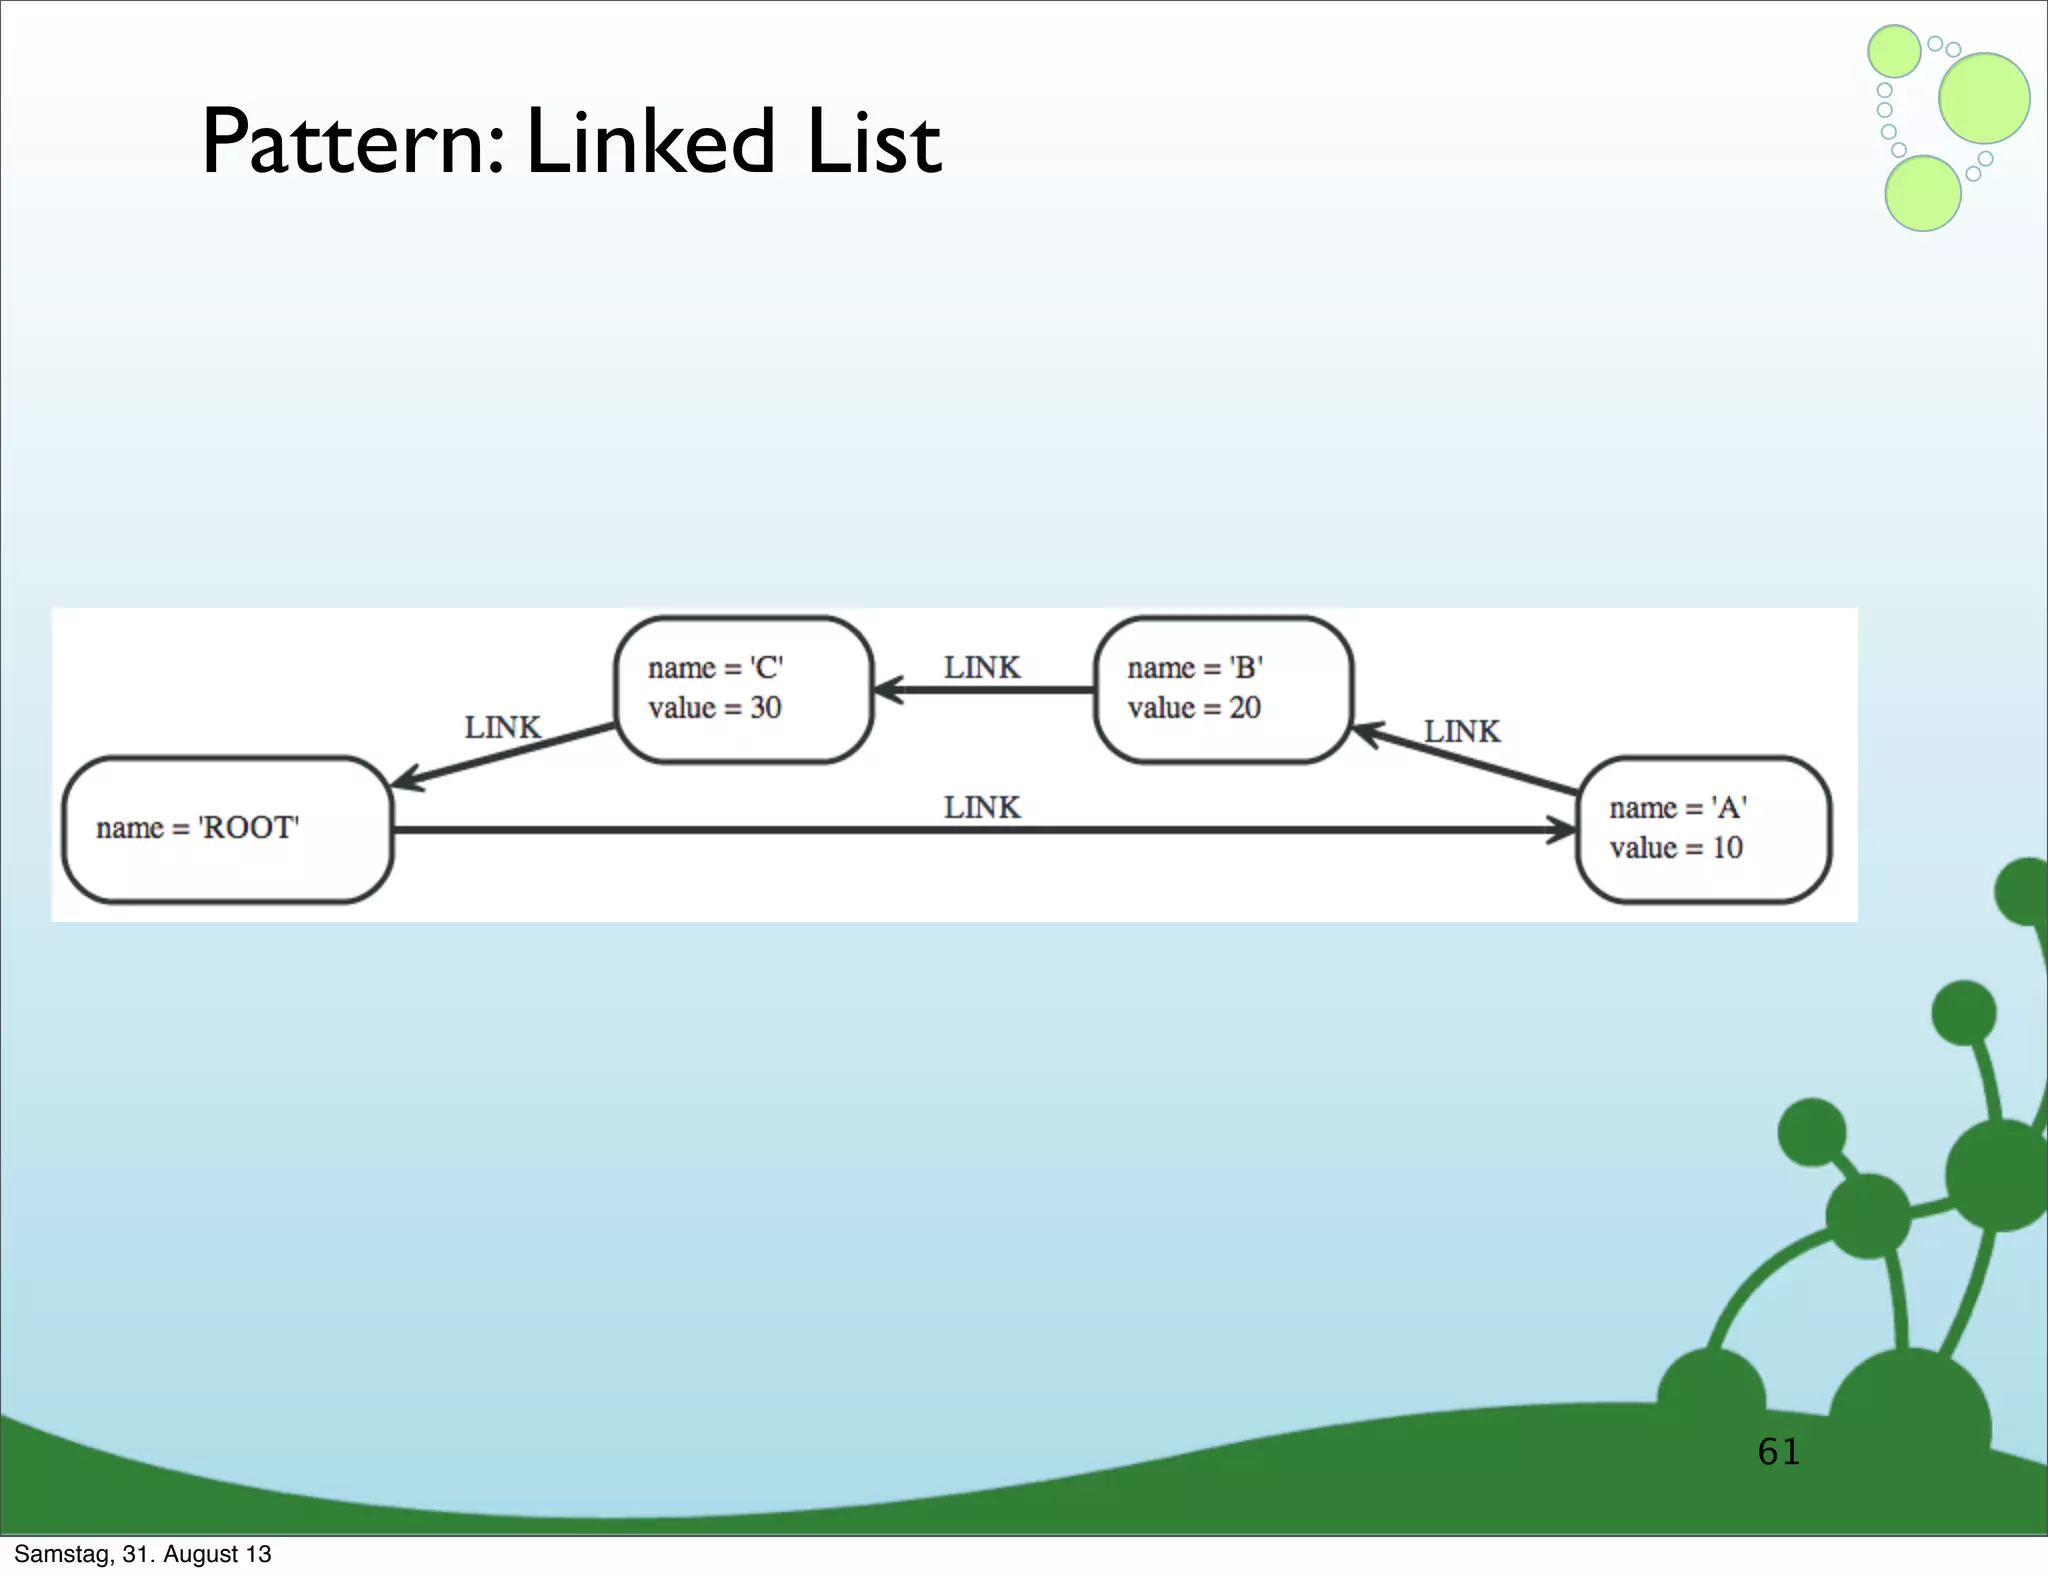
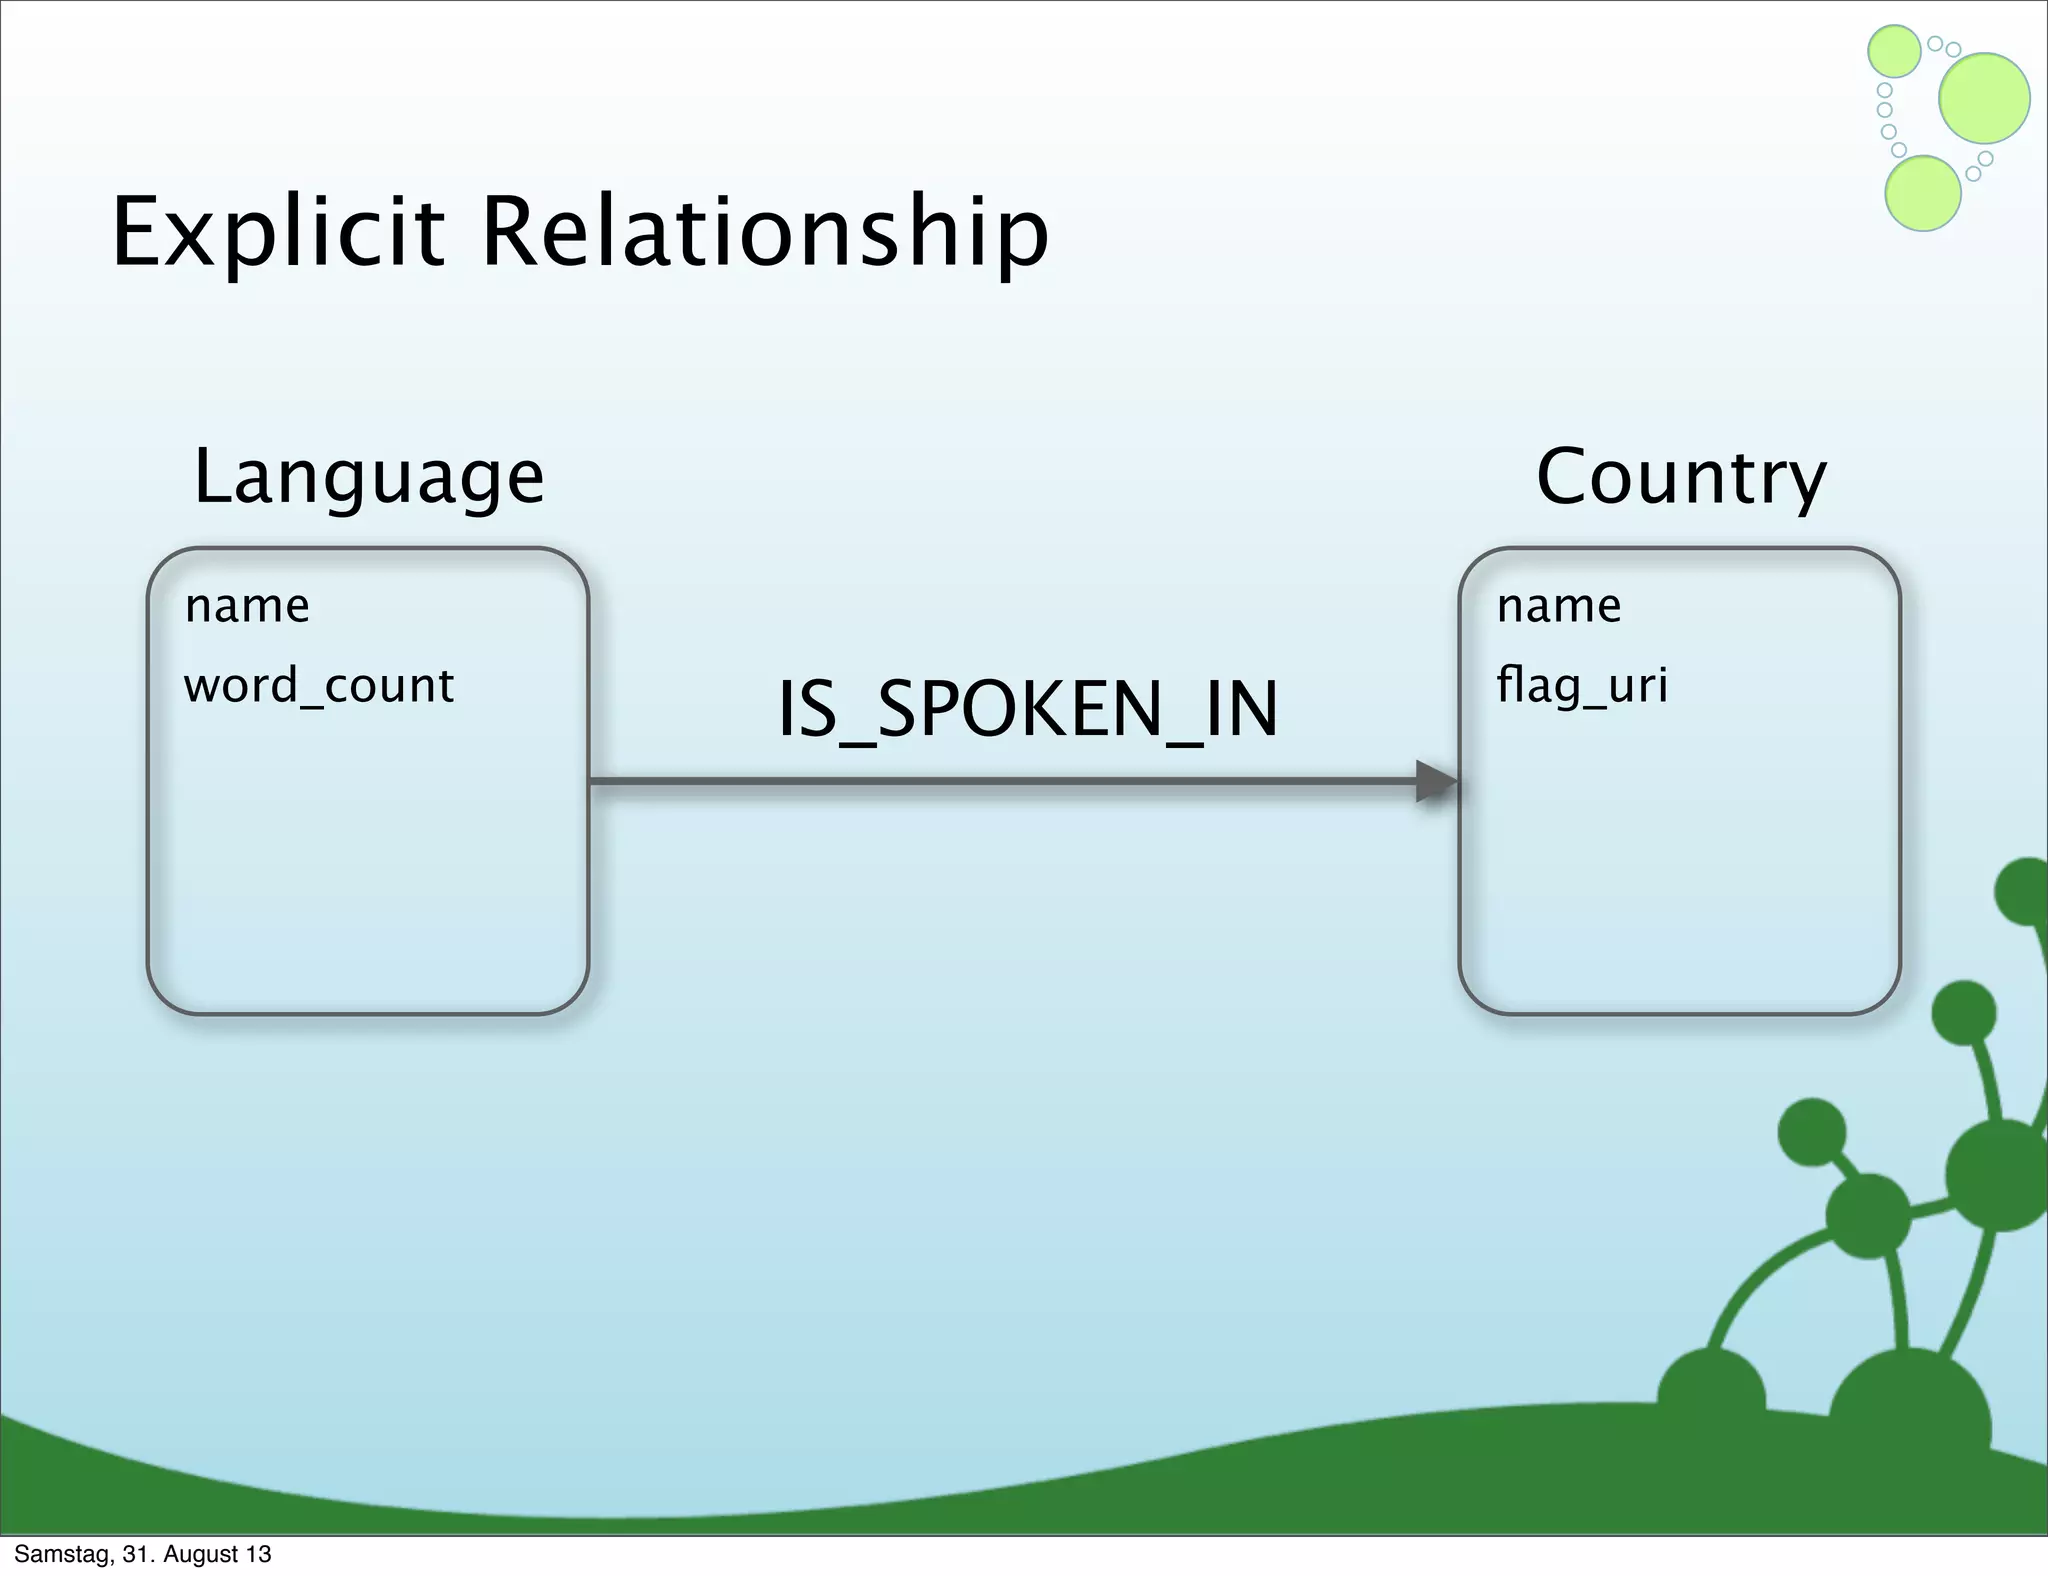
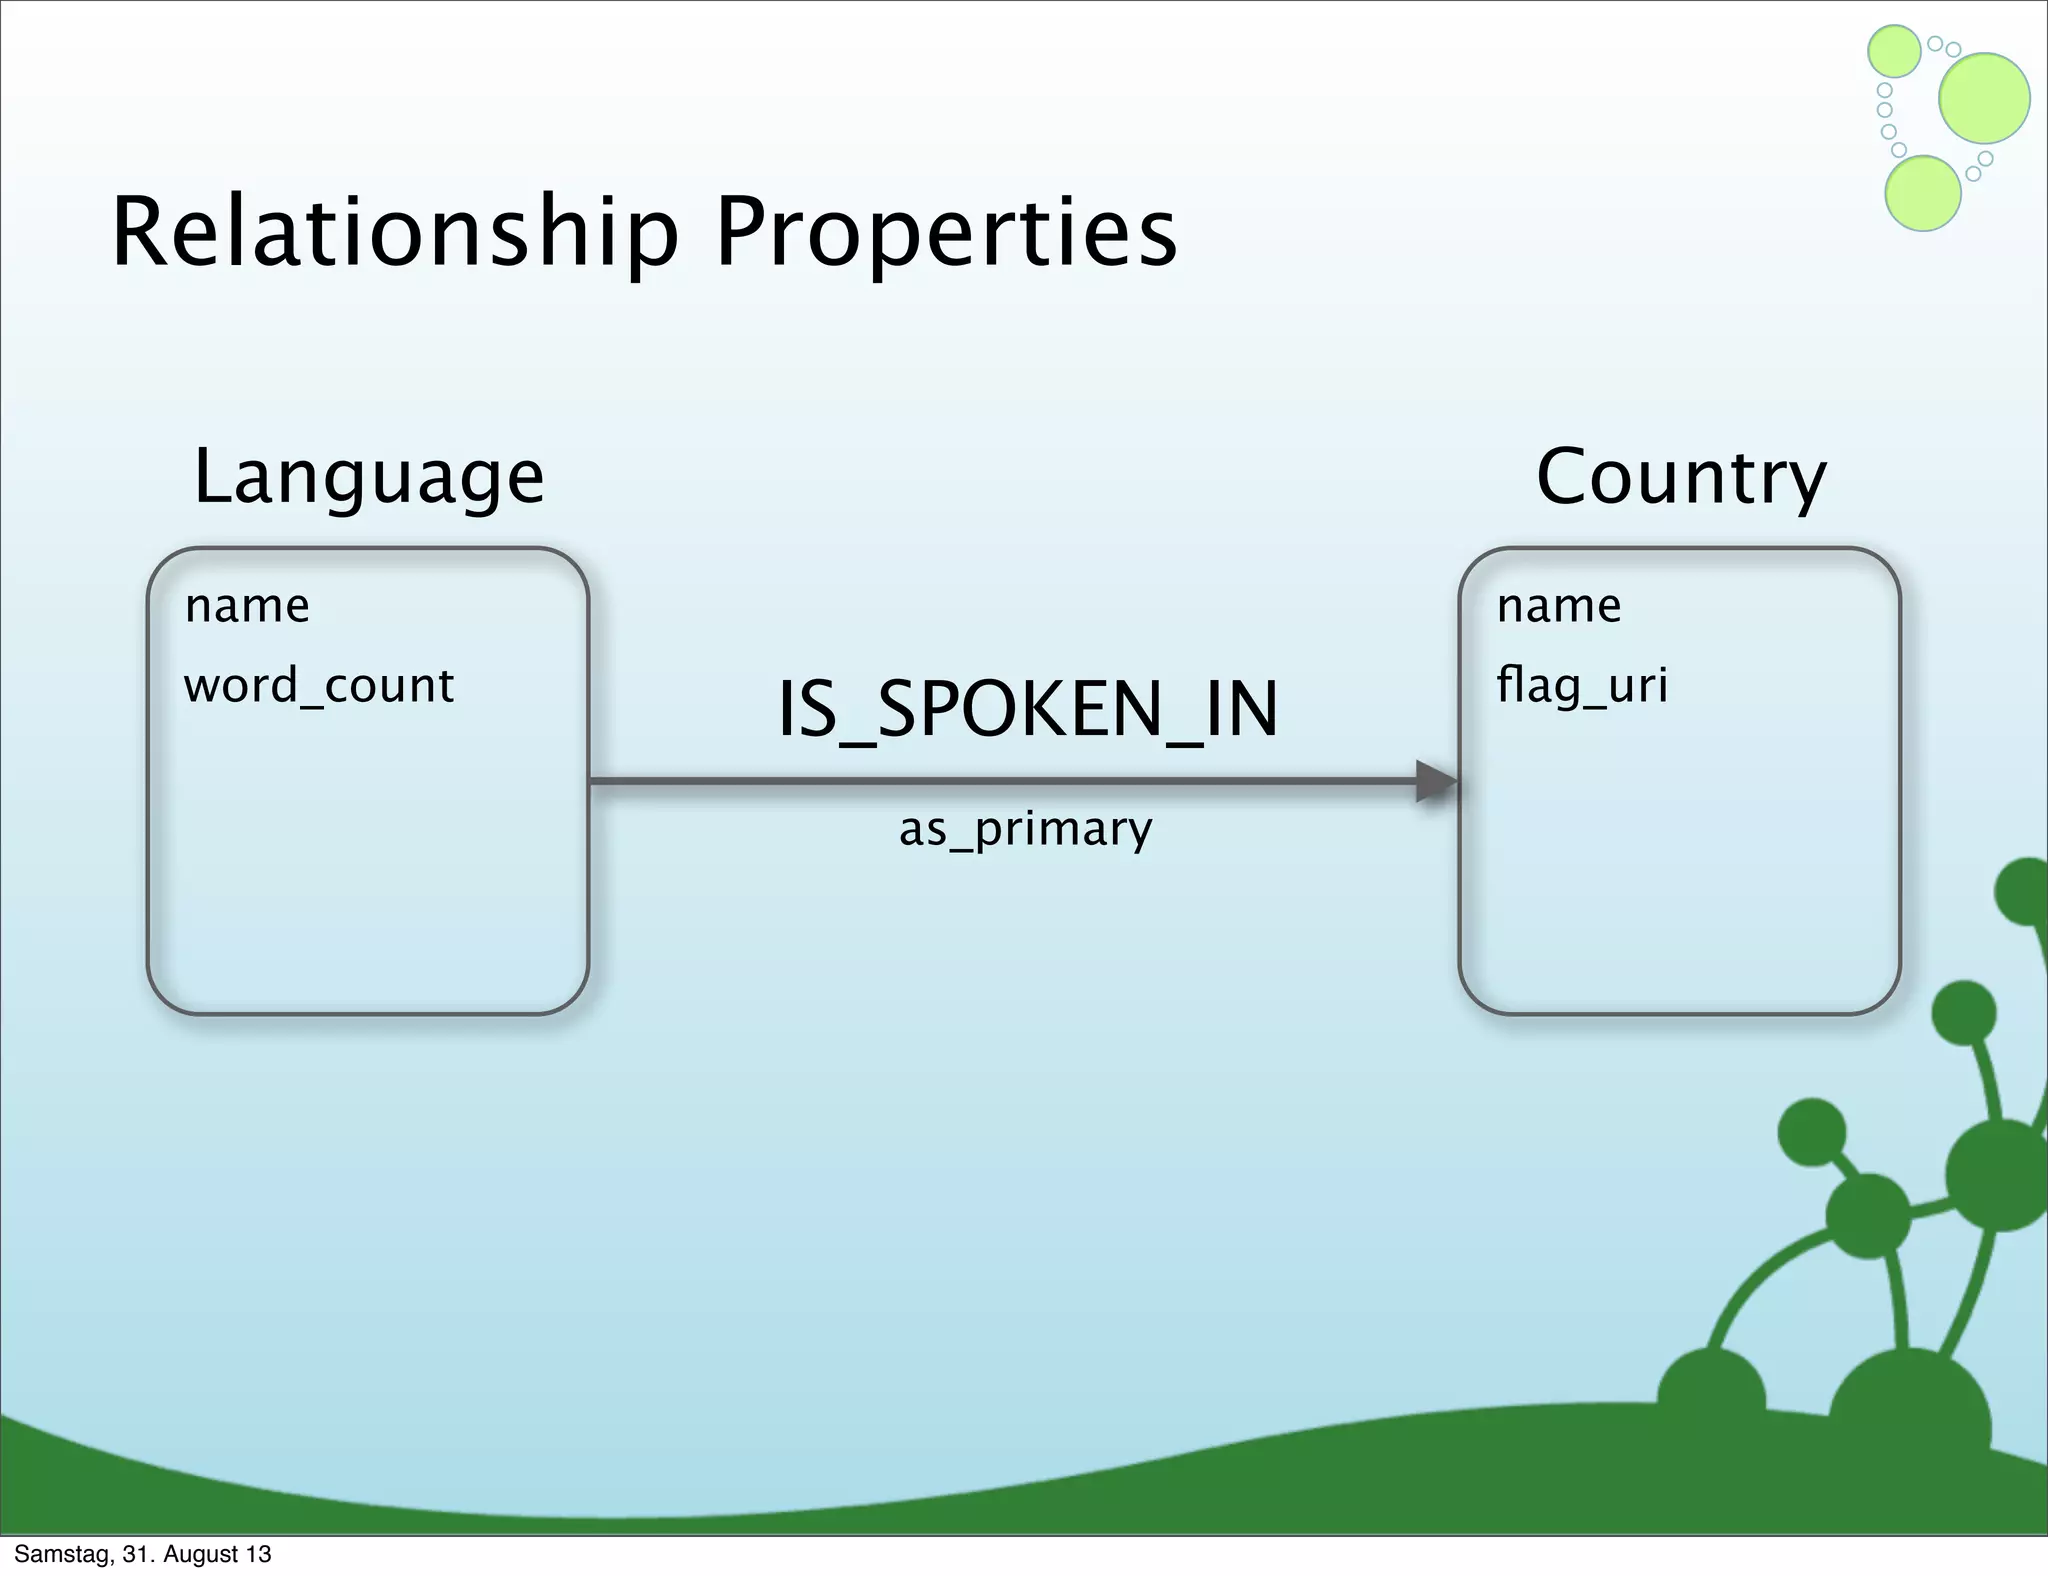
Four primary components: Nodes, Relationships, Properties, and Labels in graph modeling. Explains what nodes and relationships are, how they function, and their importance in graph databases. Details on the variable structure of relationships and distinctions between aggregate and connected data models.
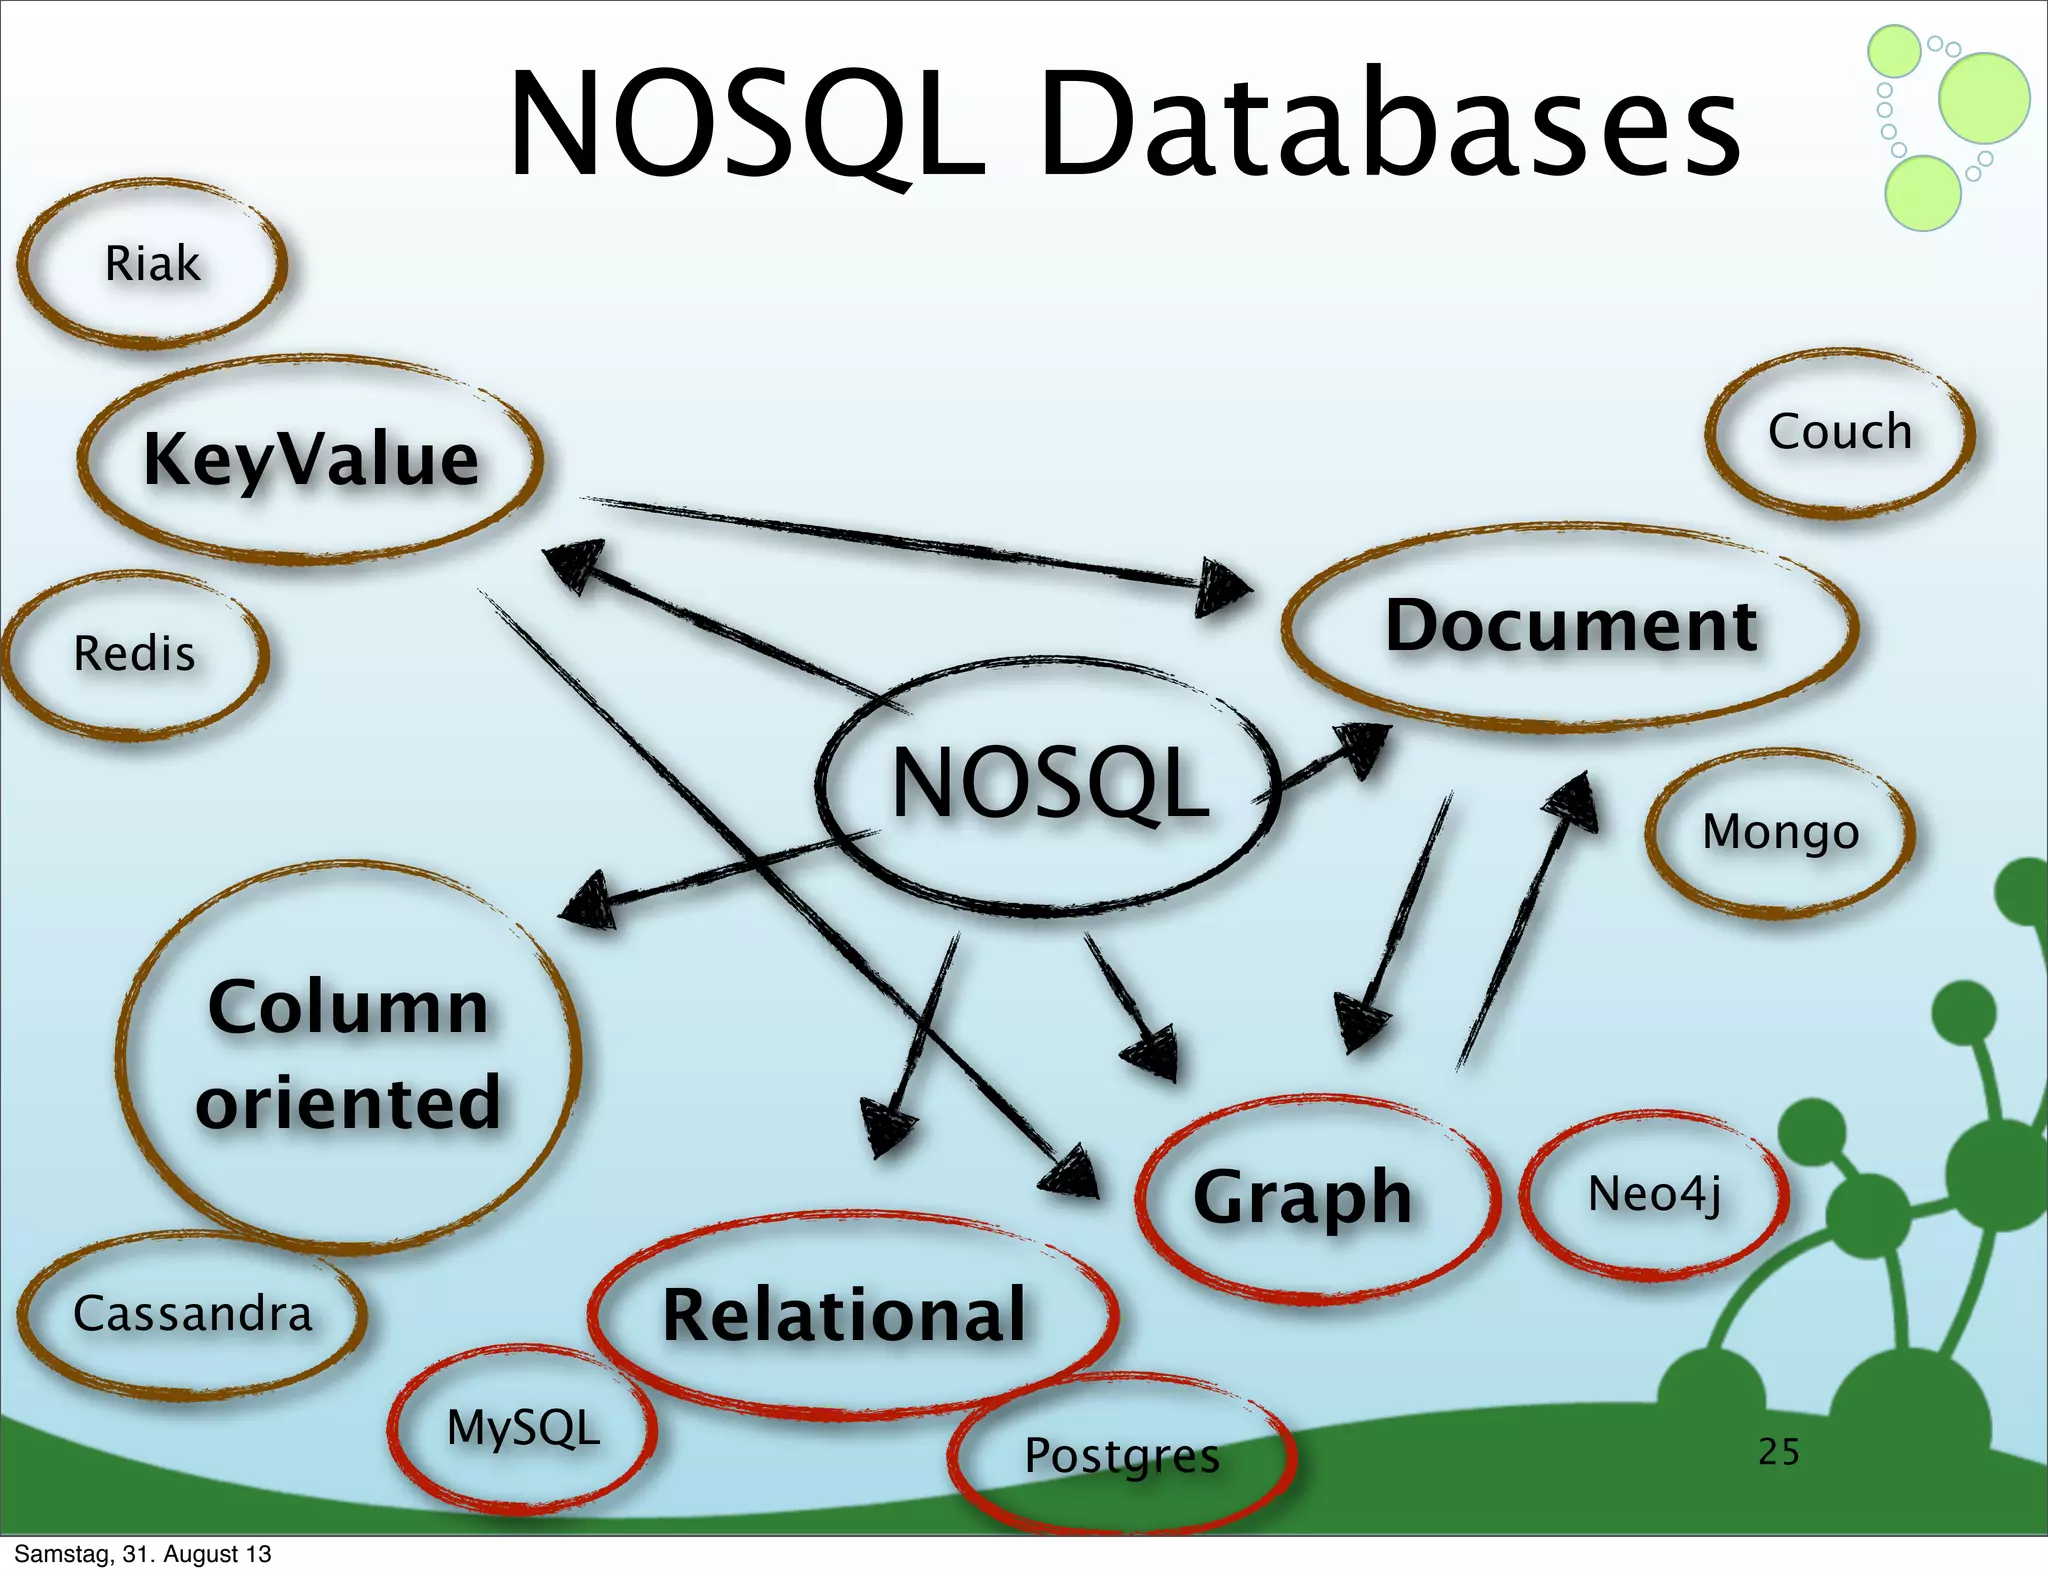
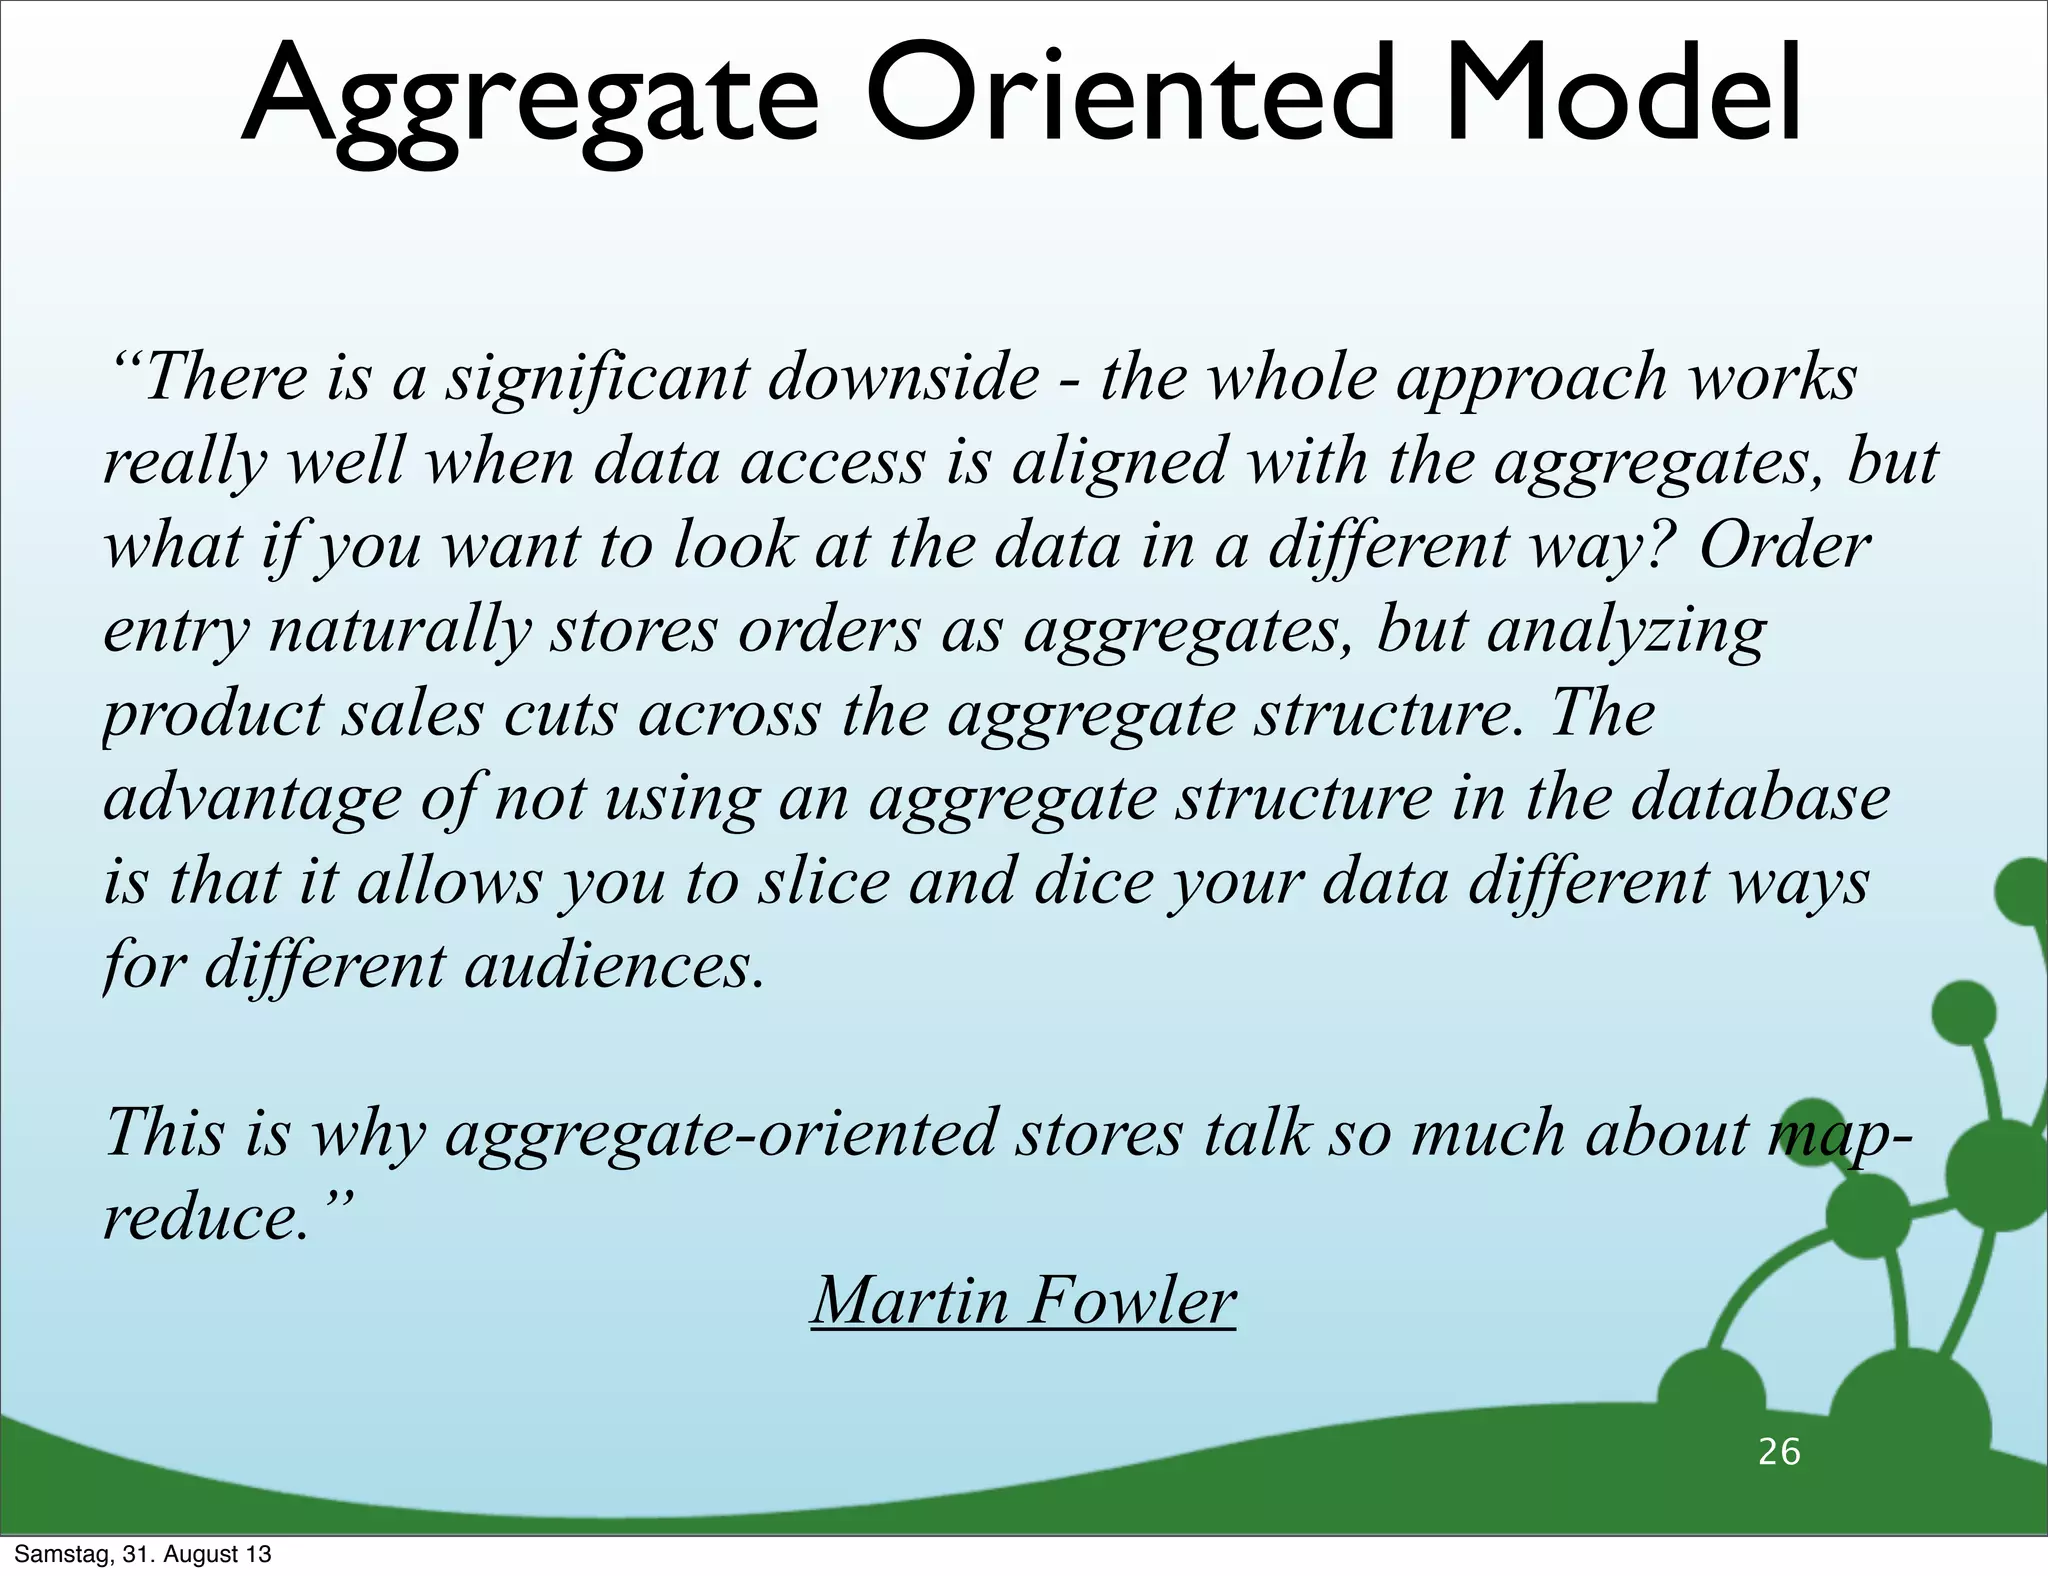
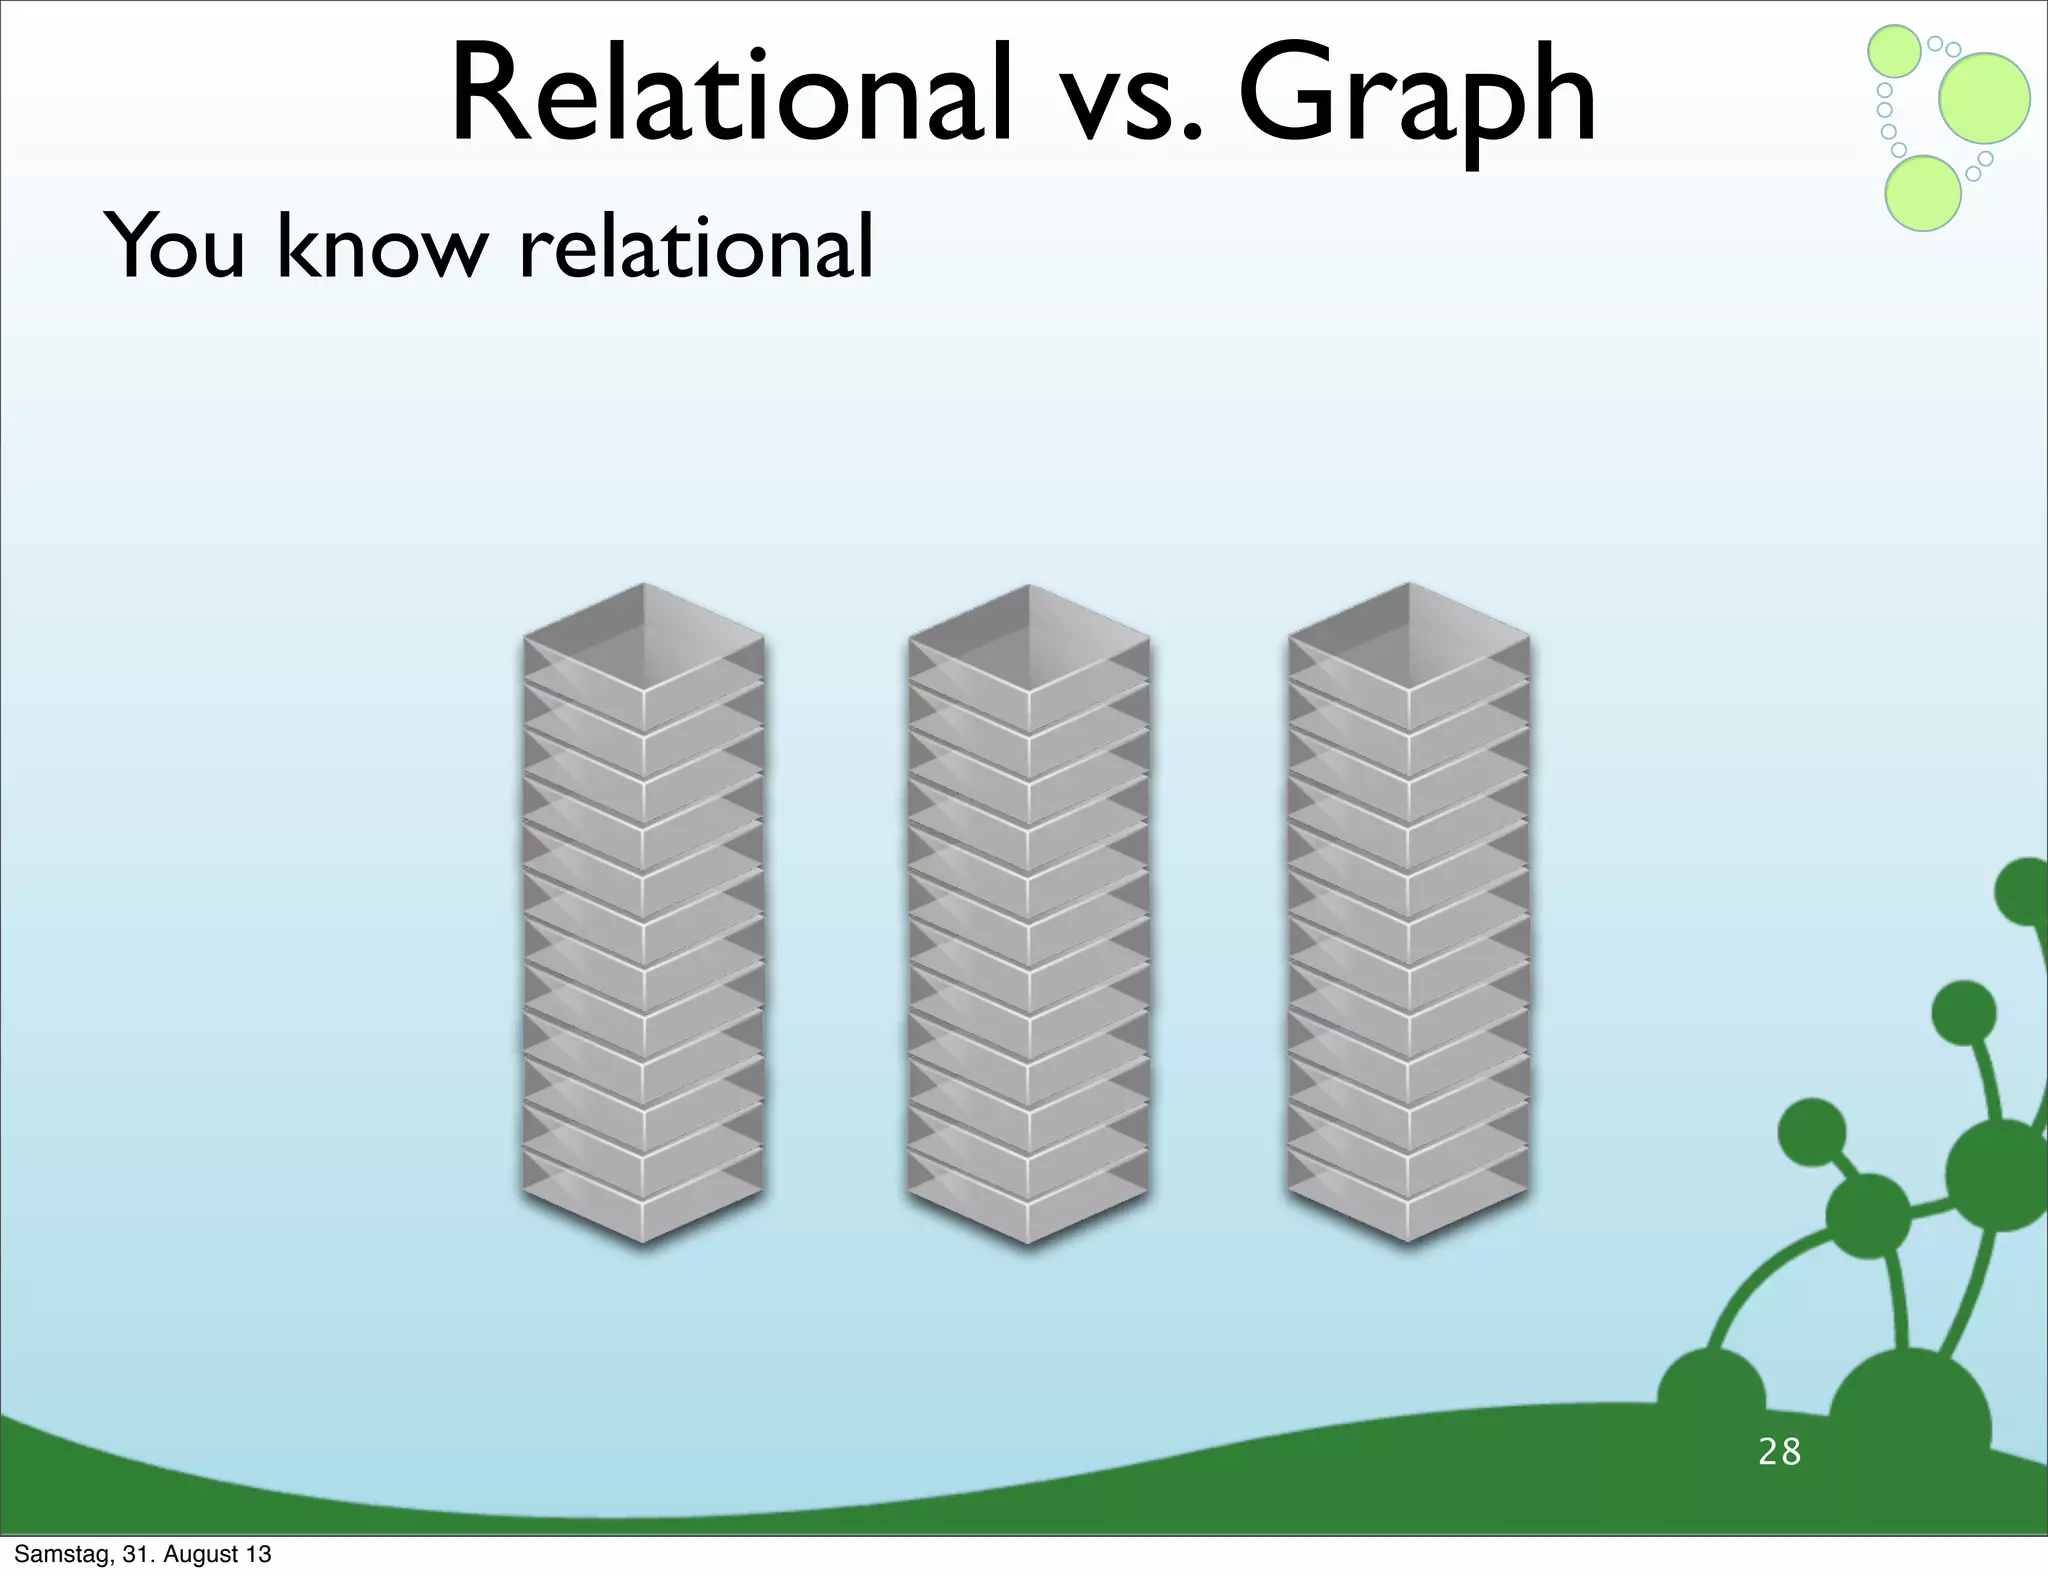
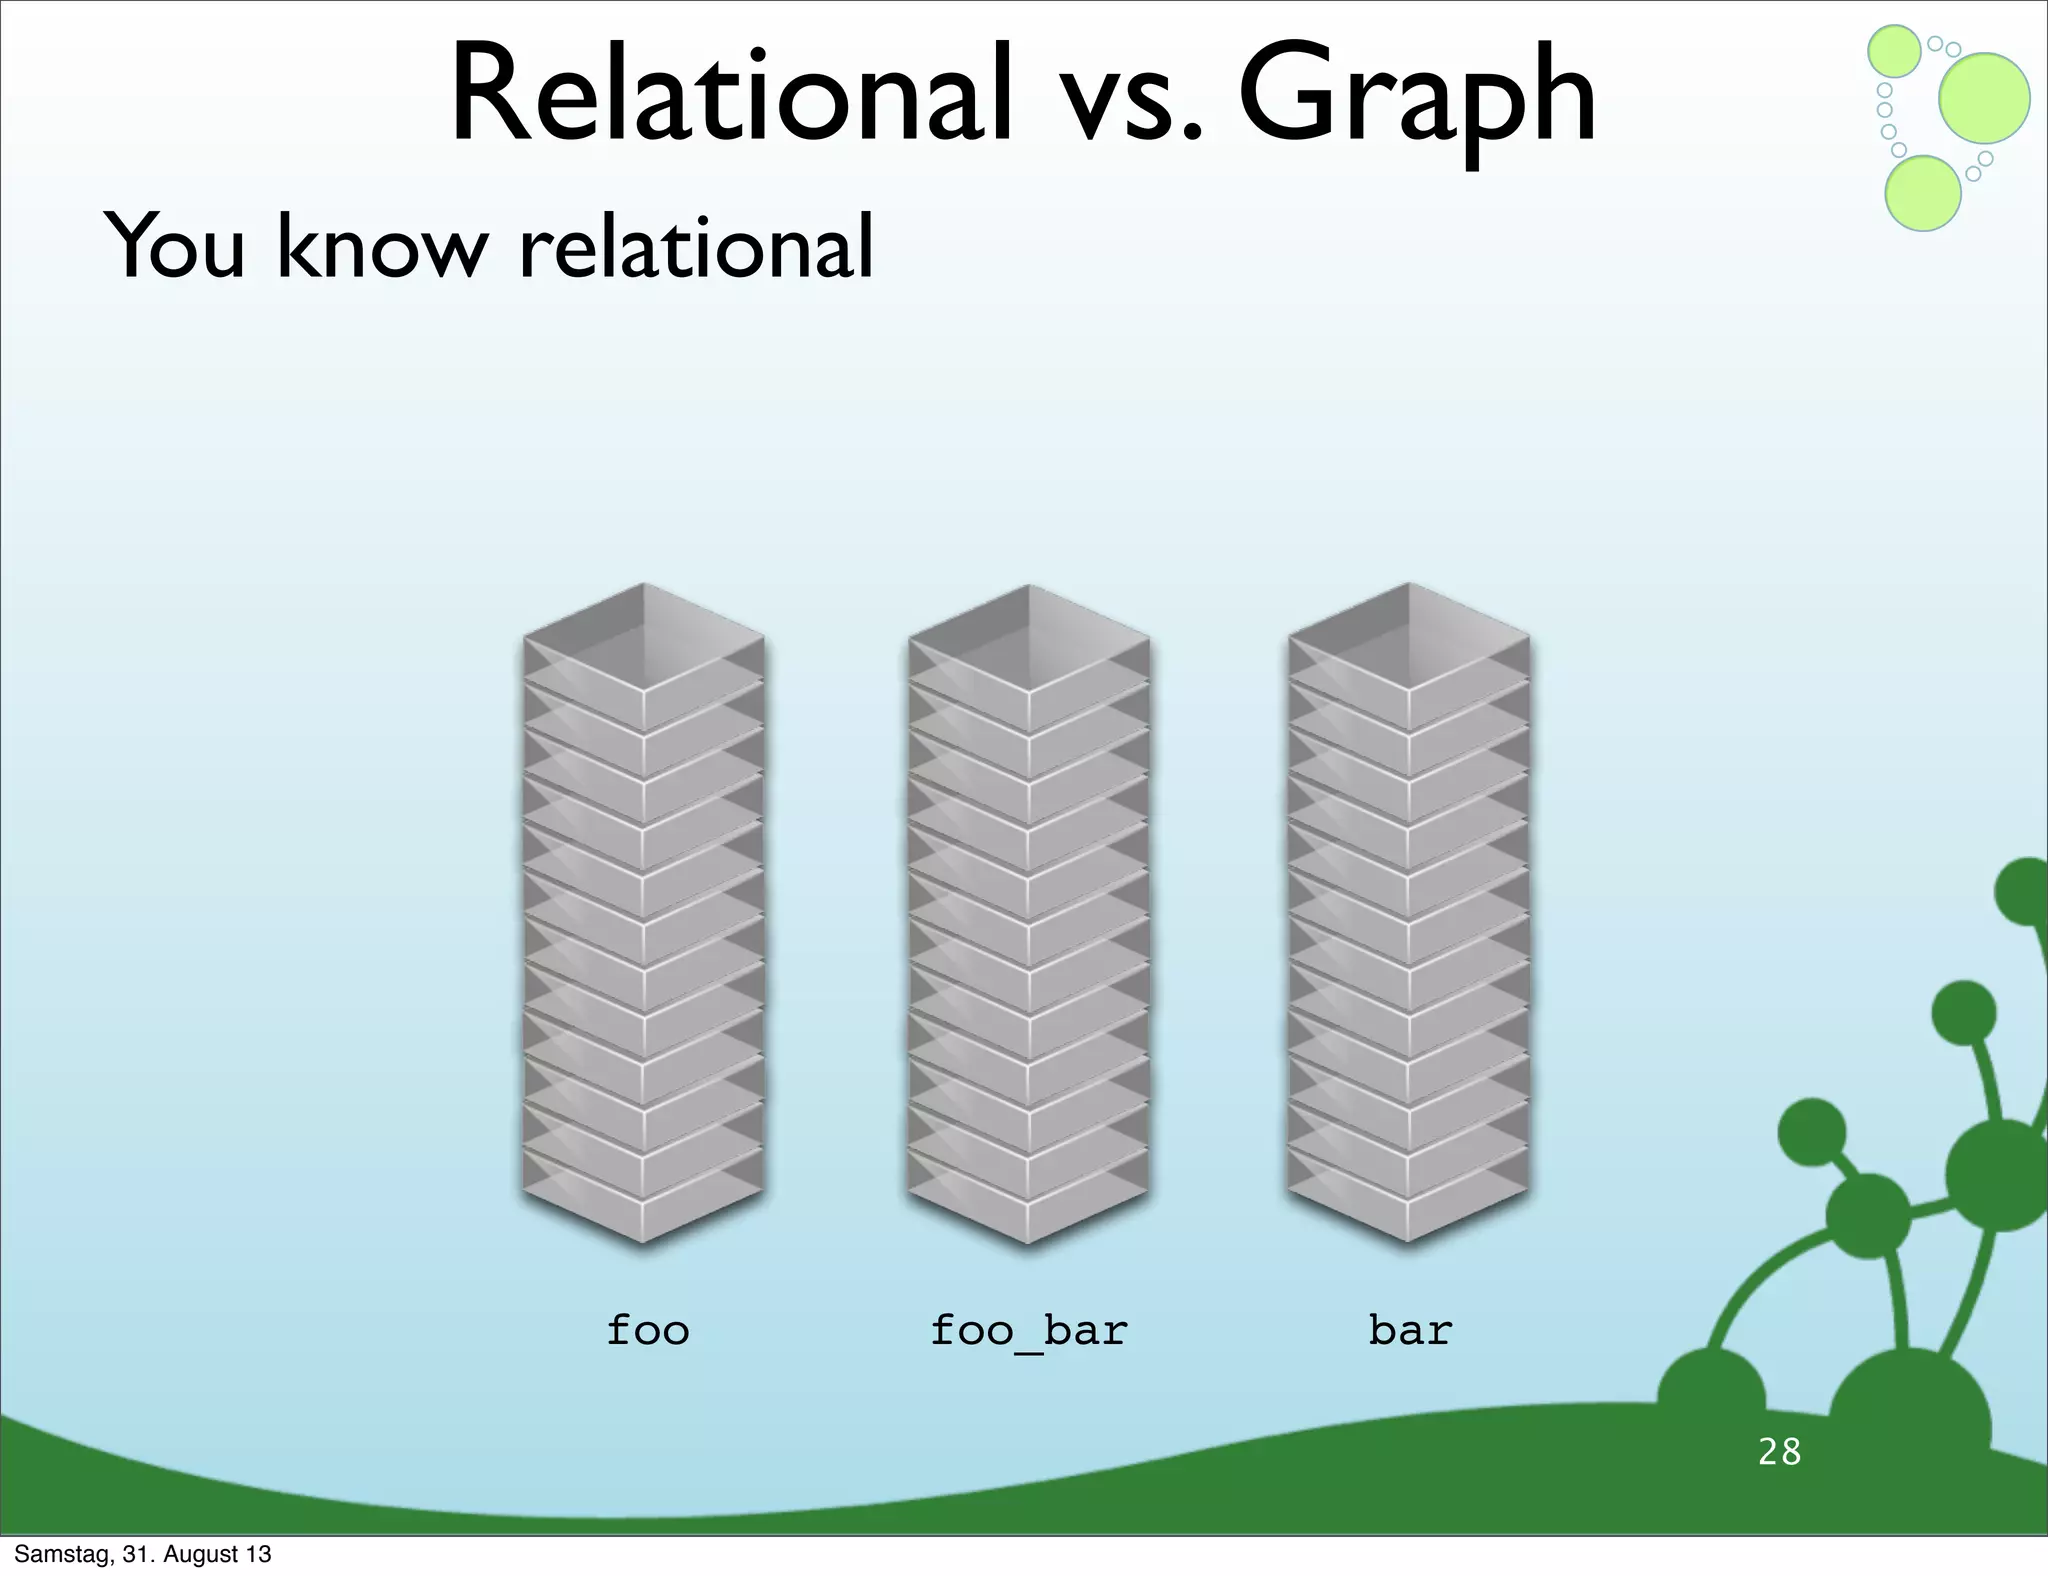
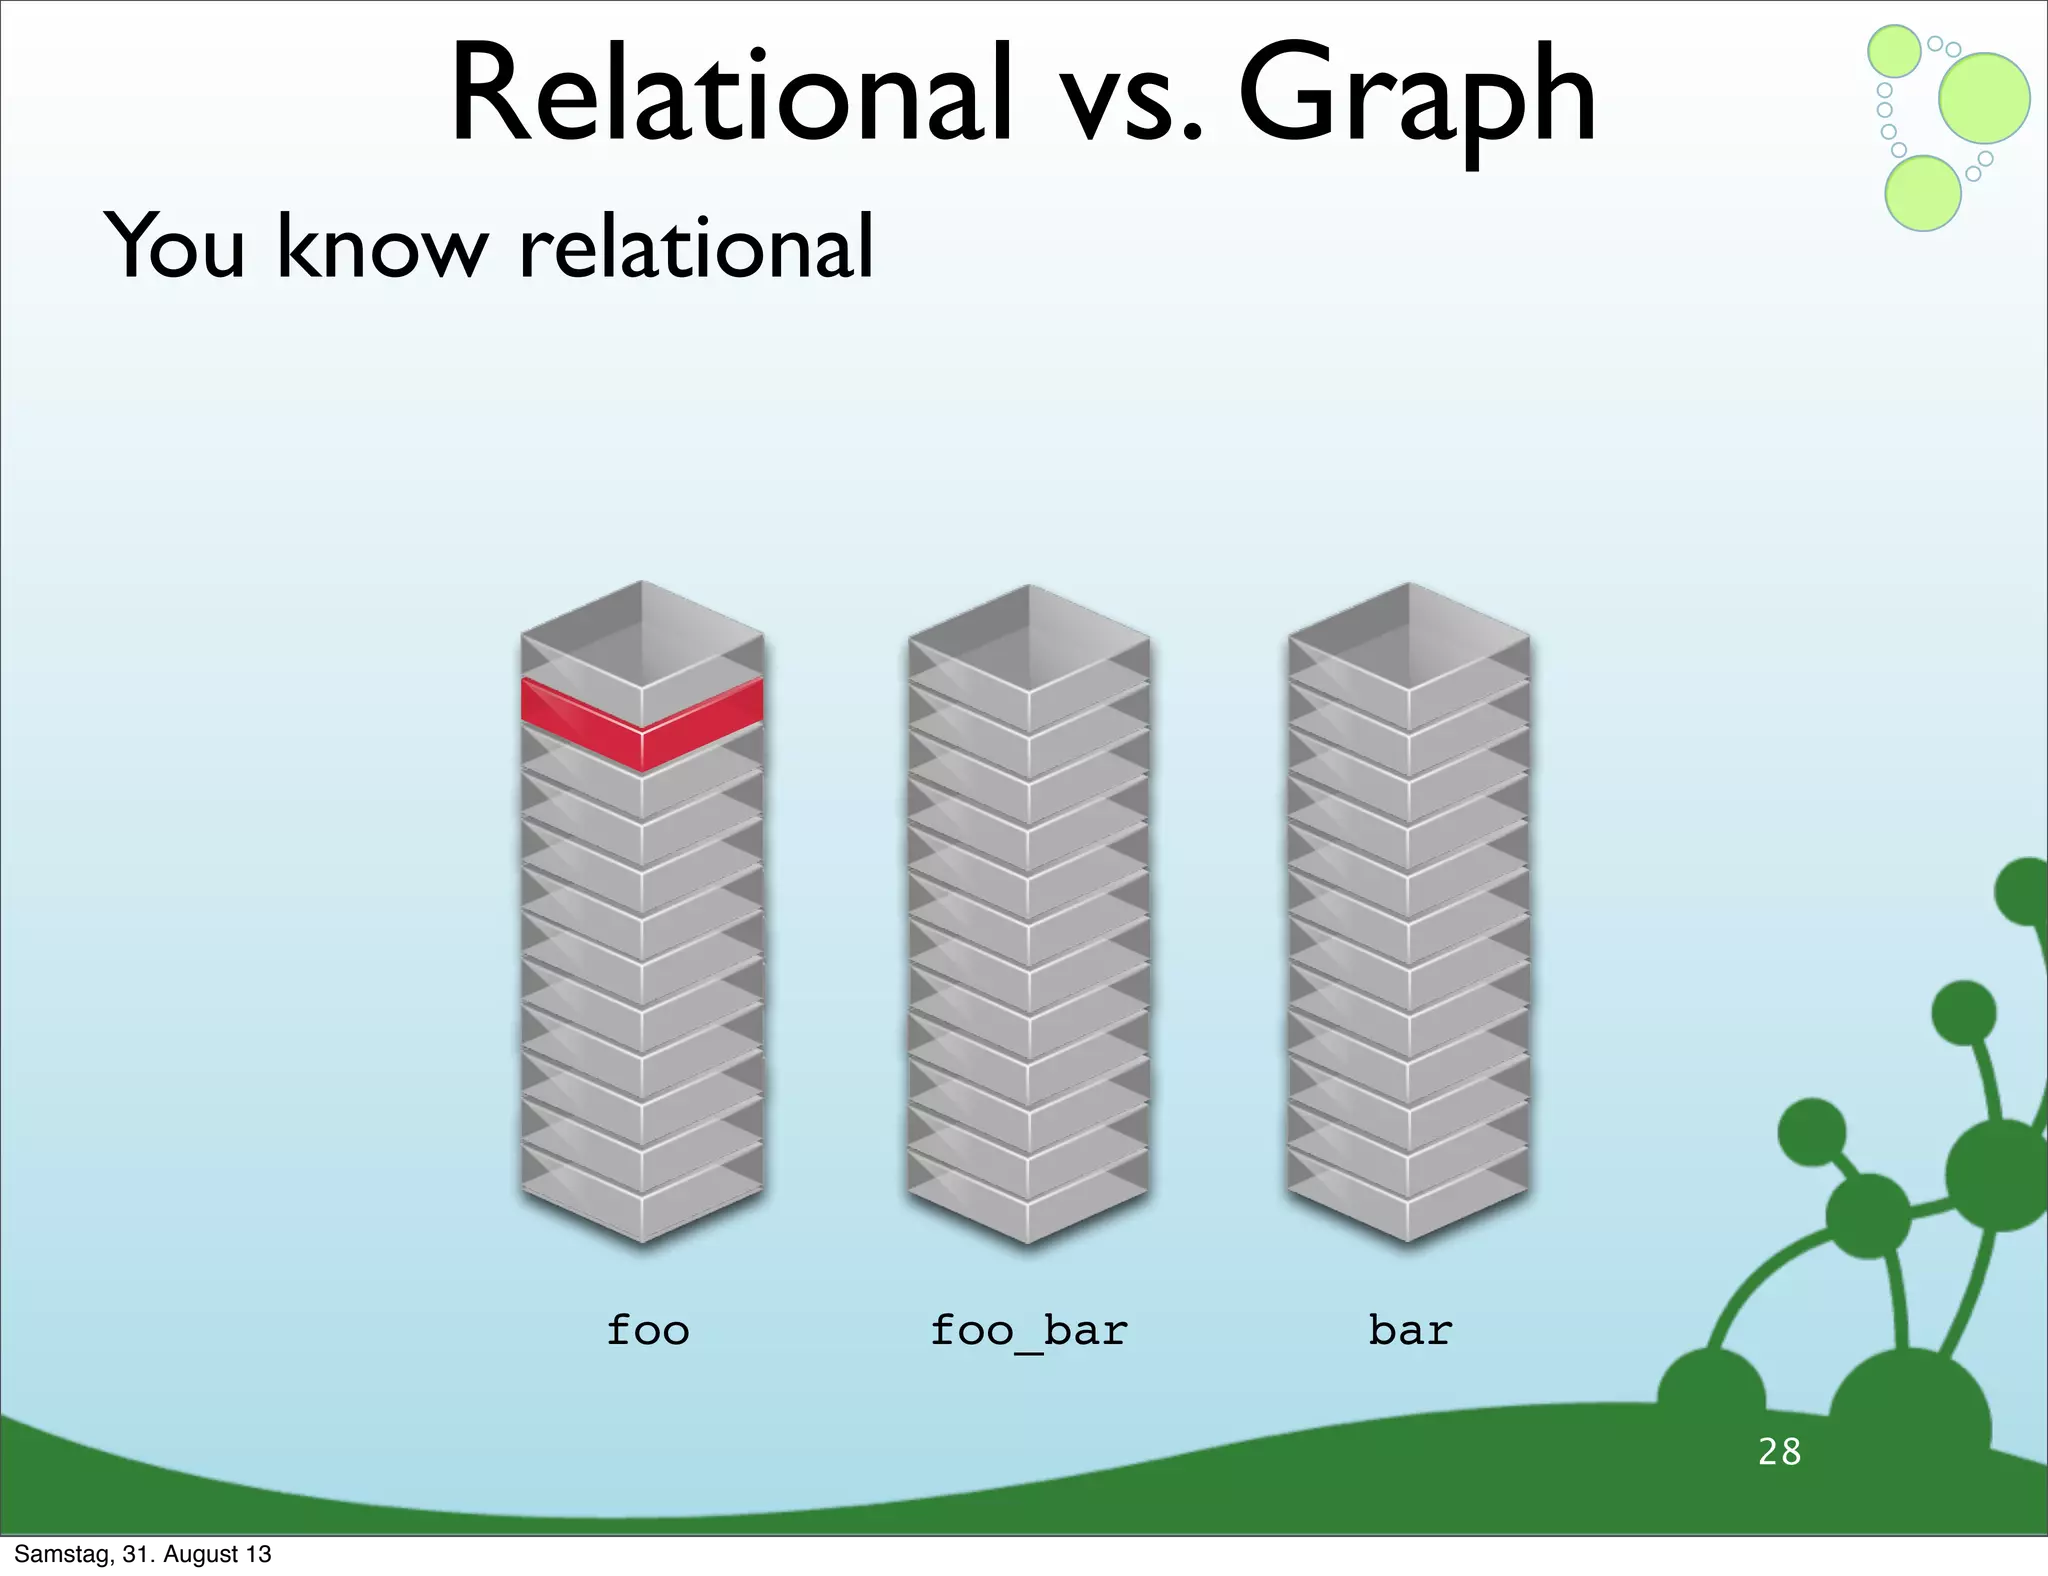
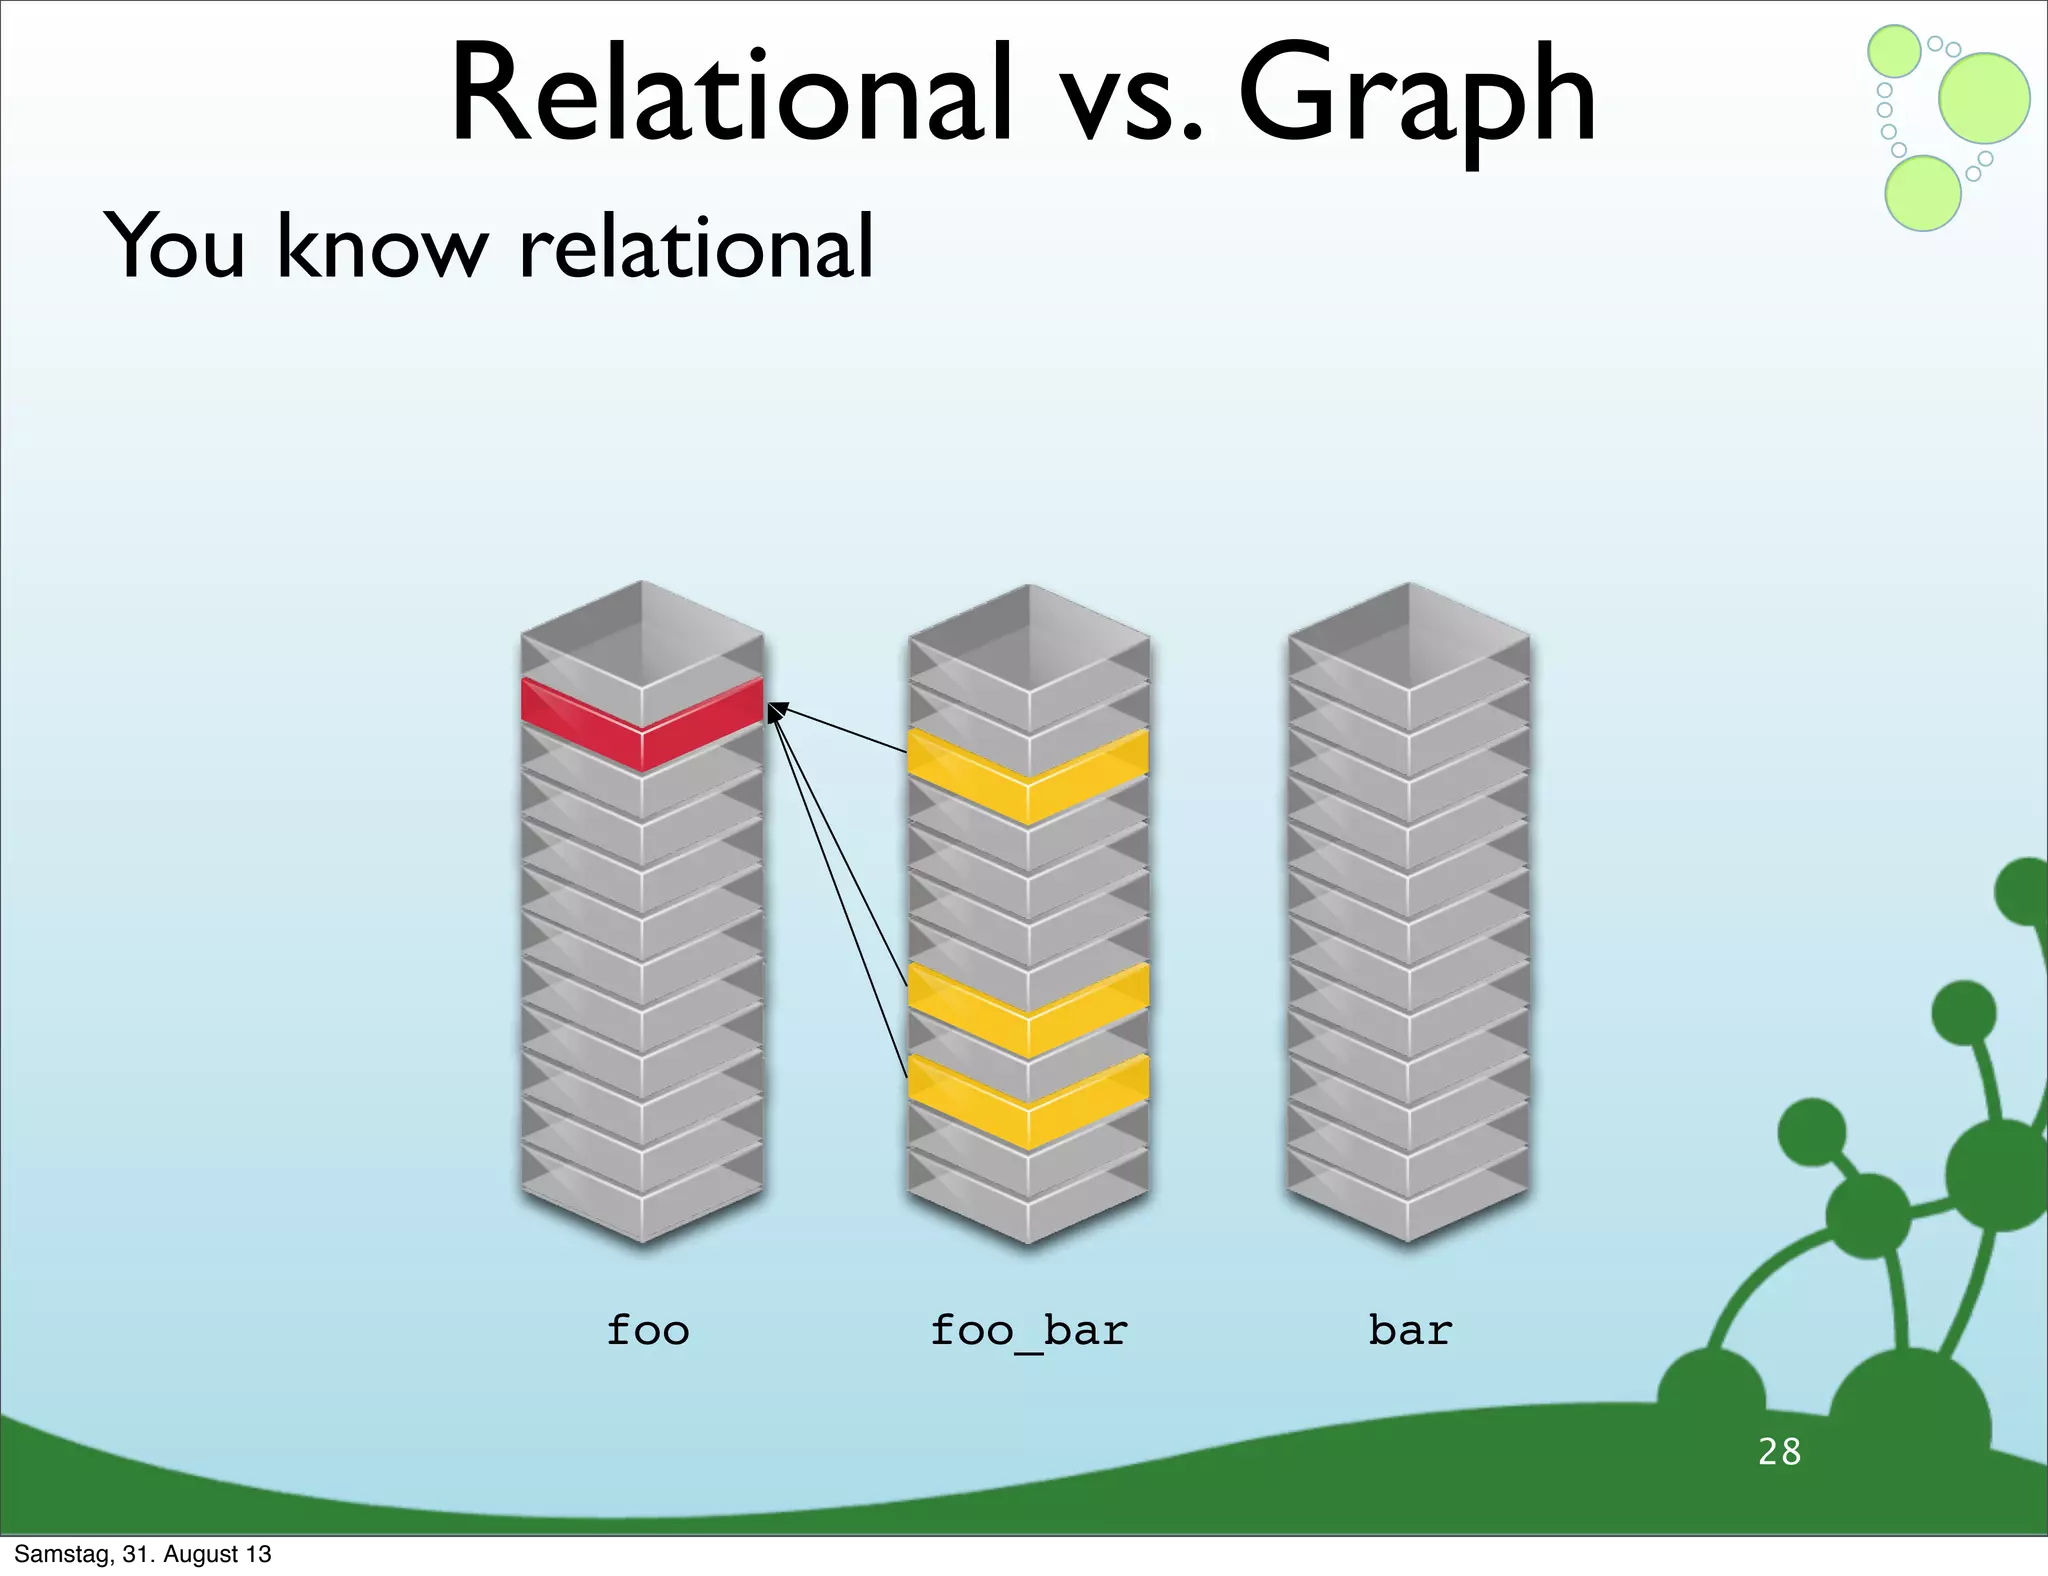
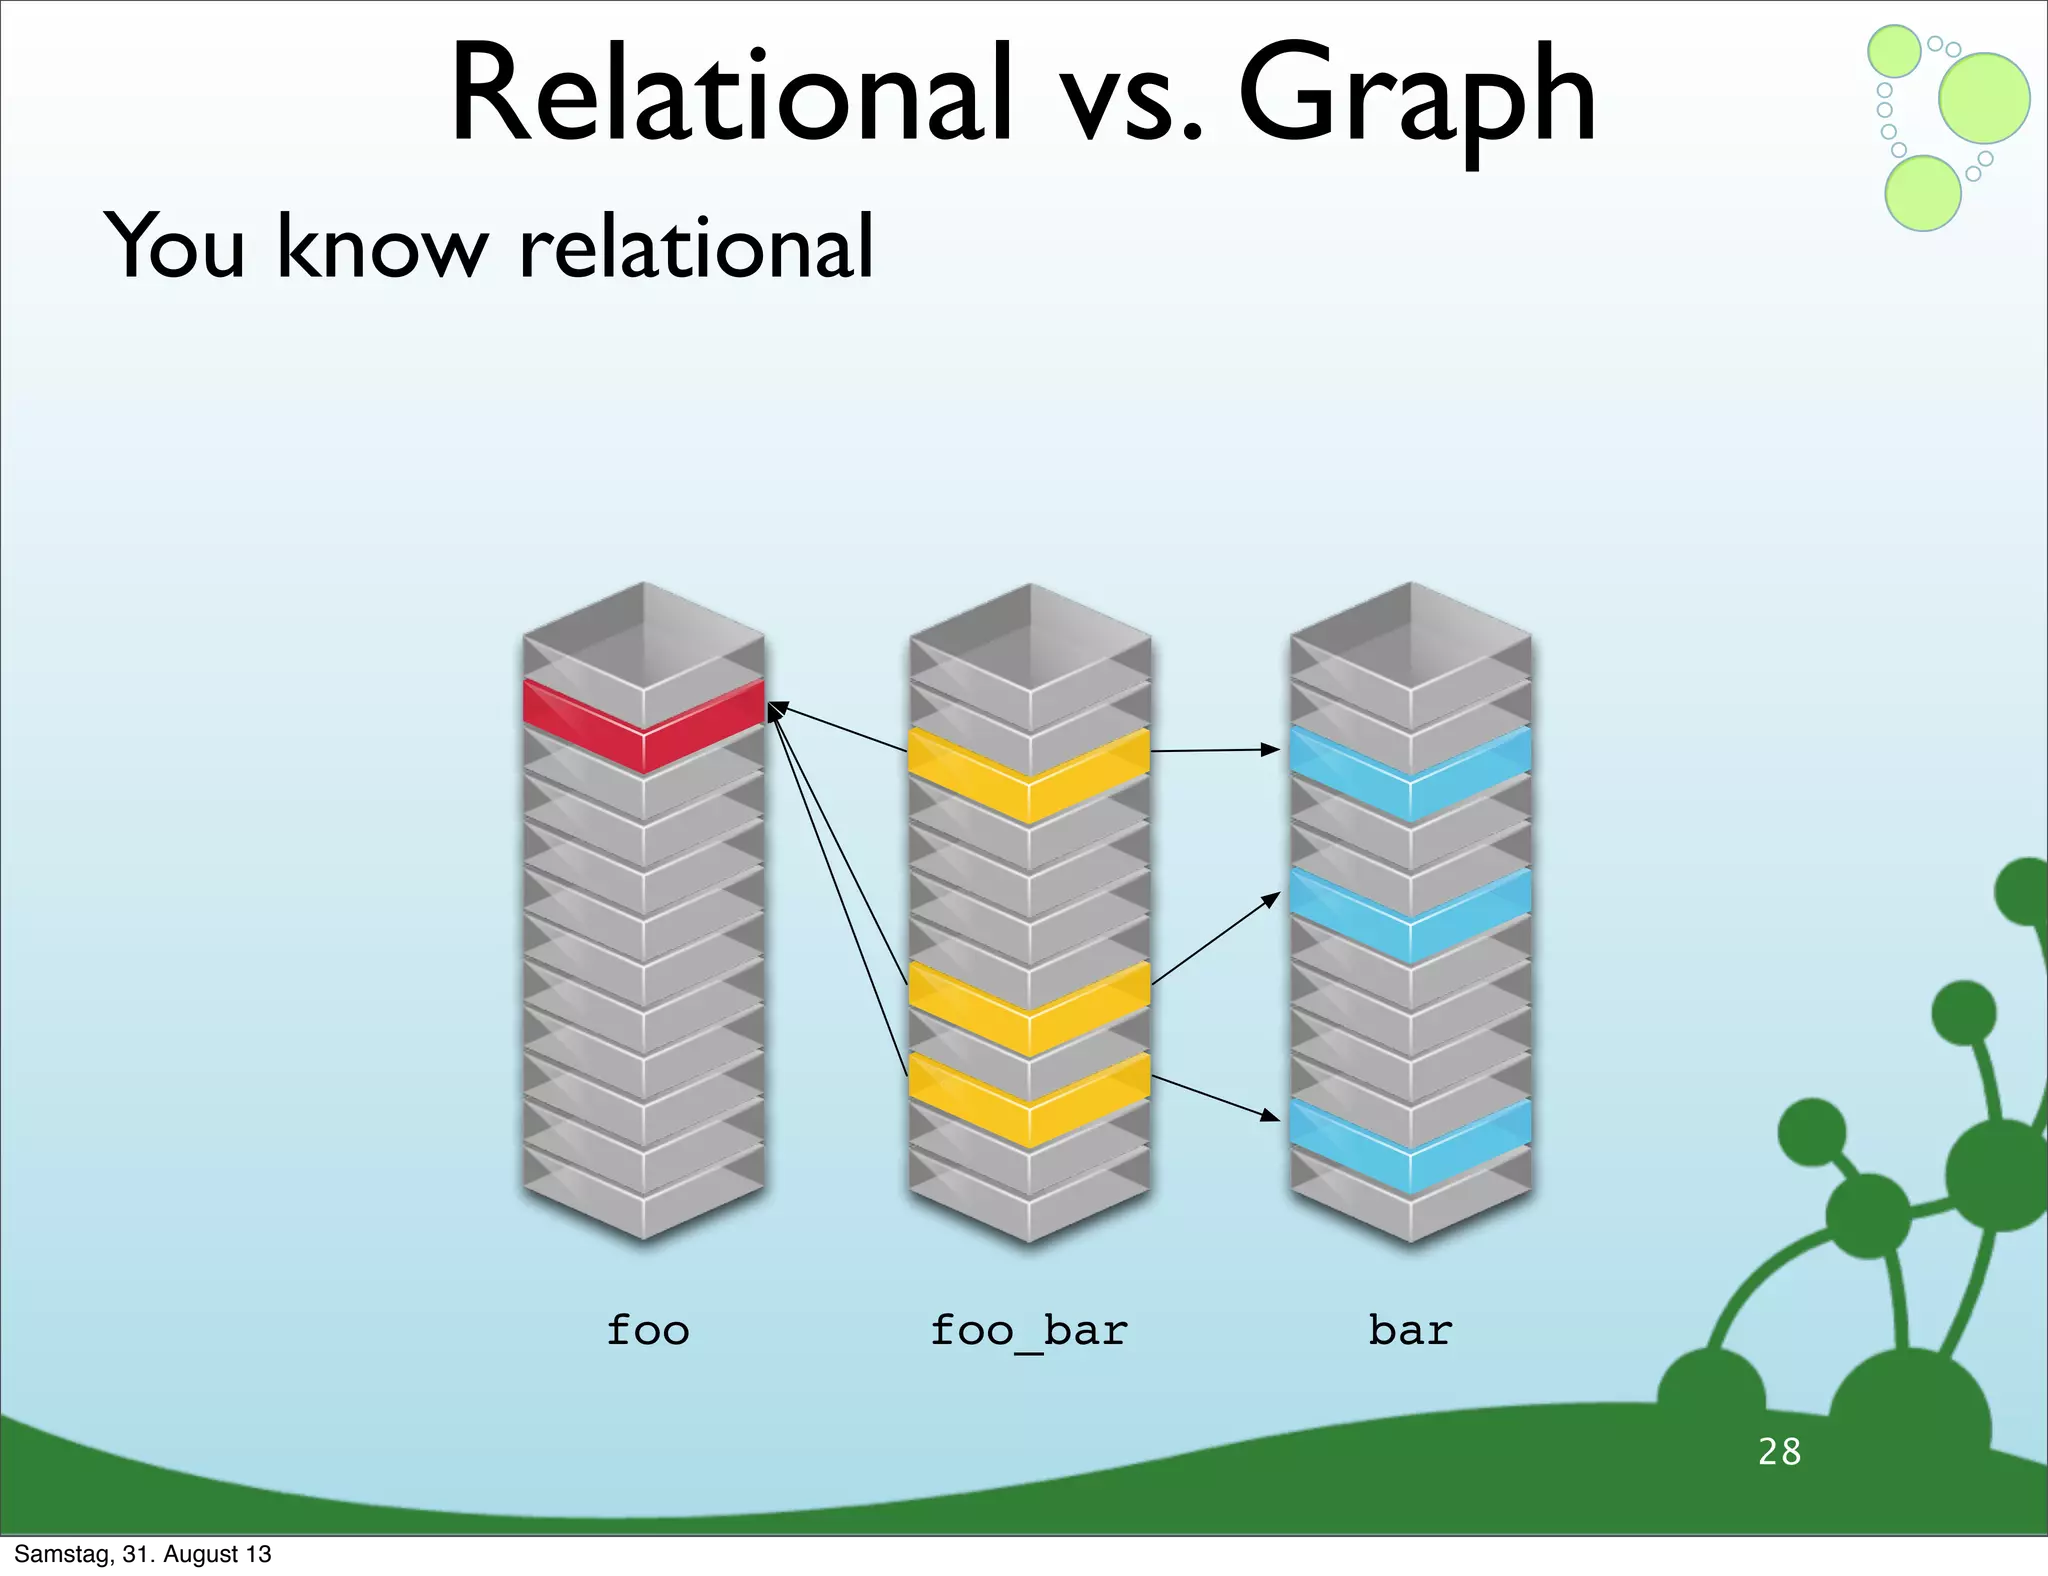
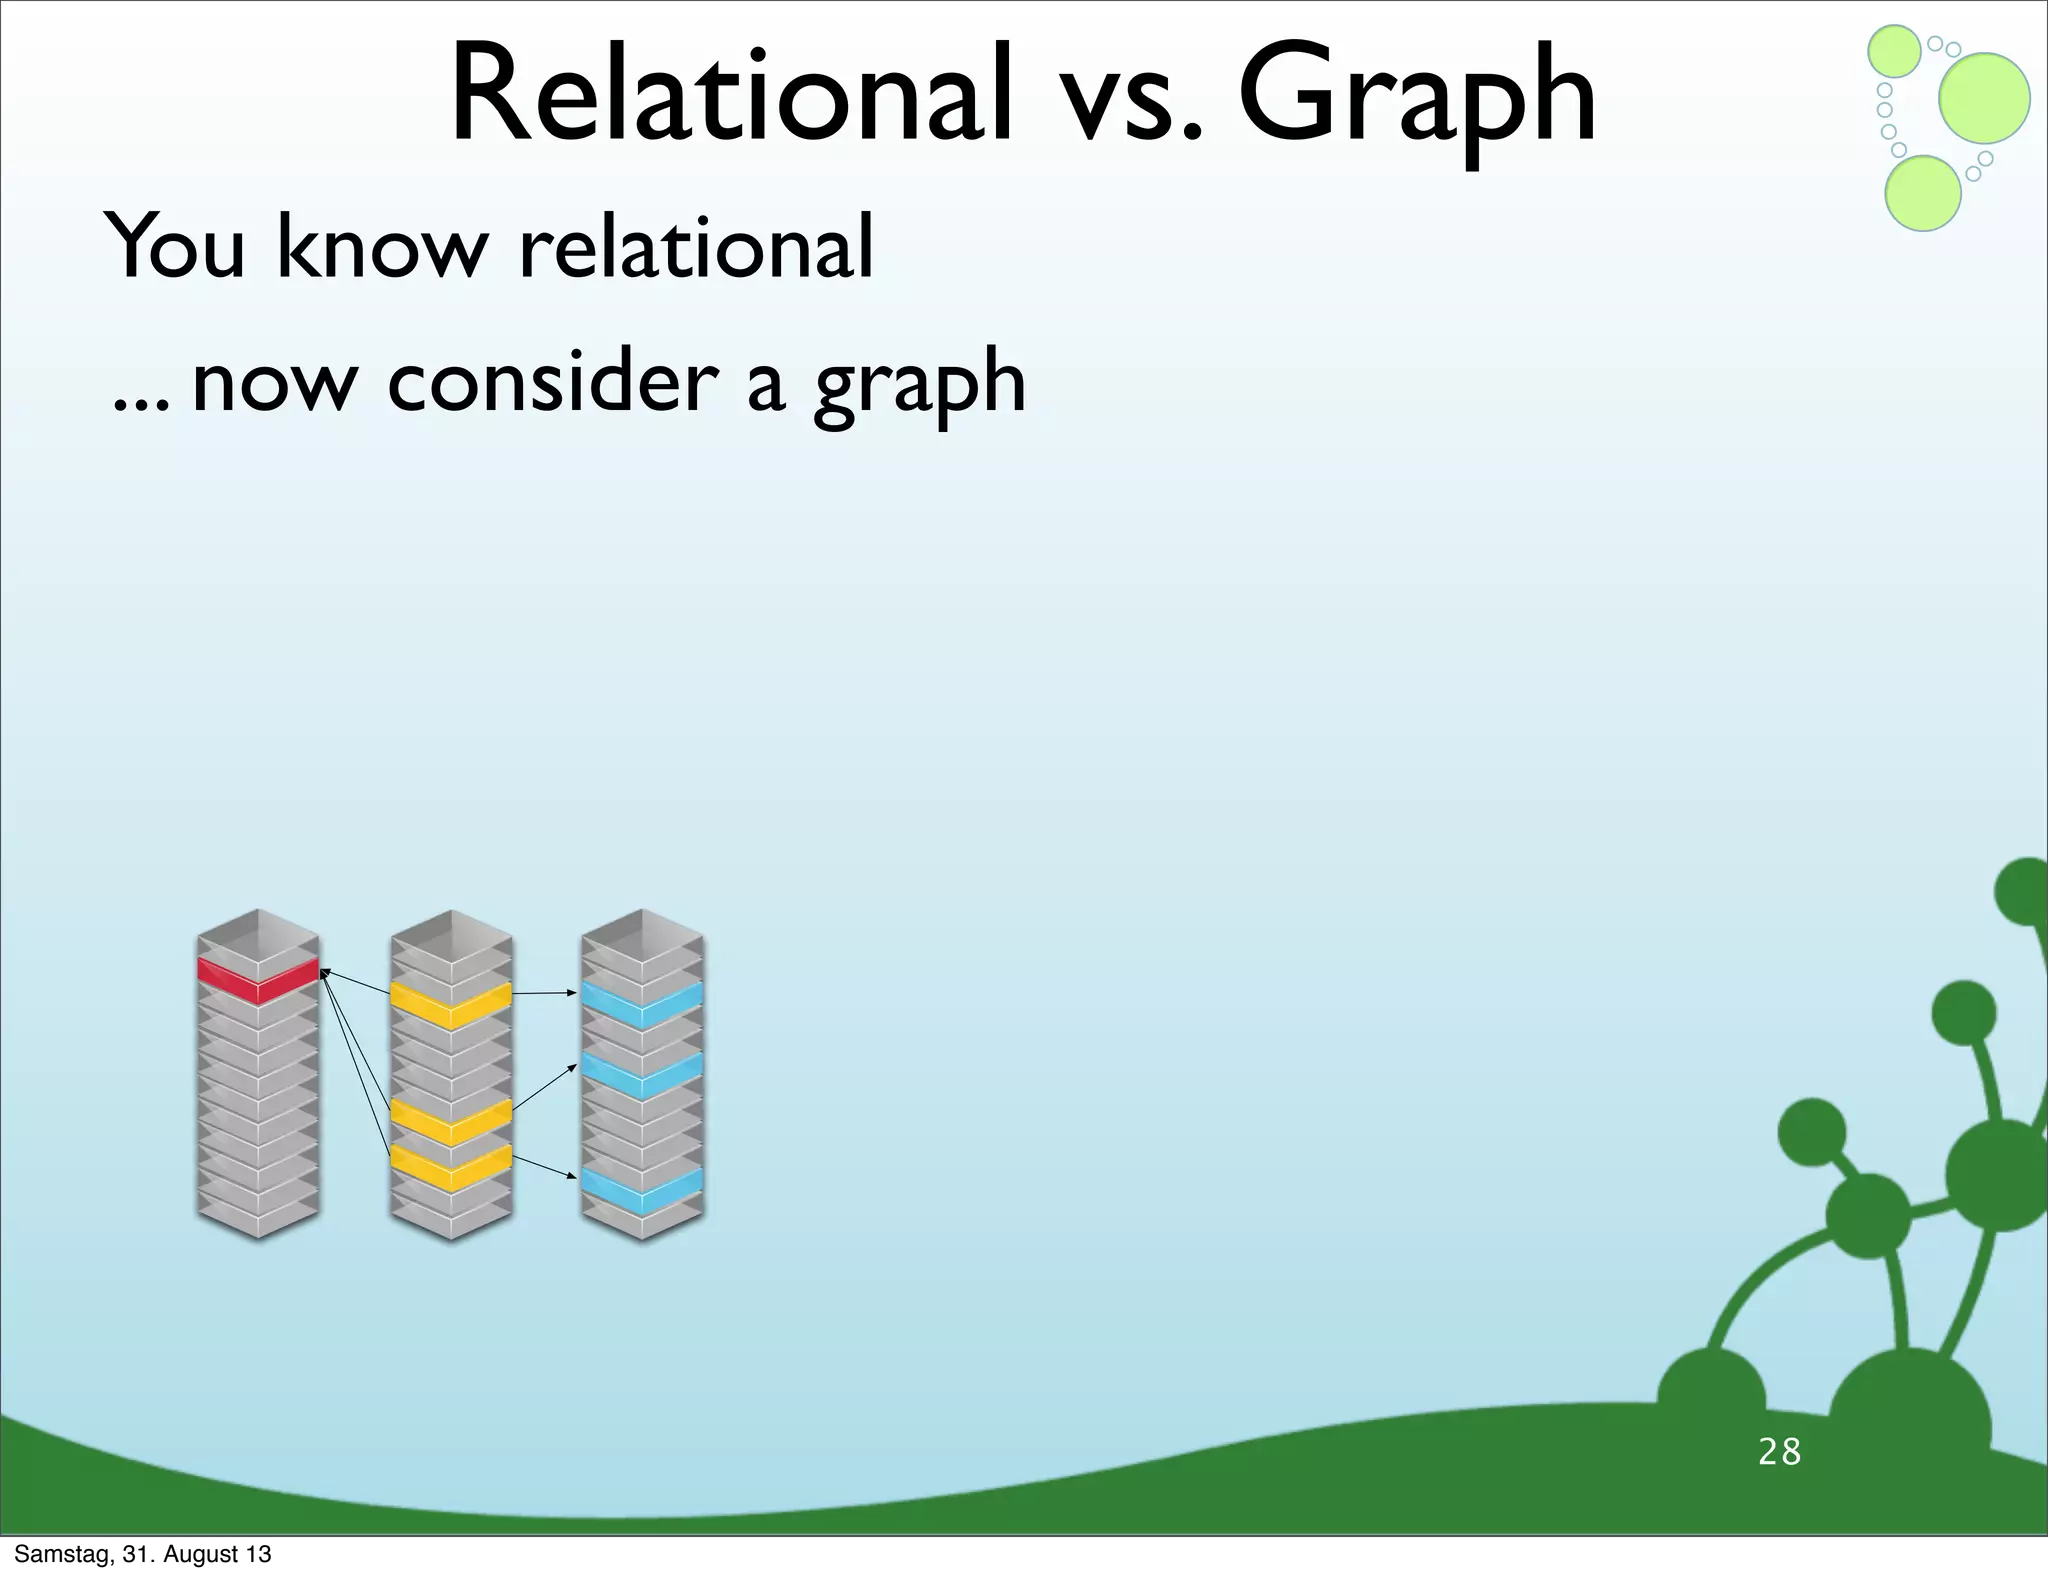
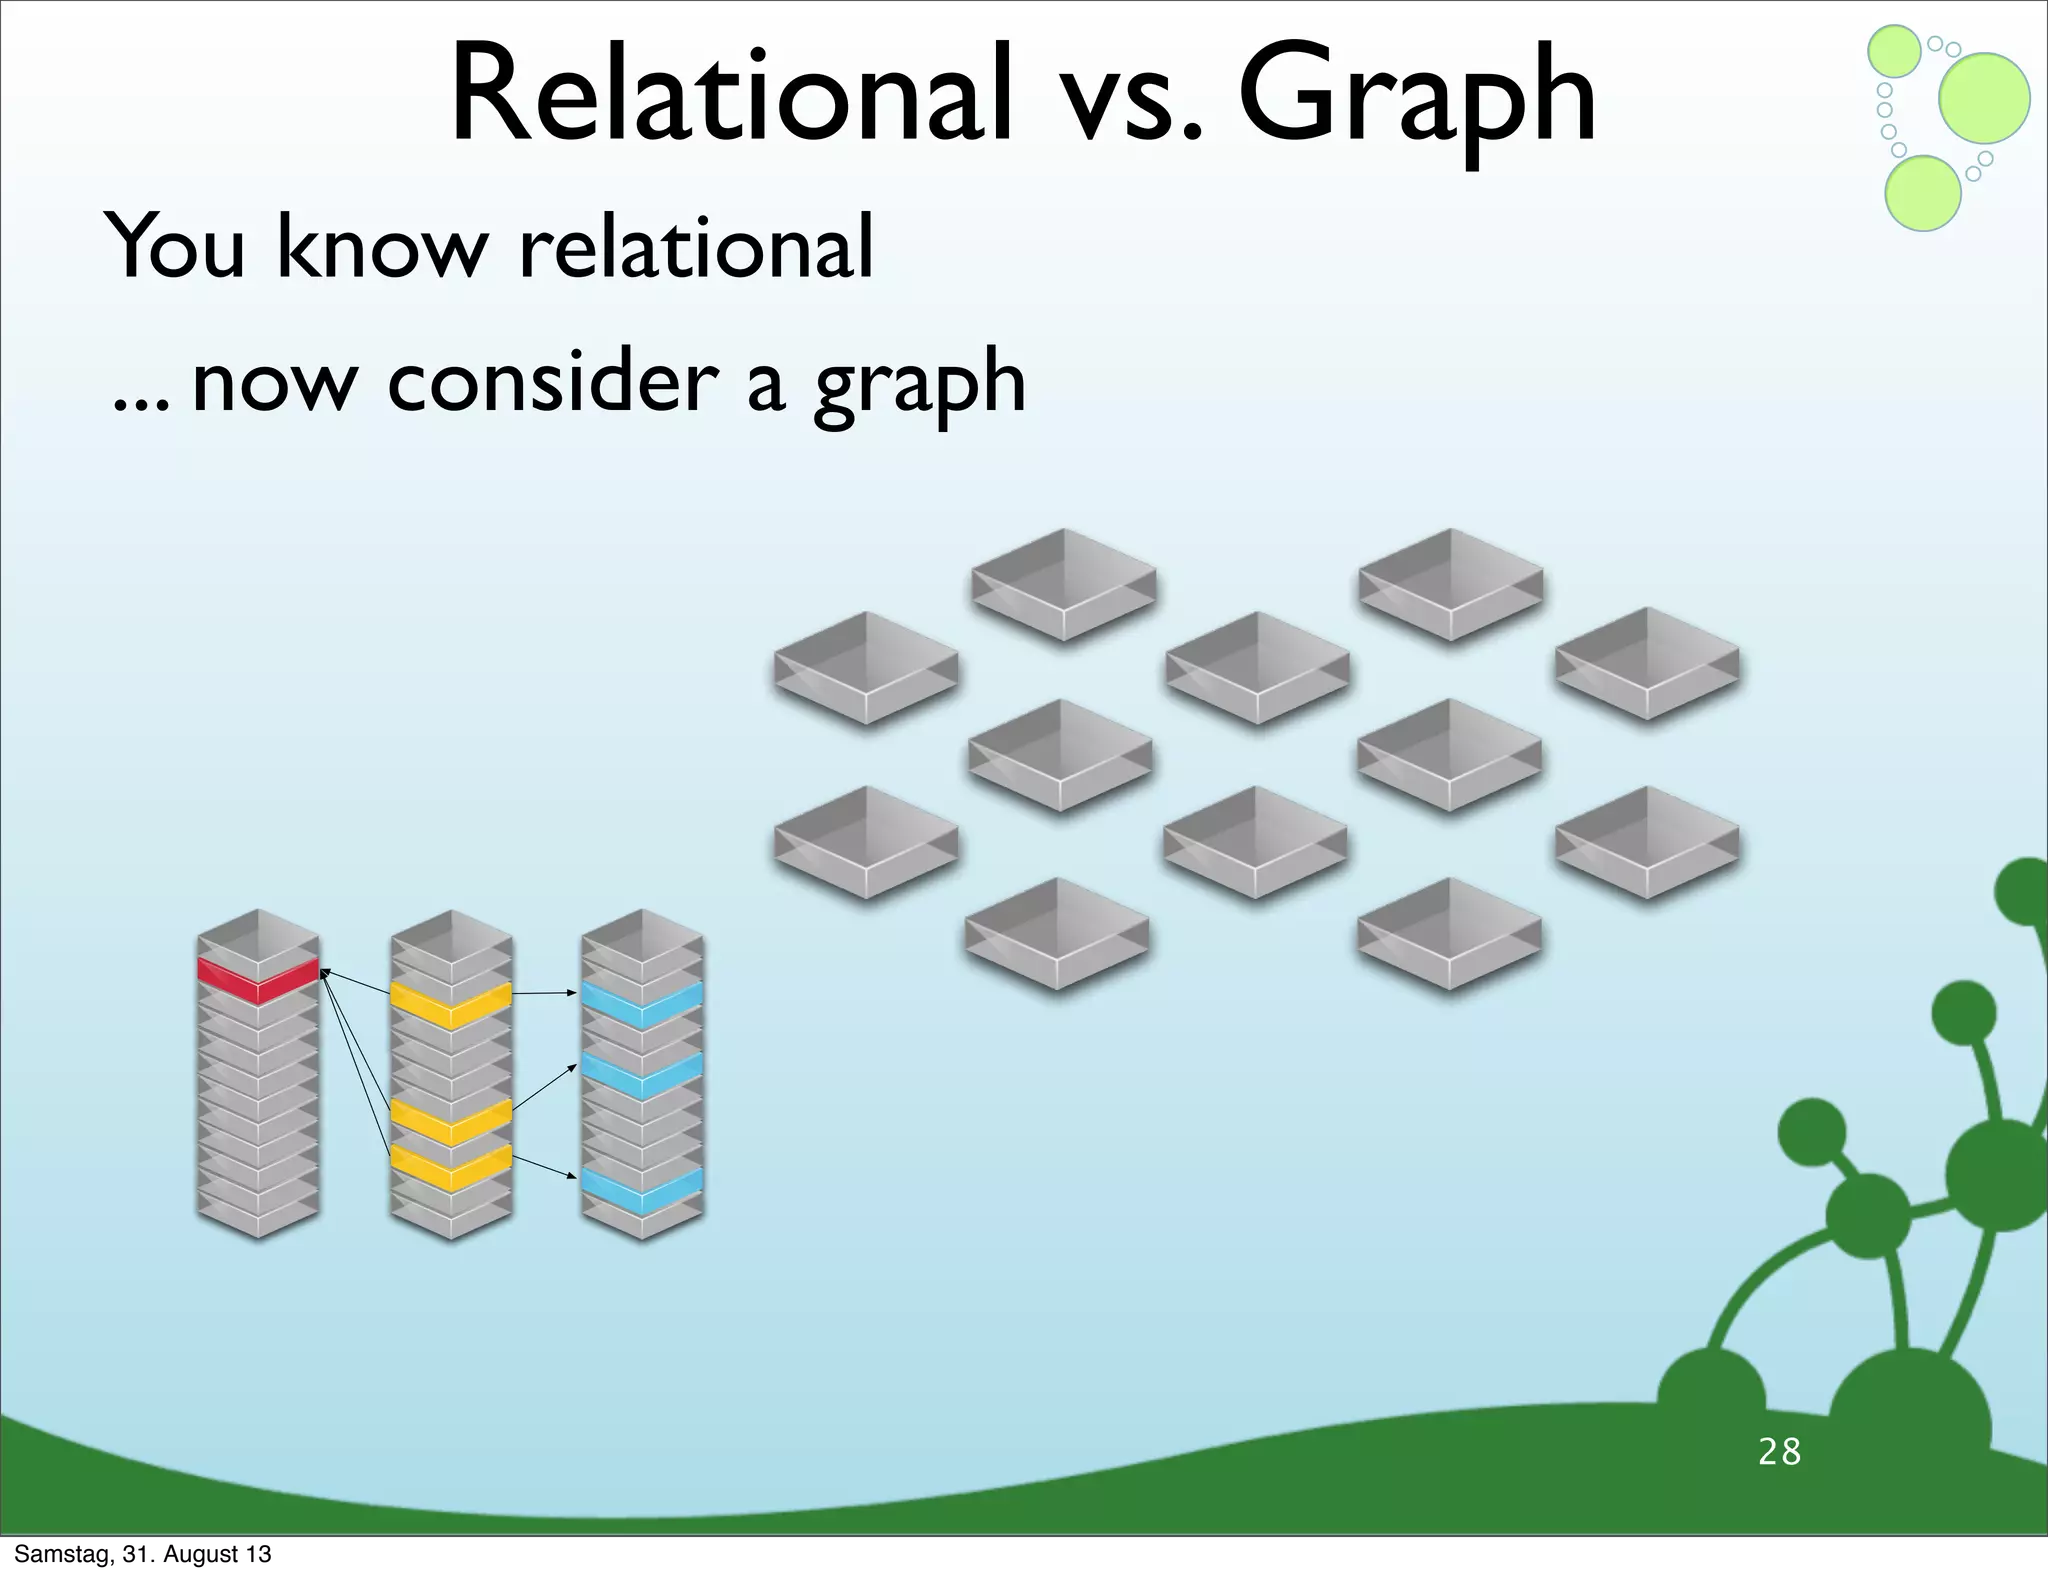
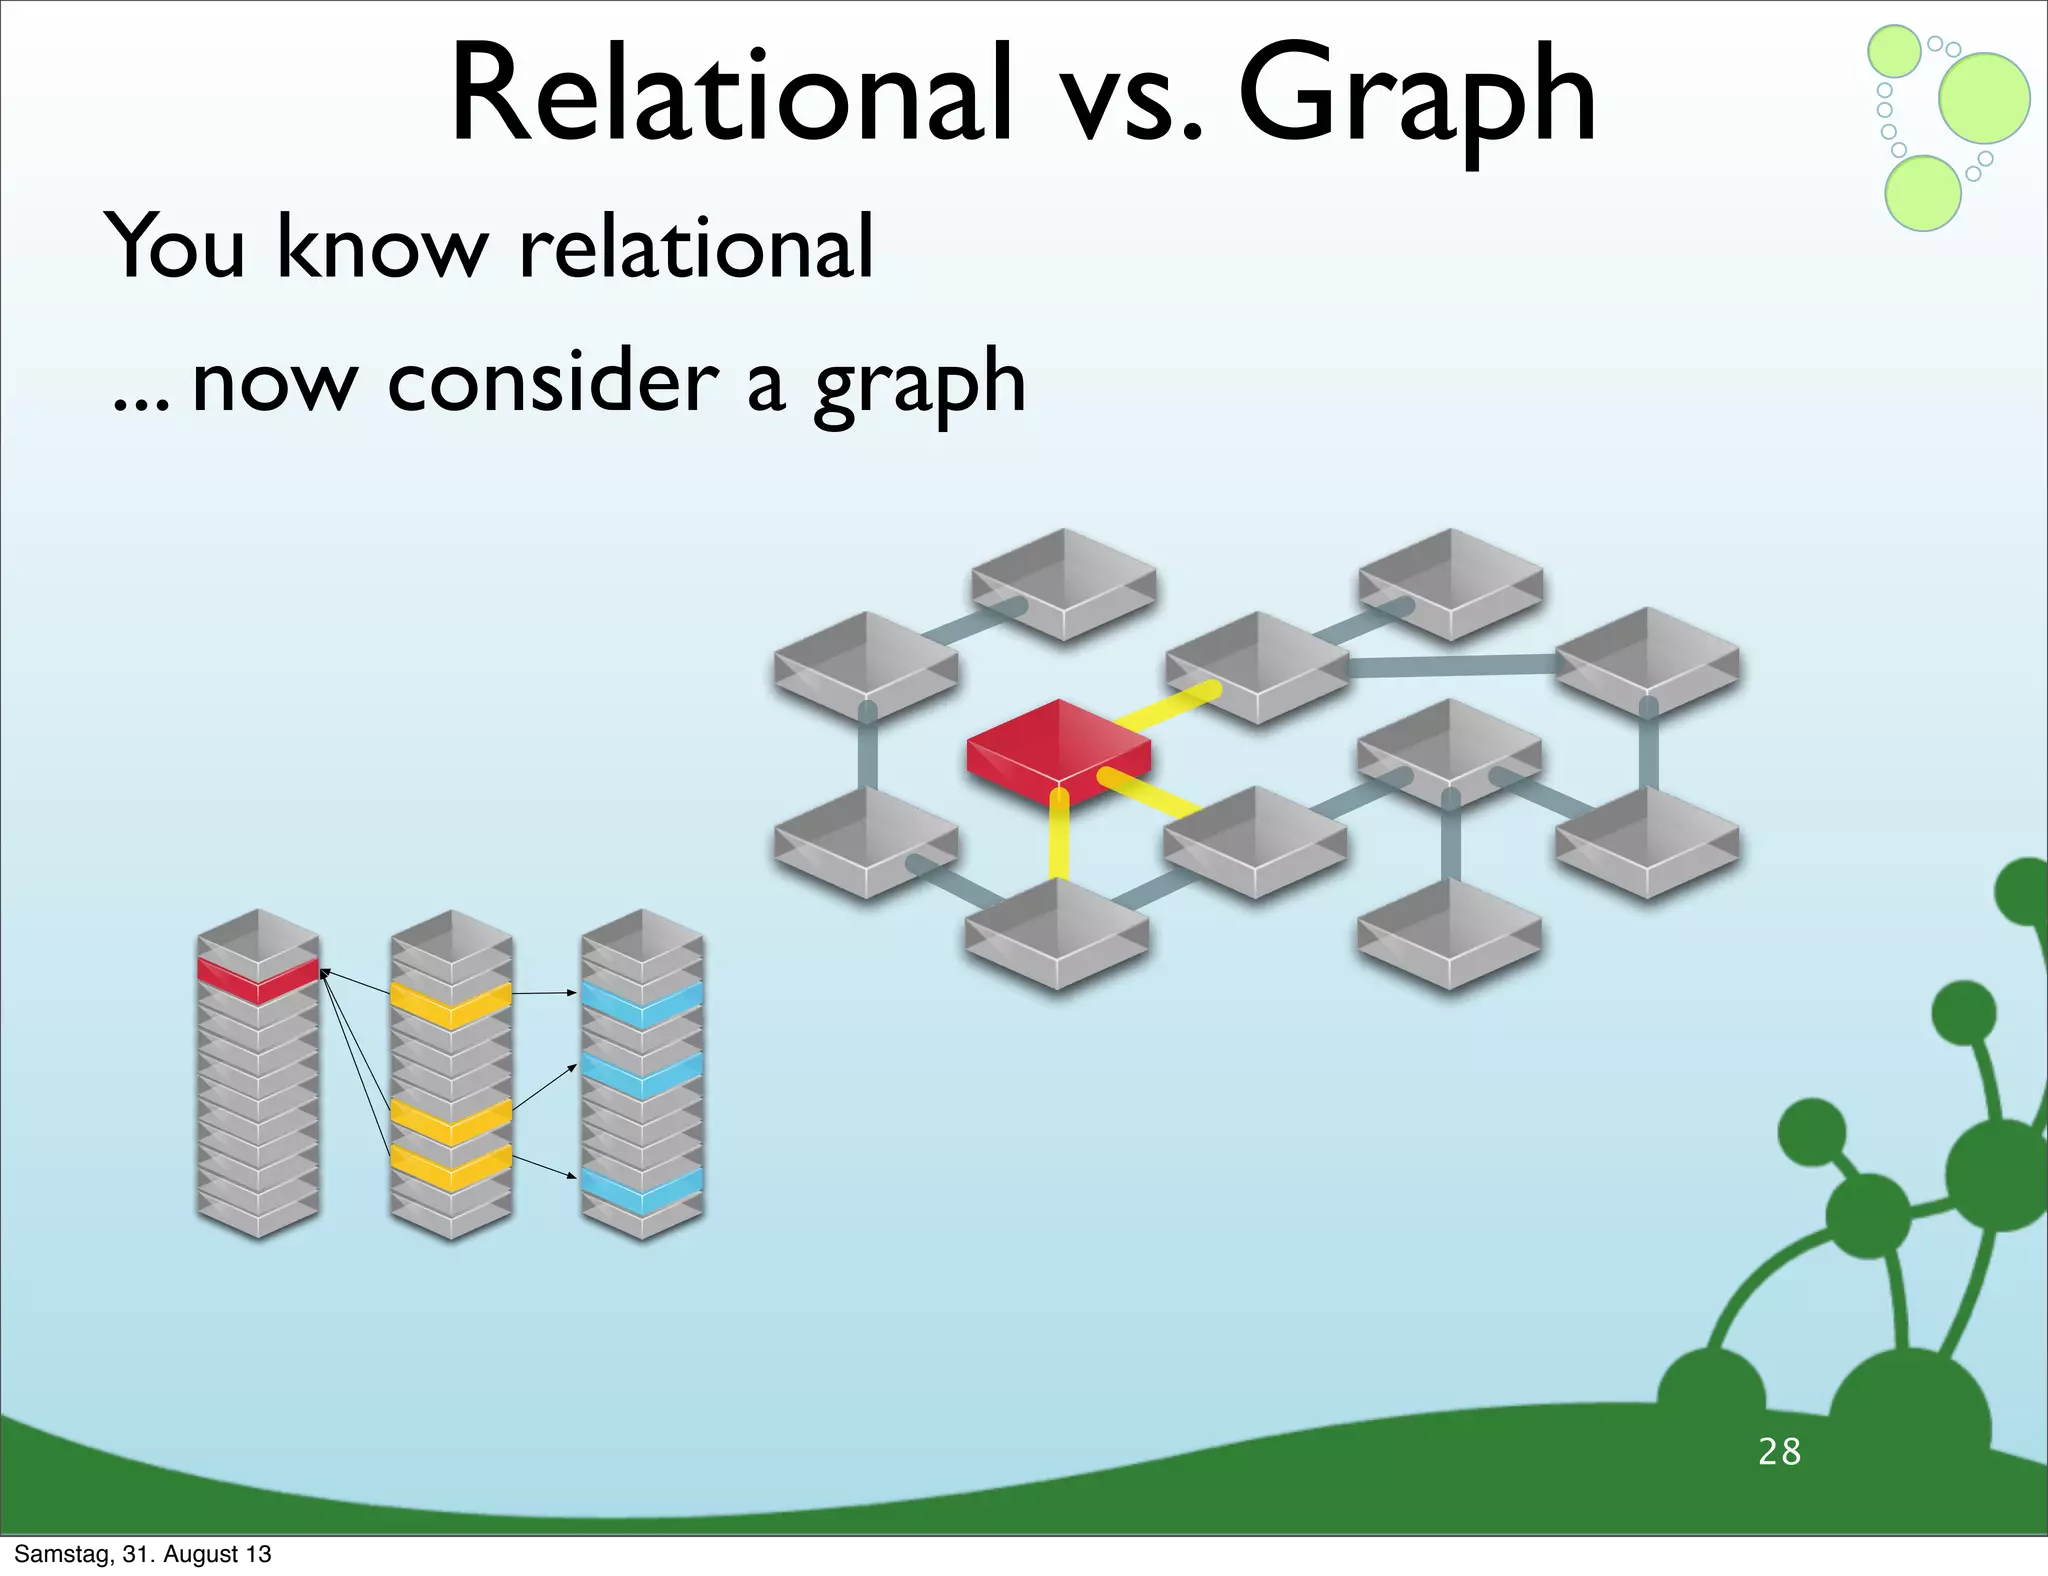
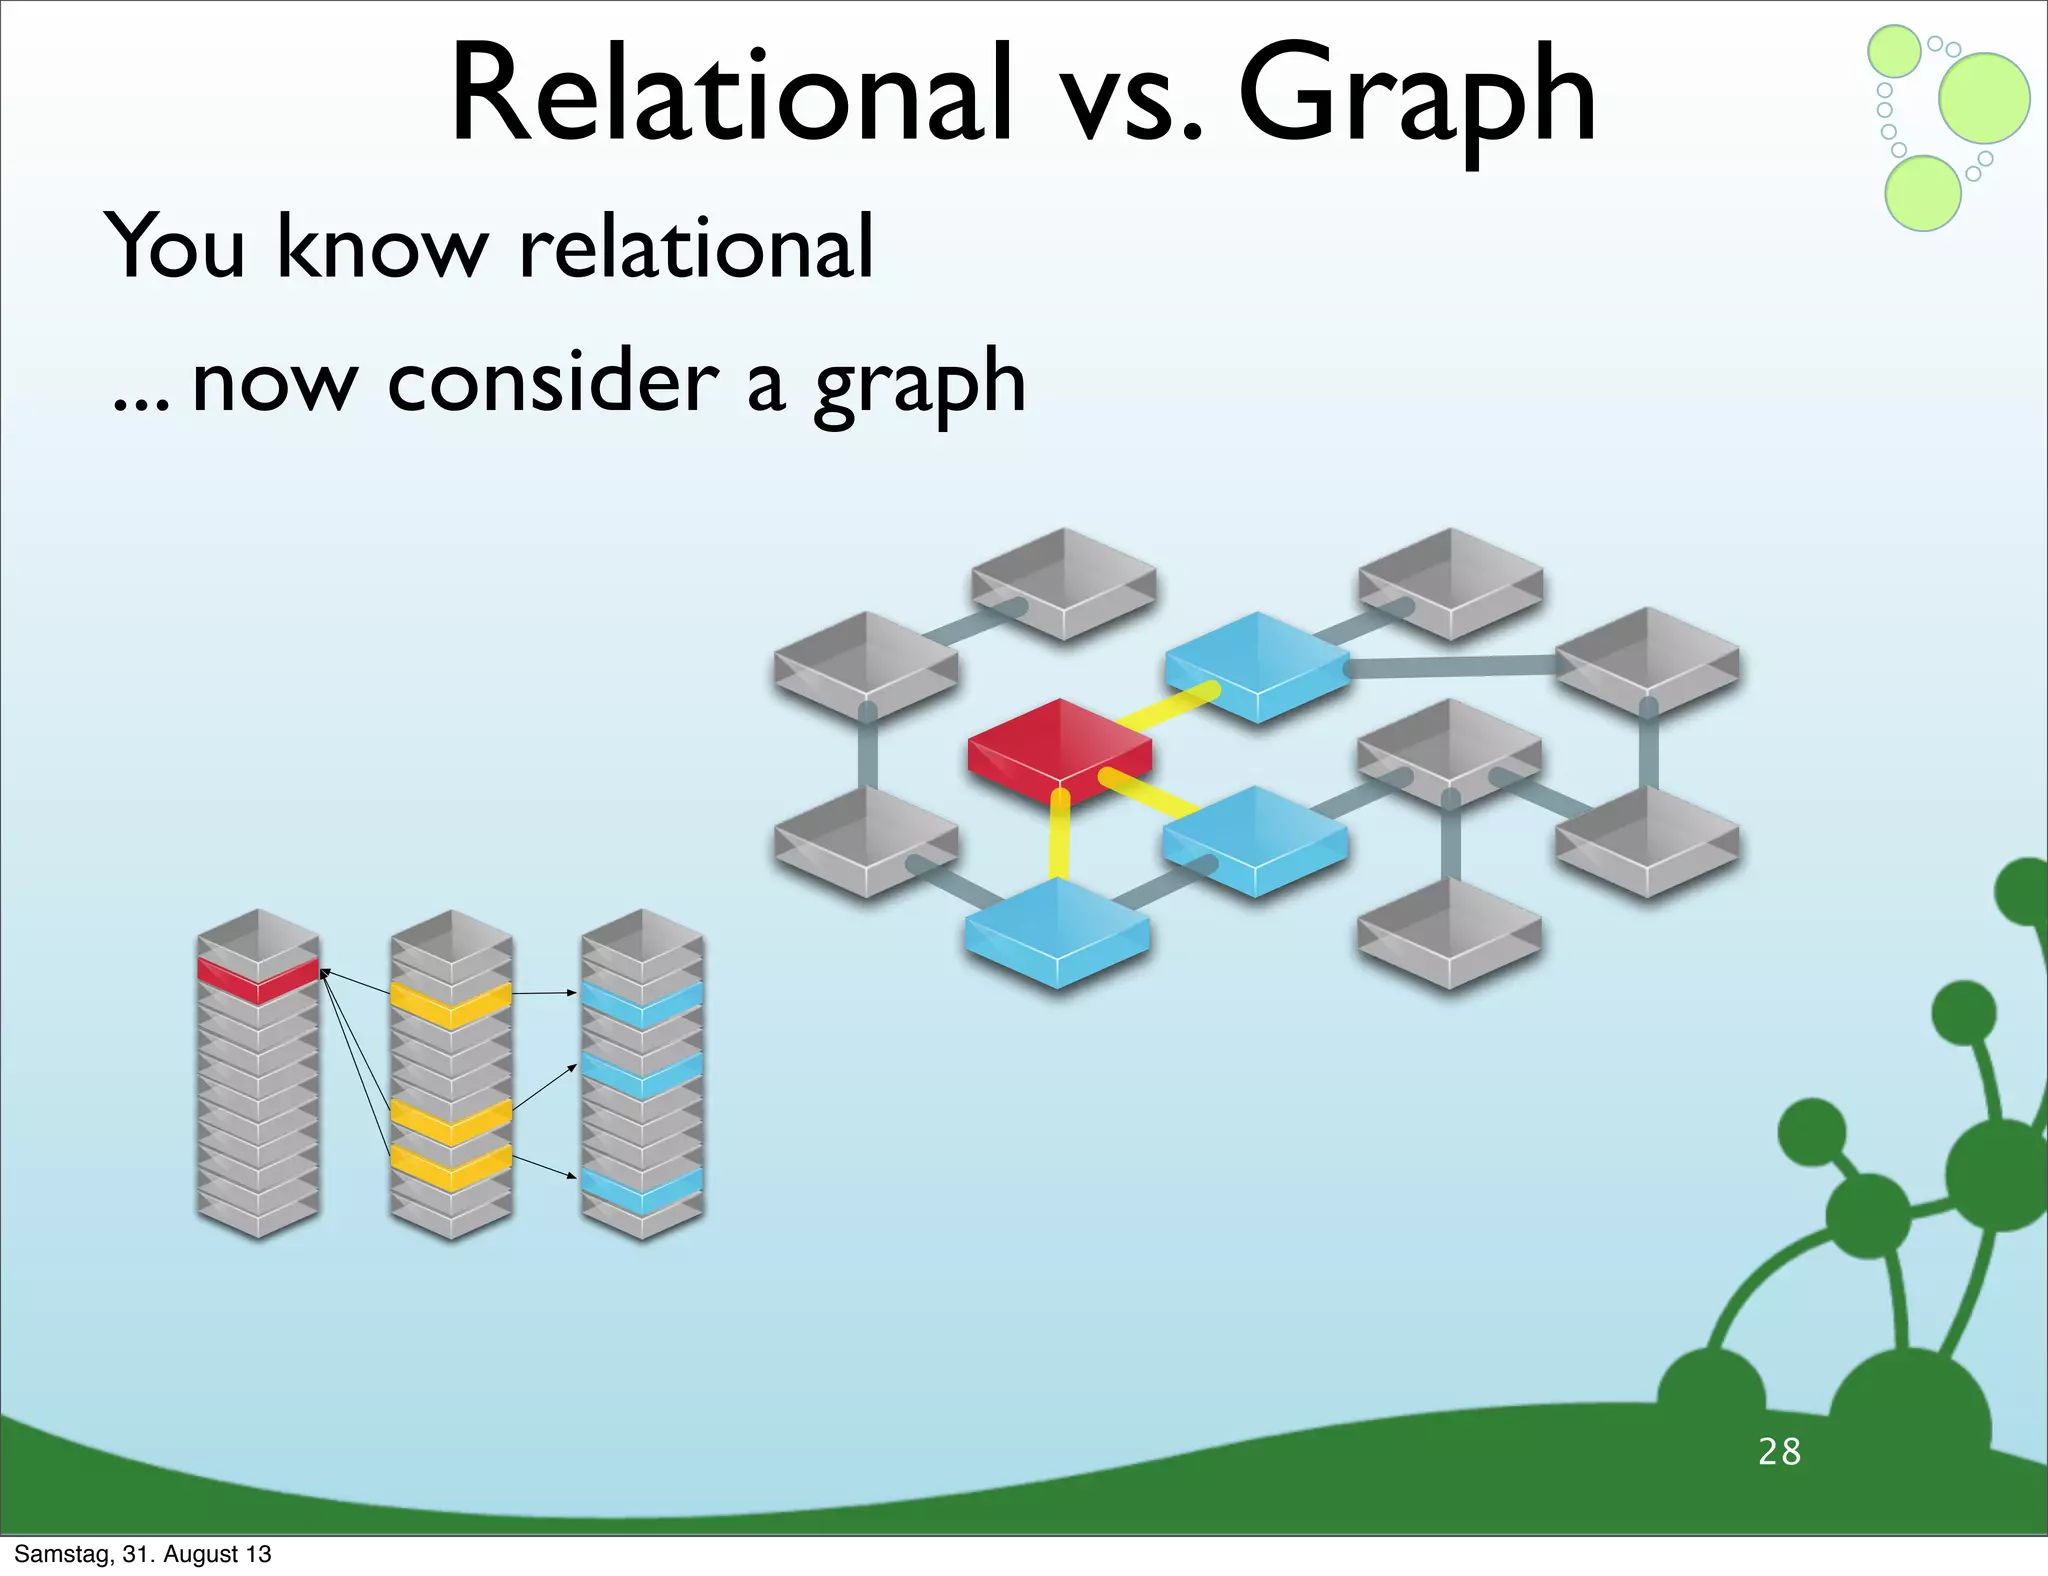
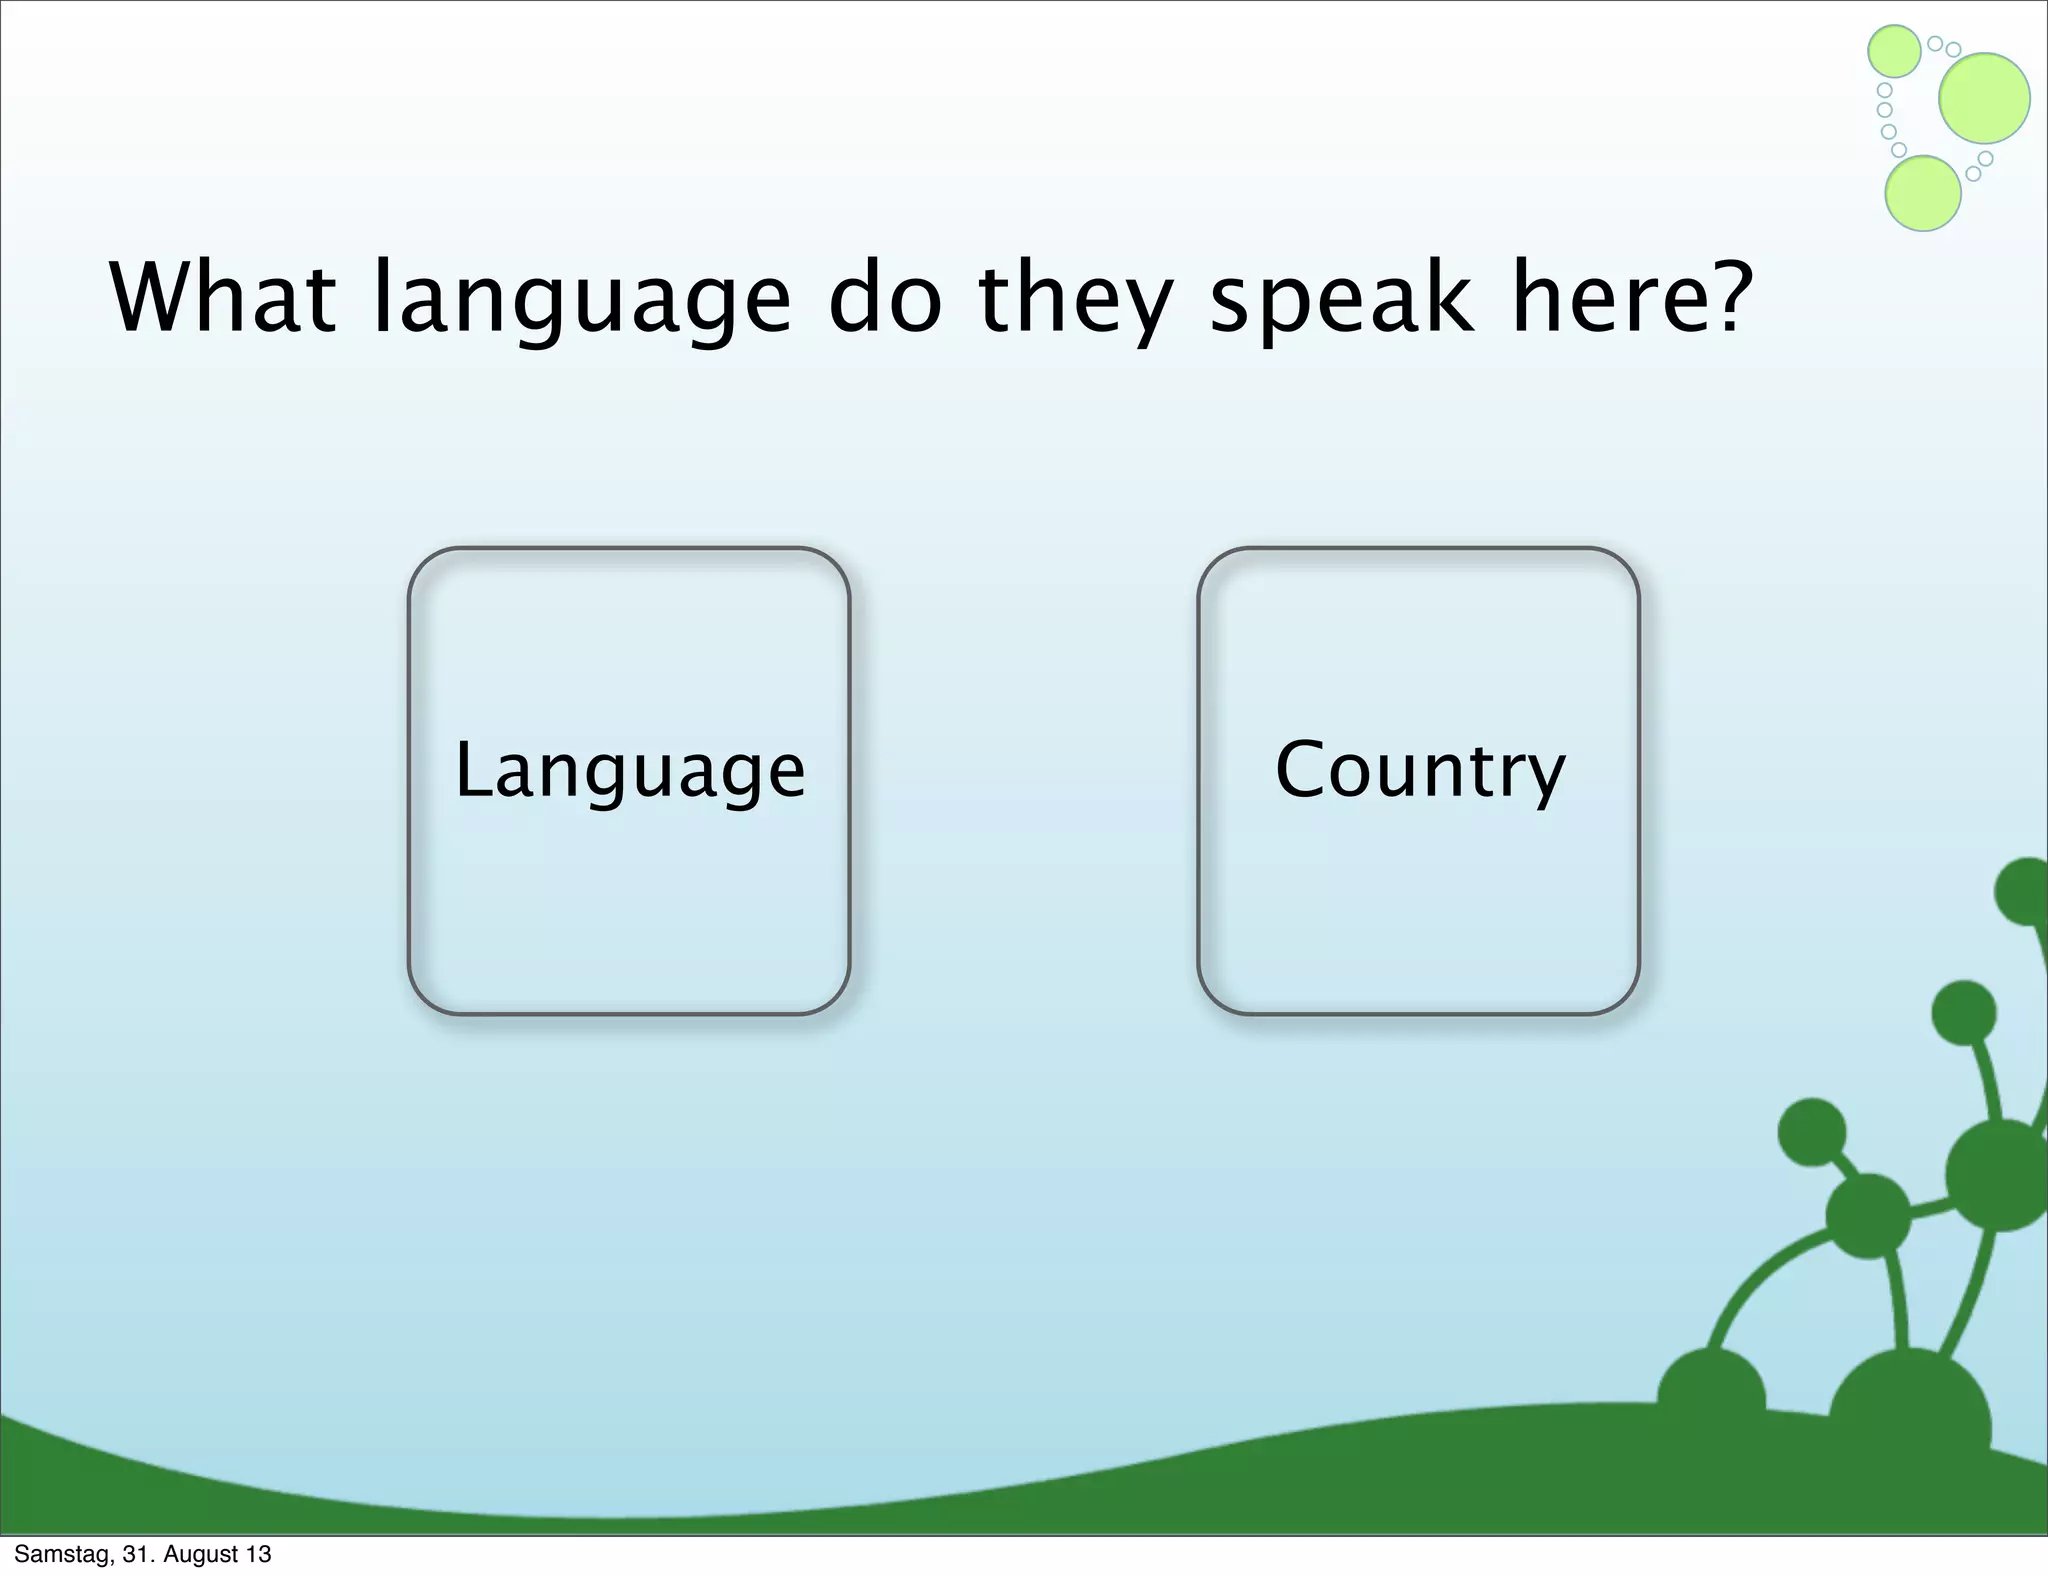
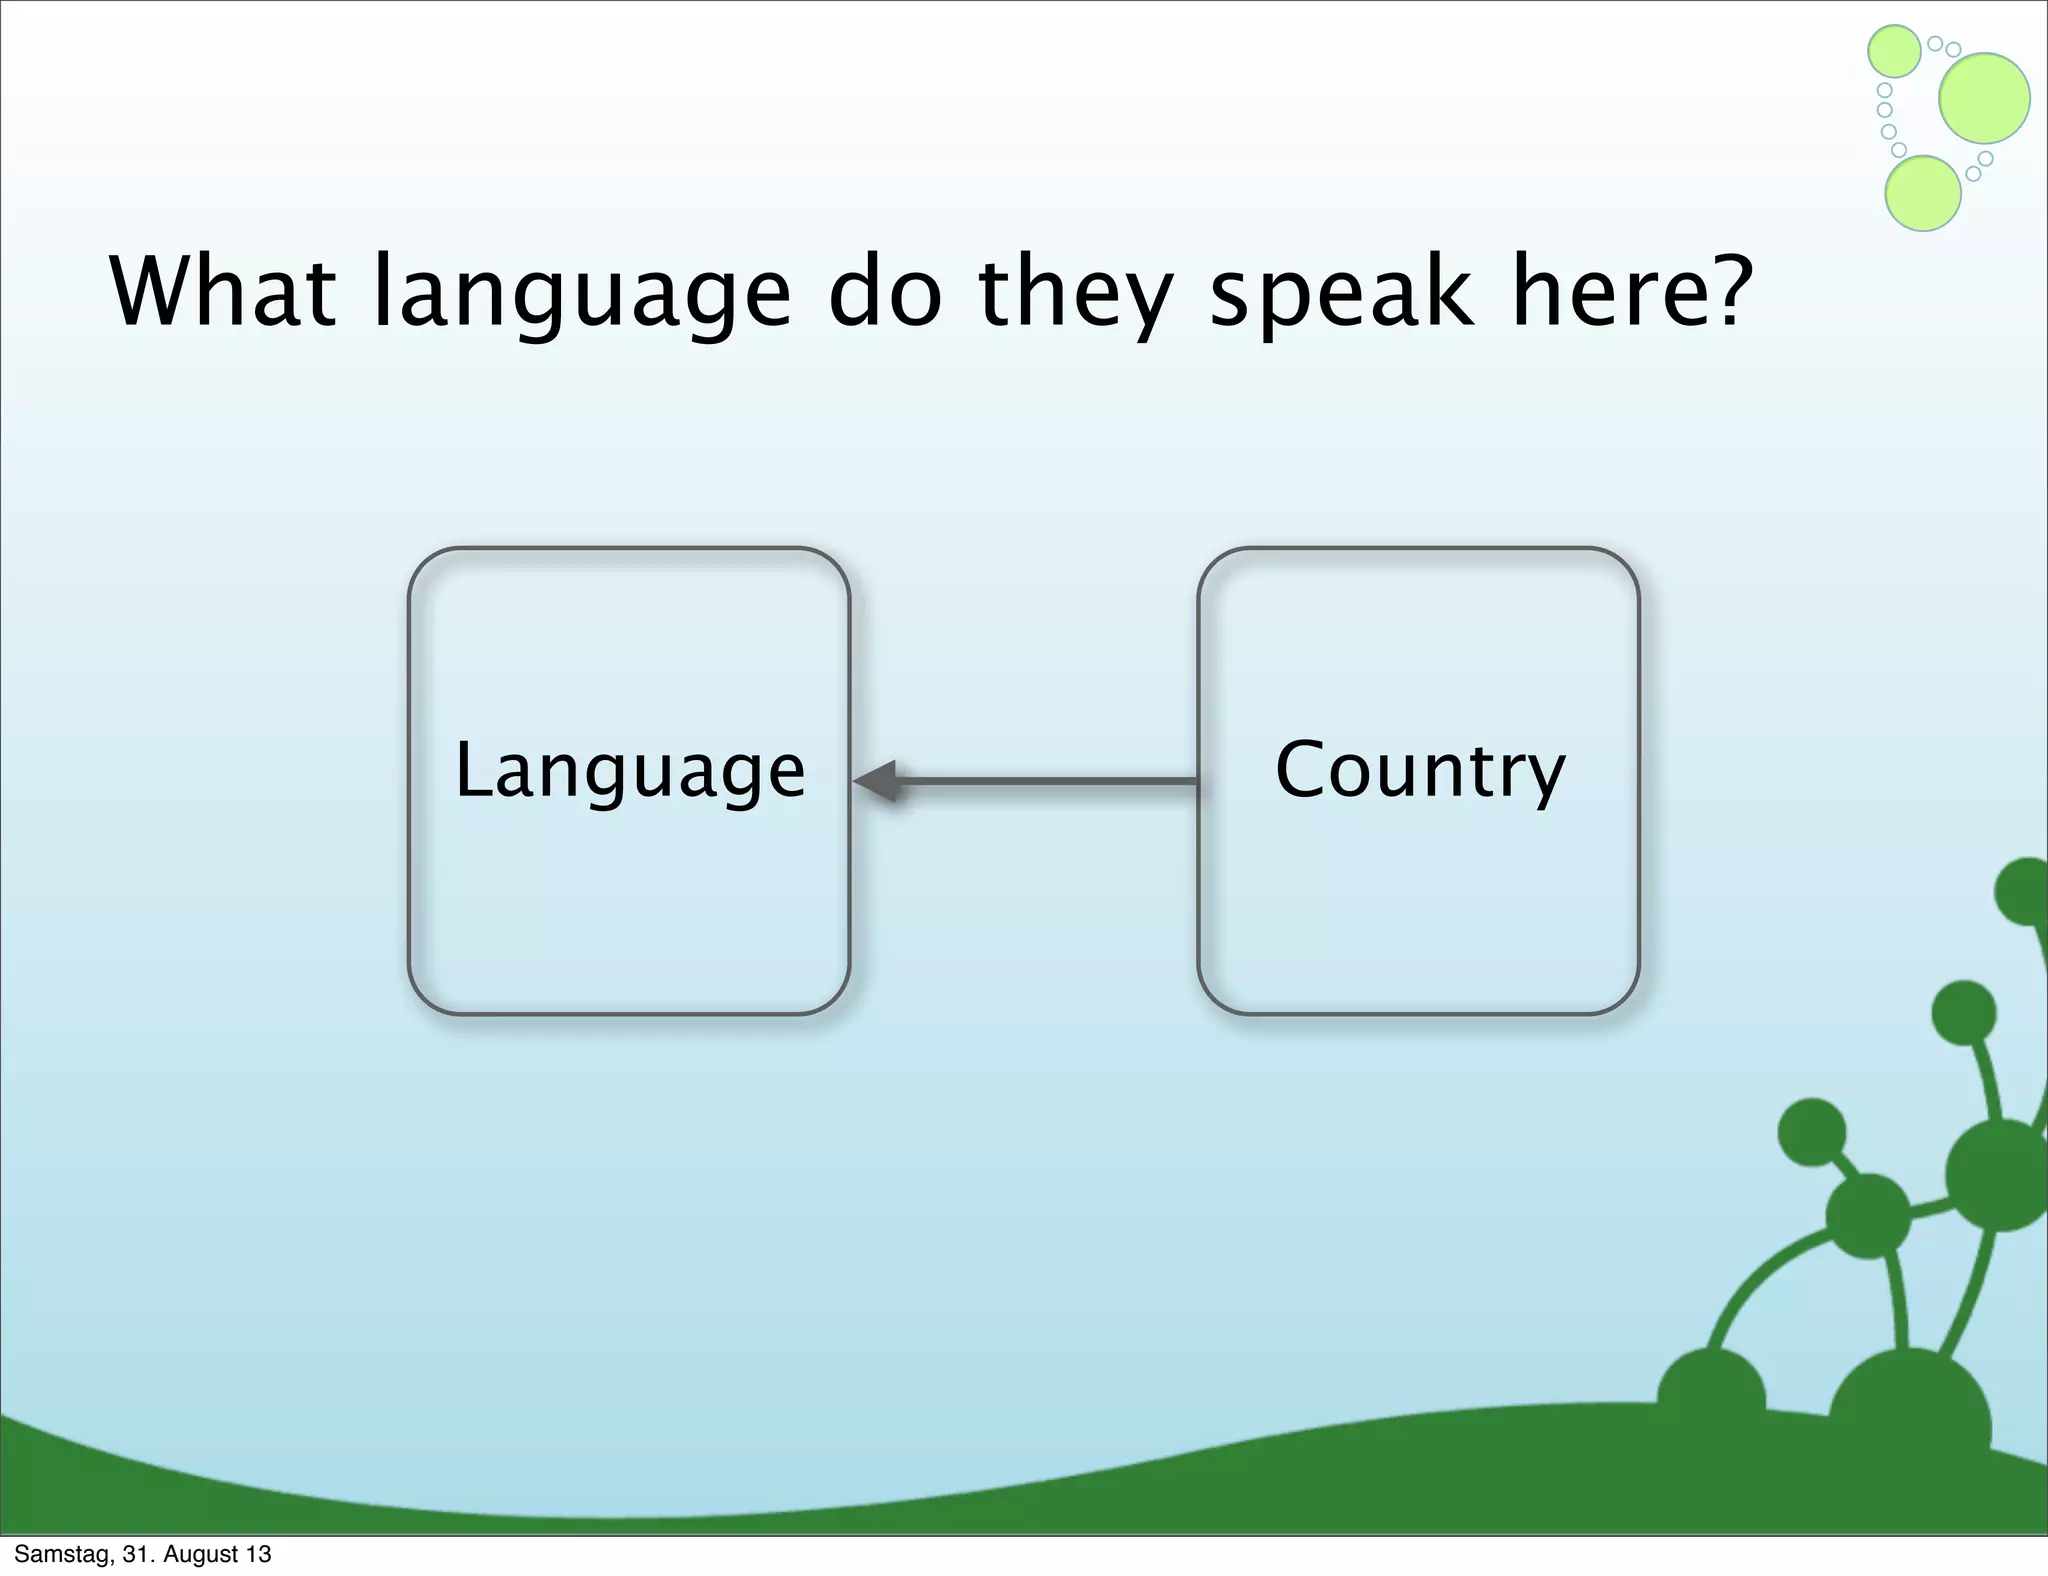
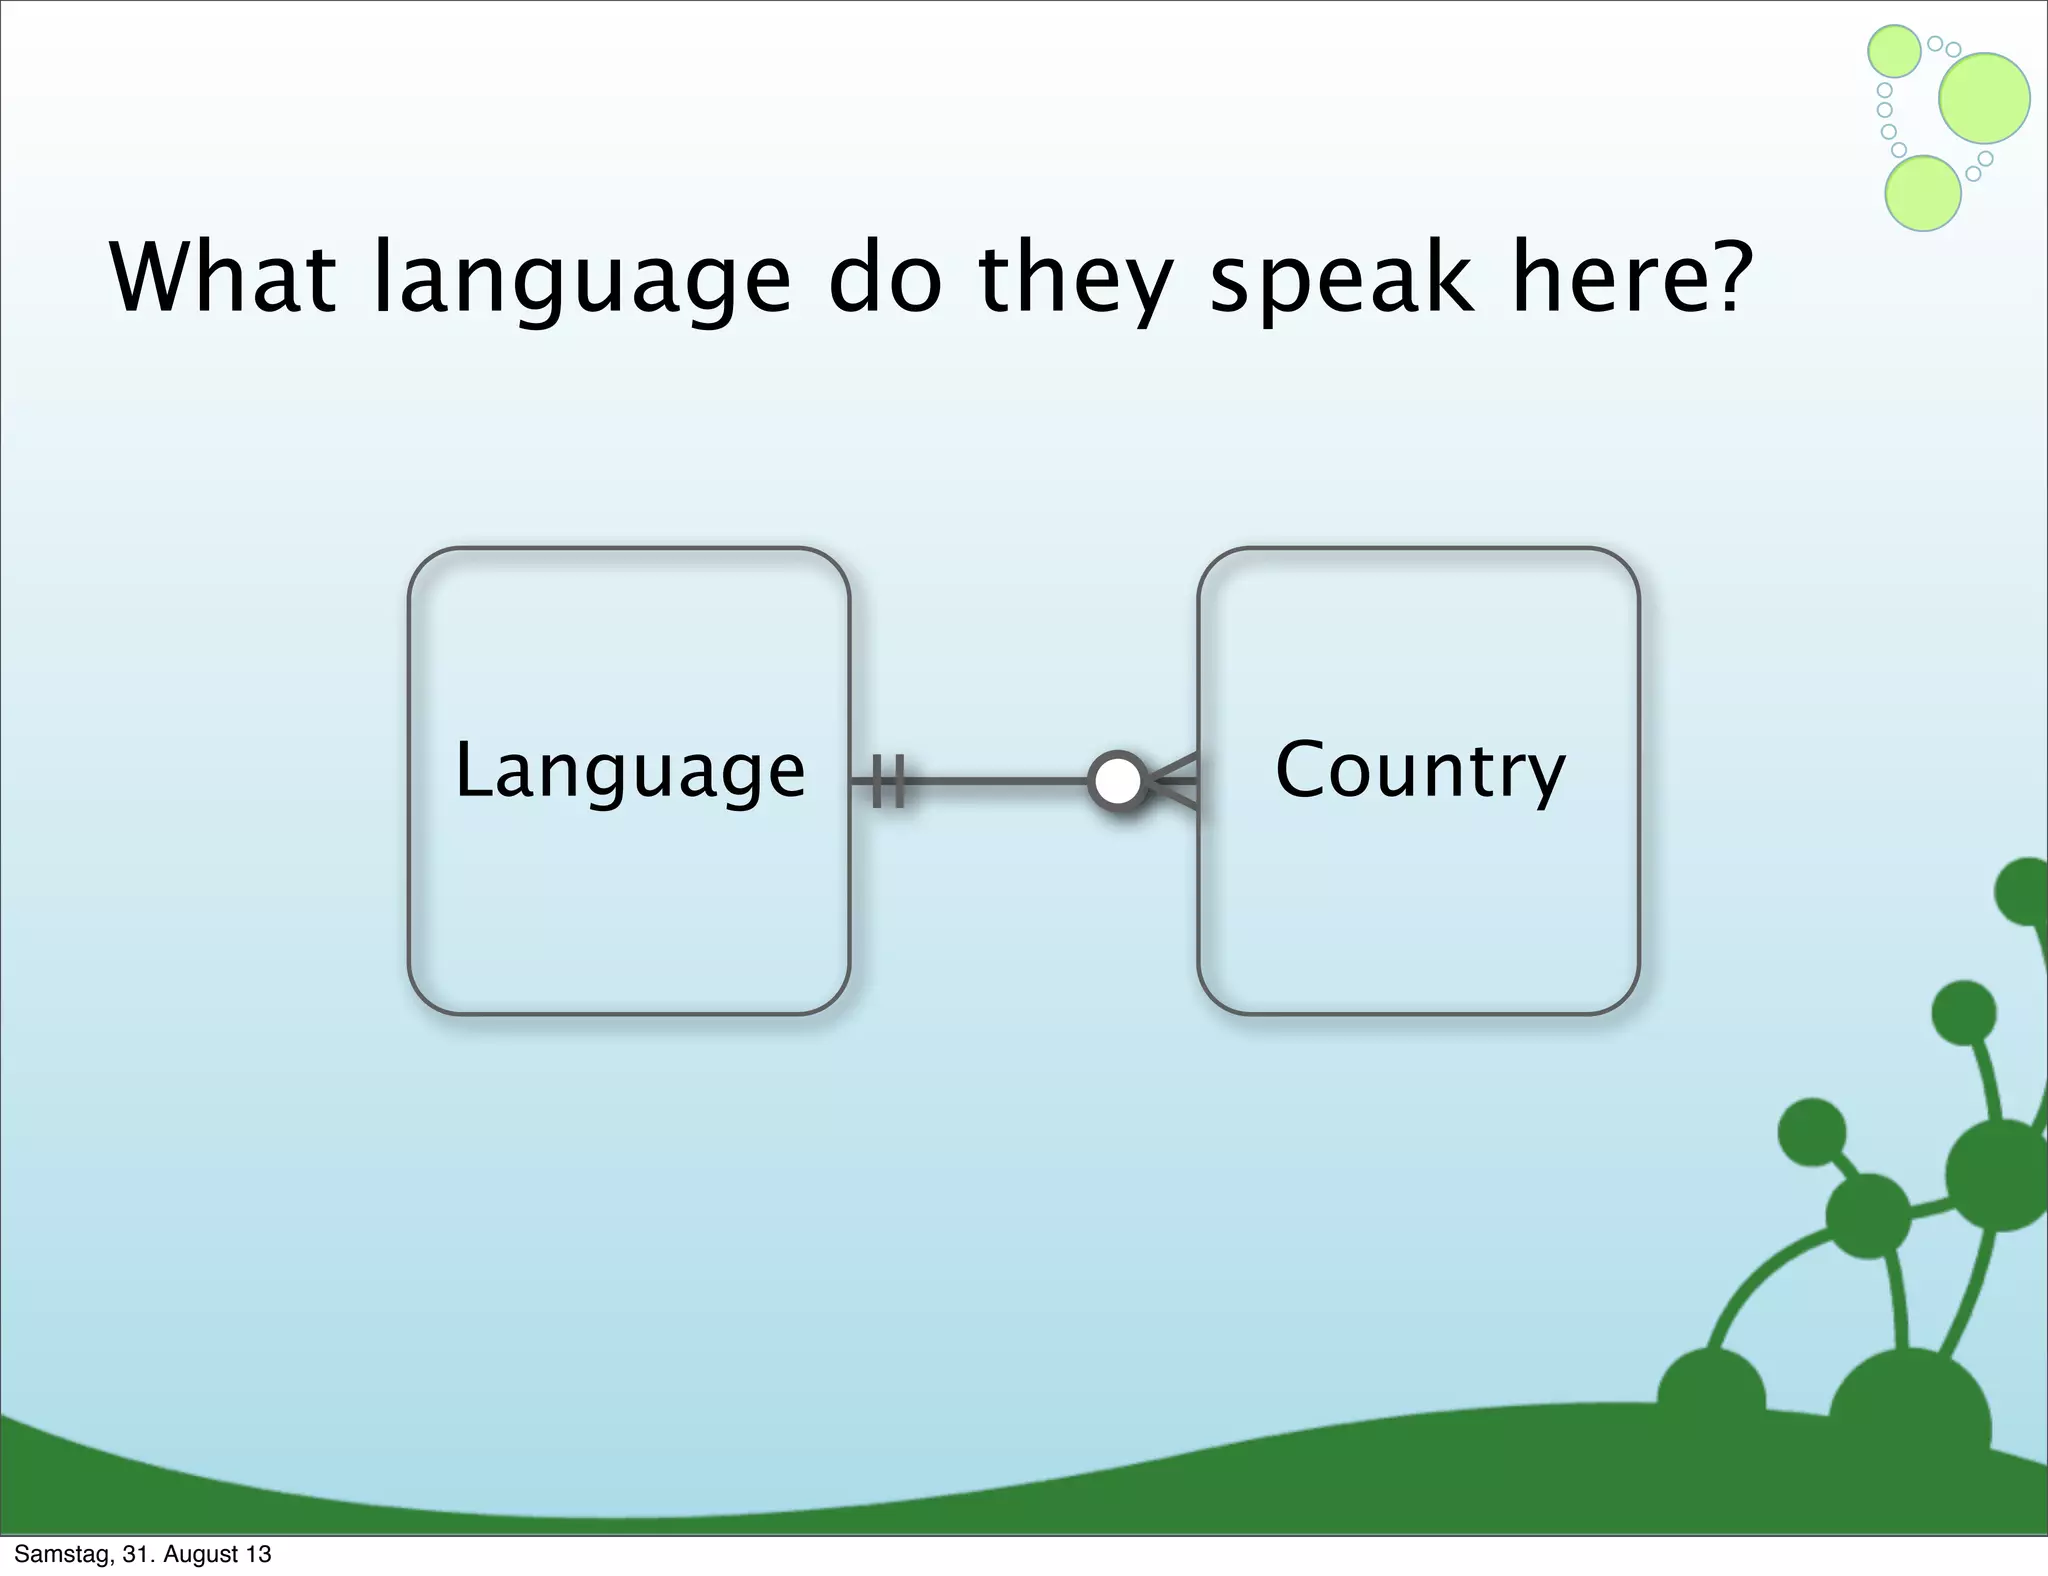
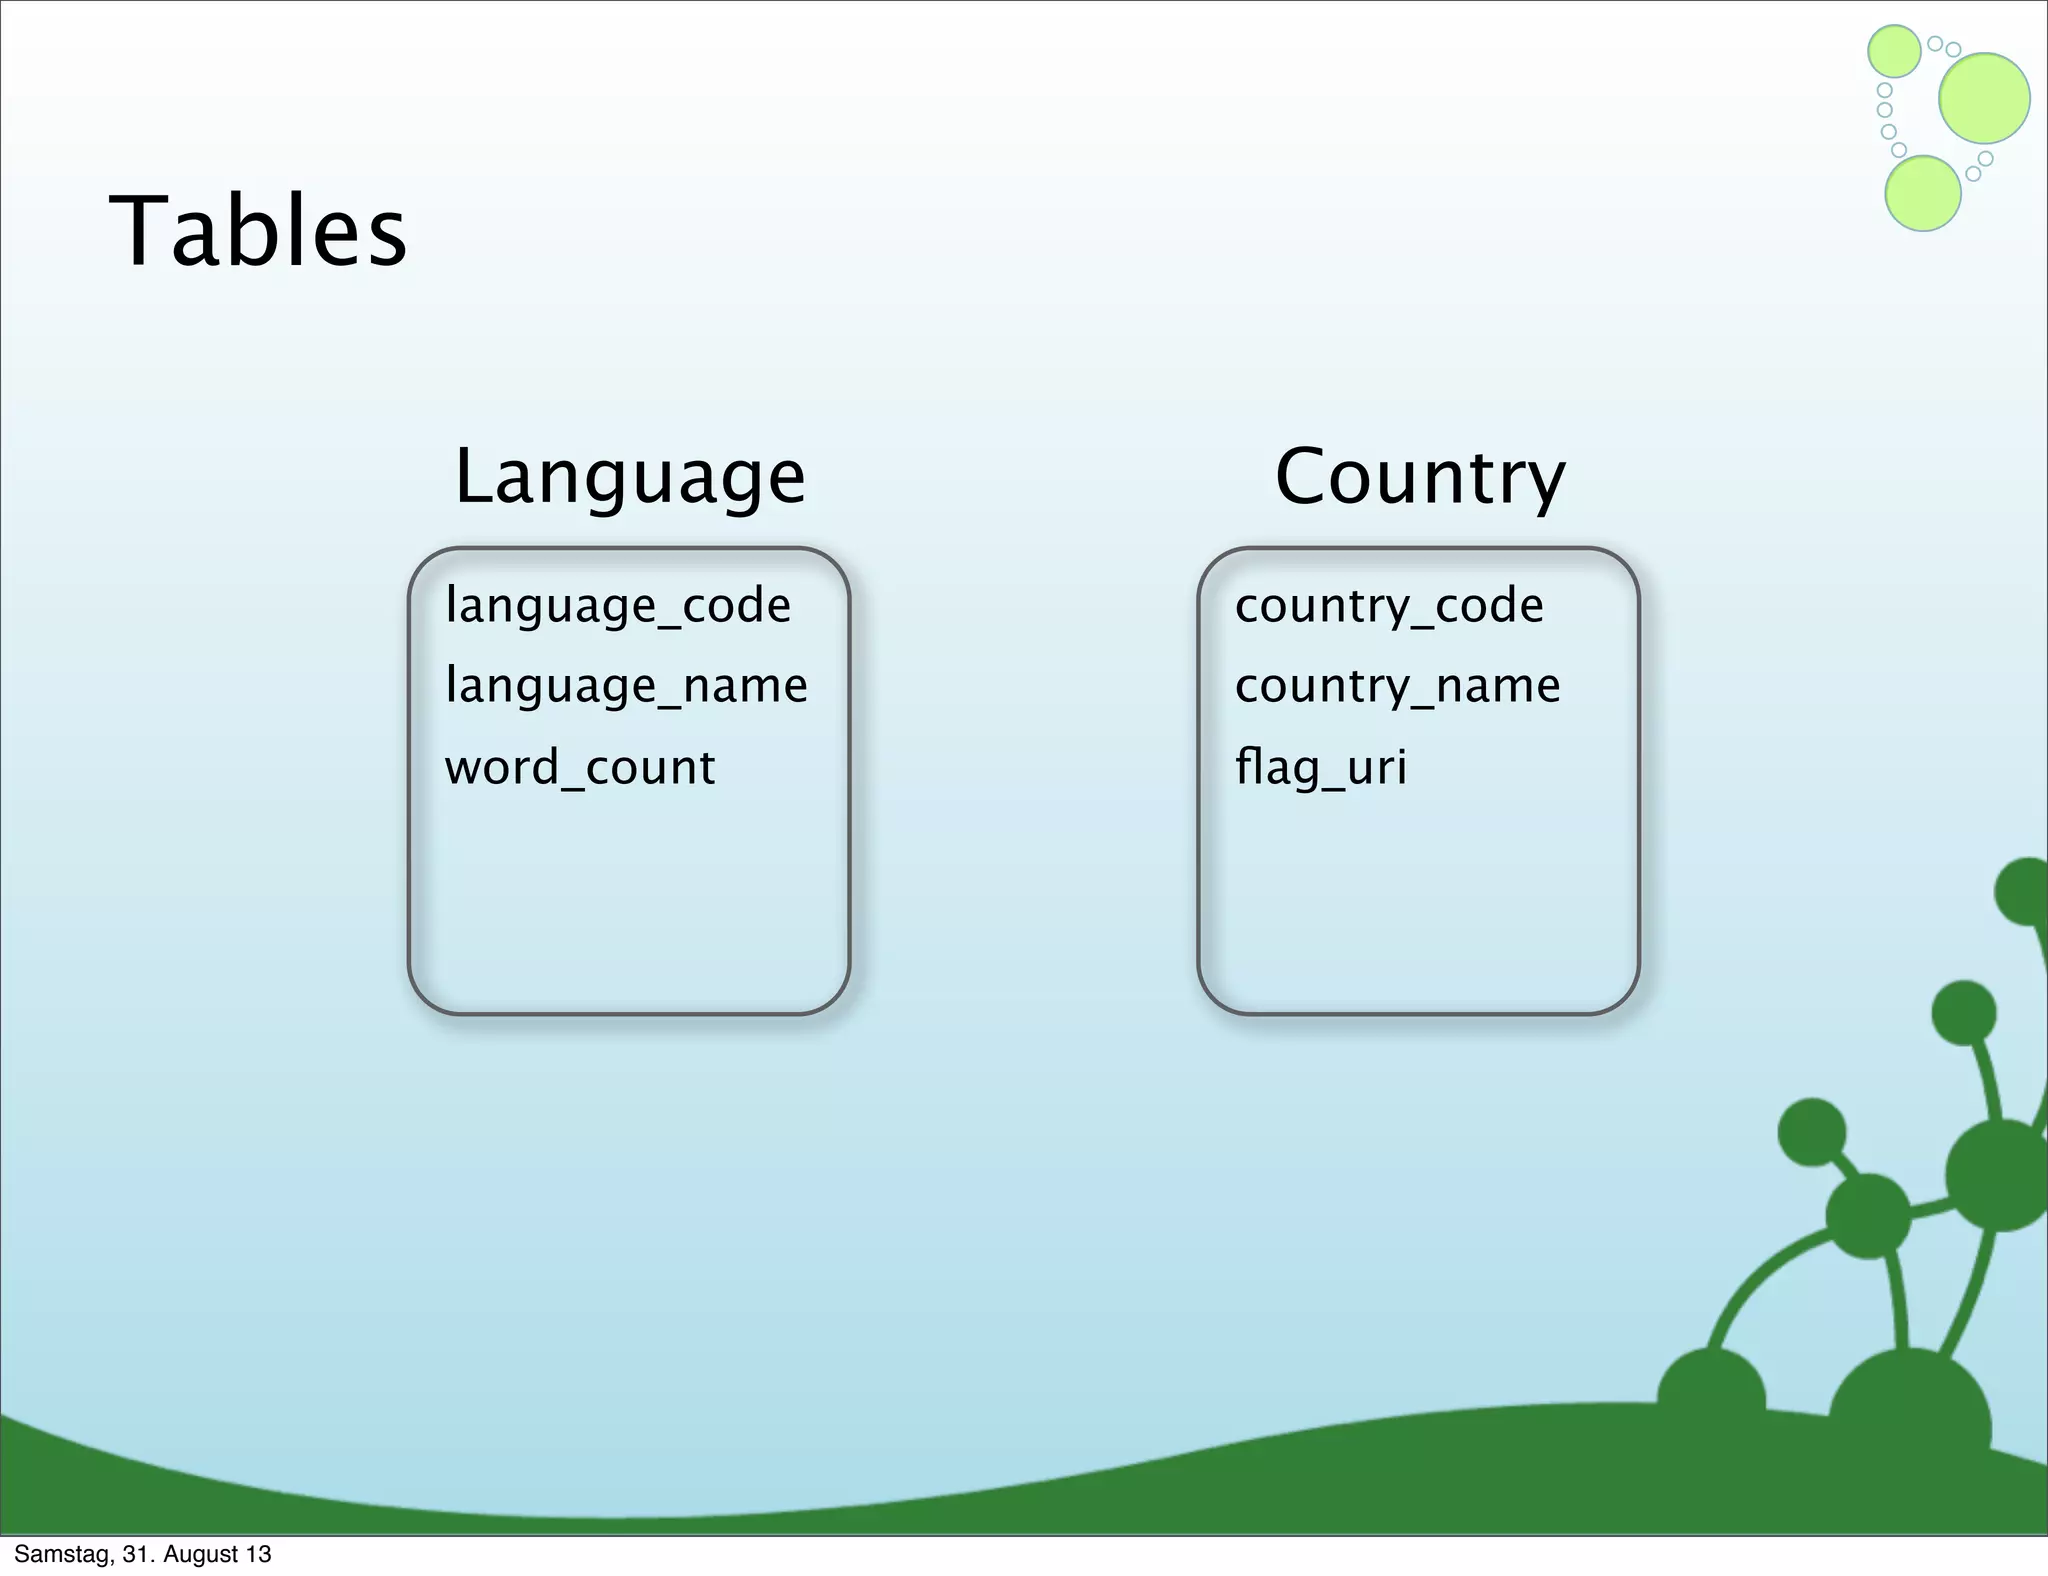
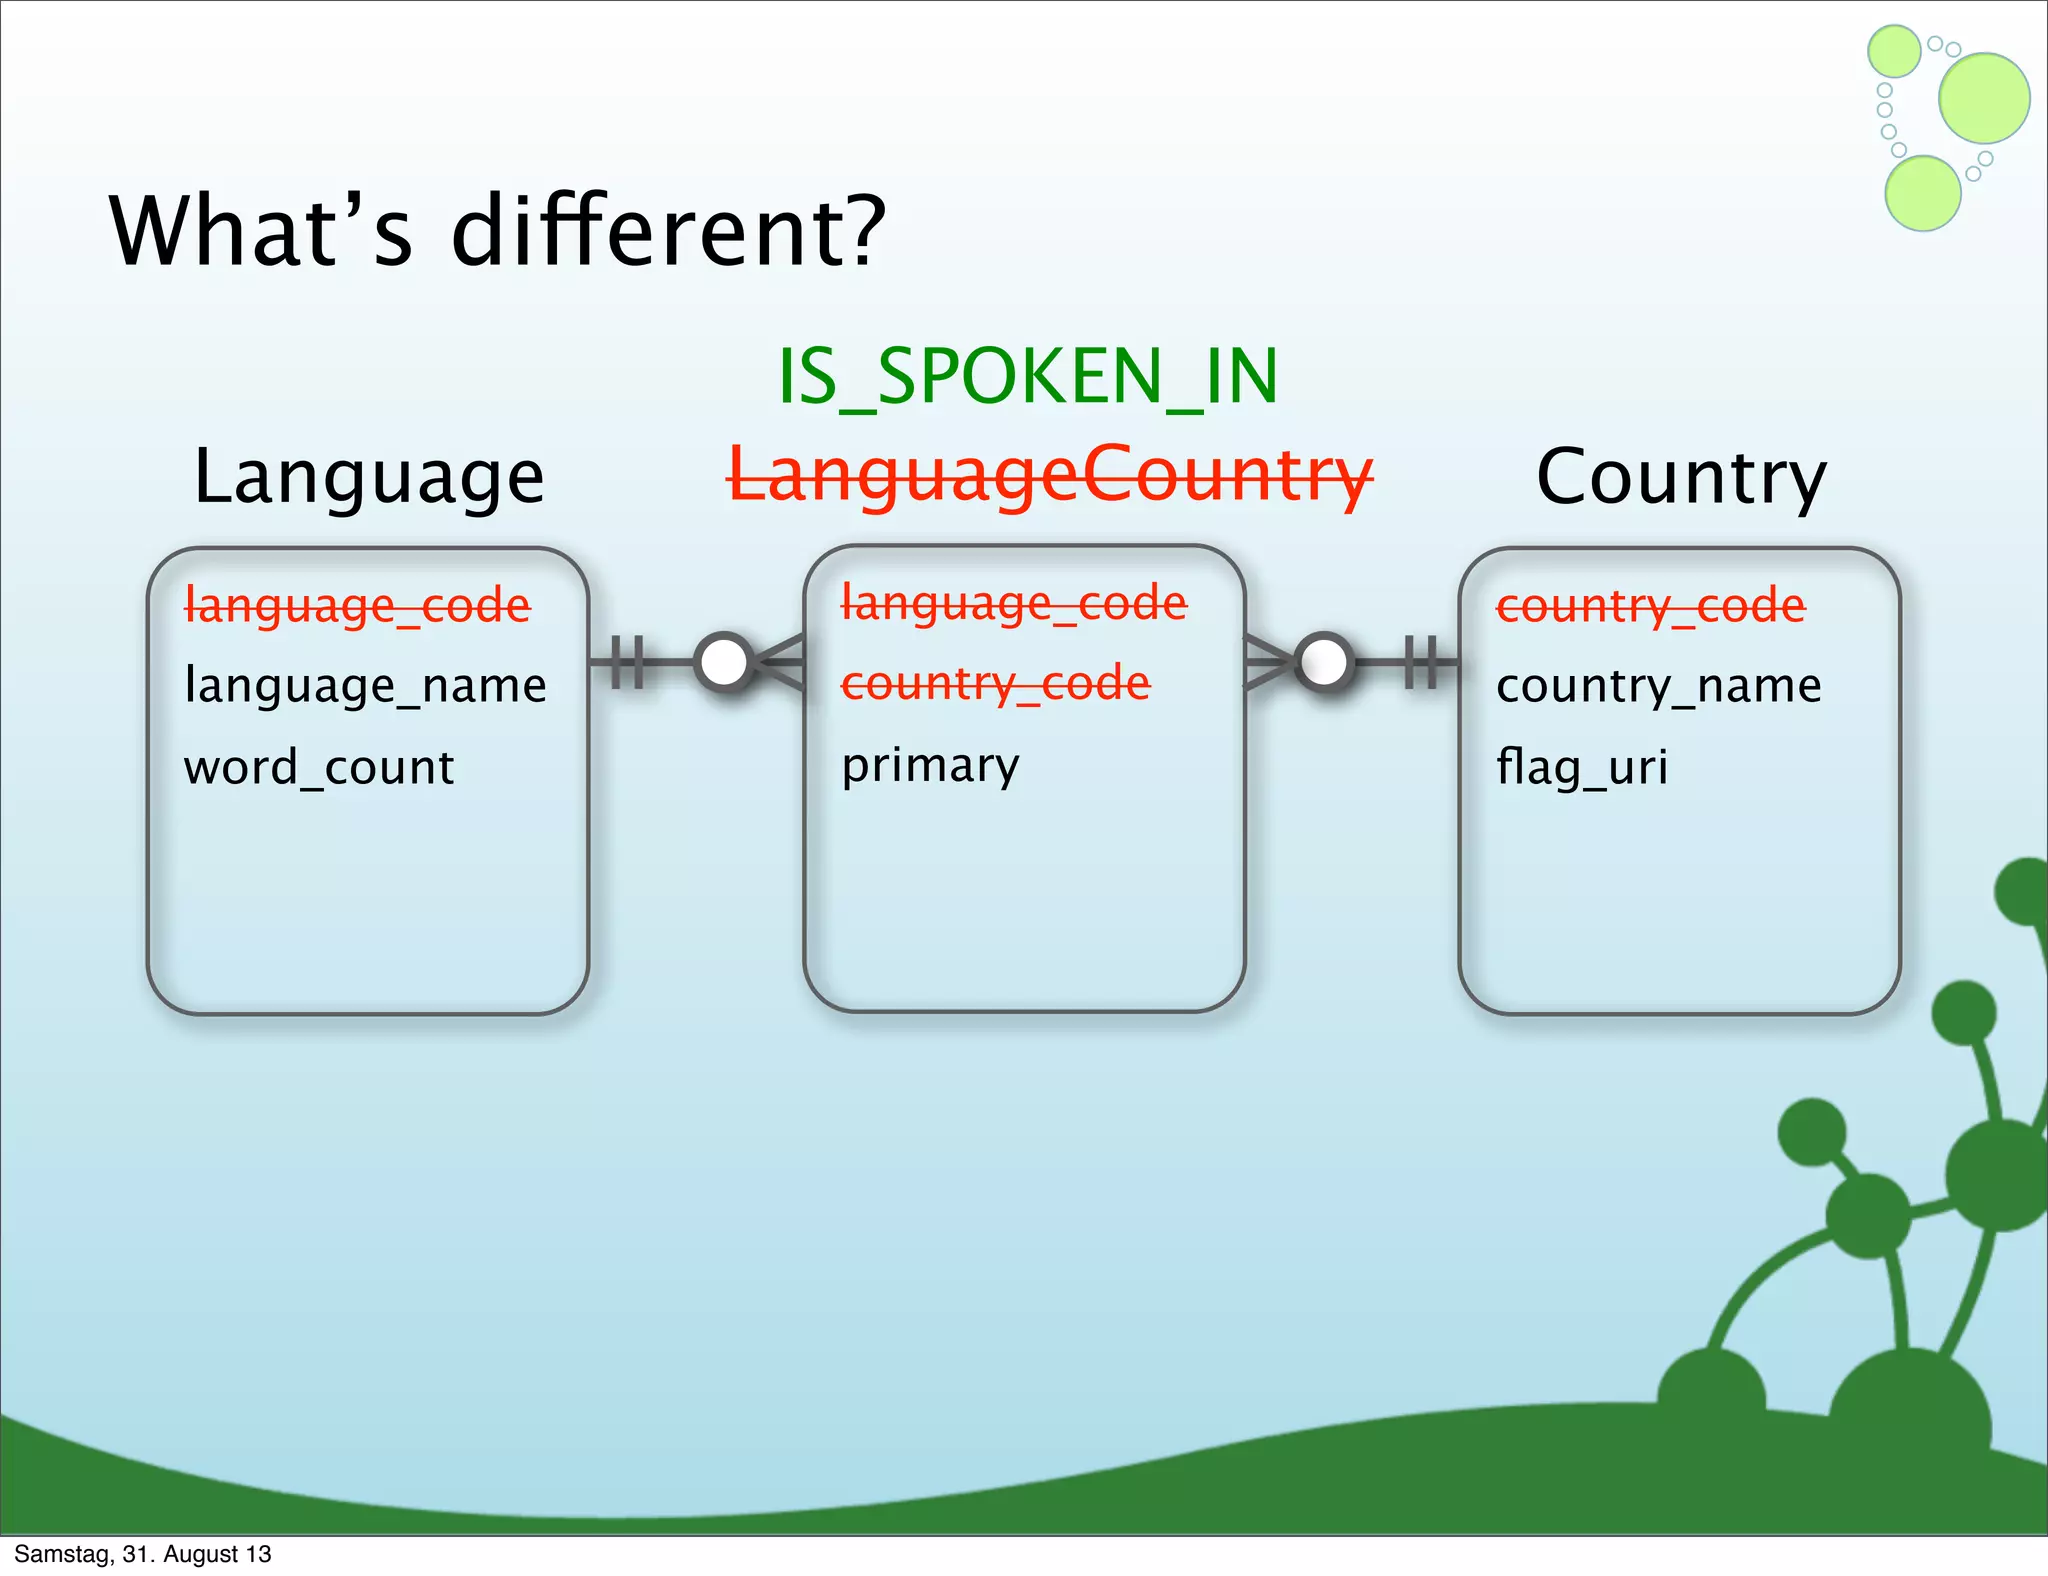
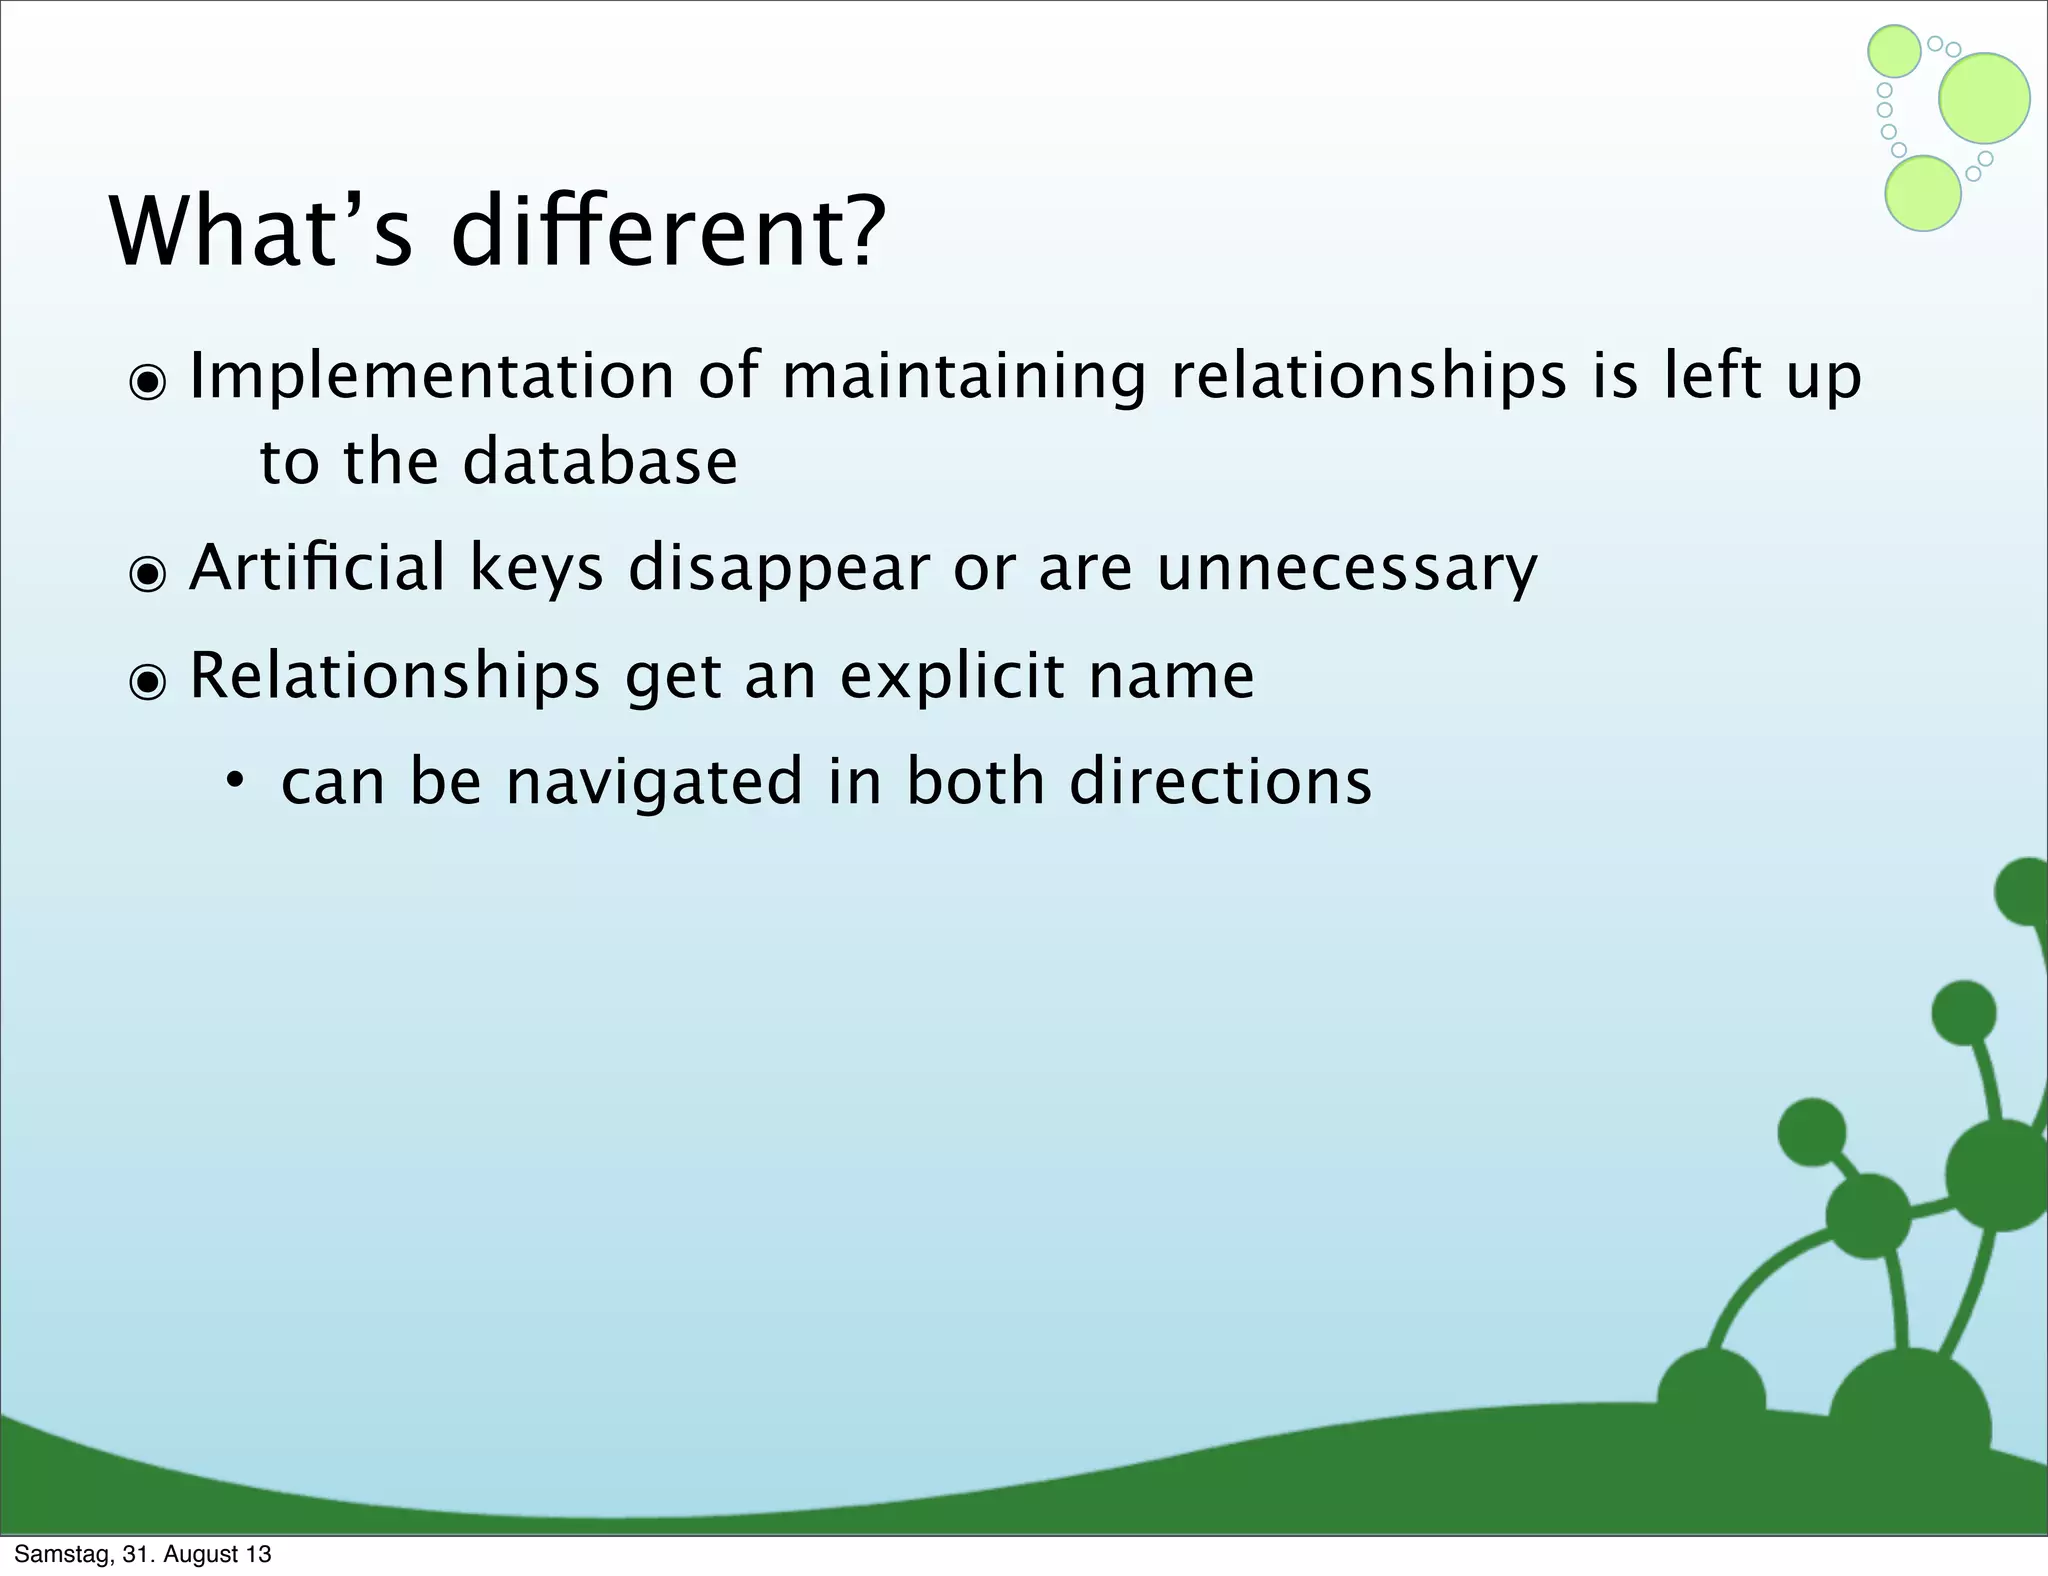
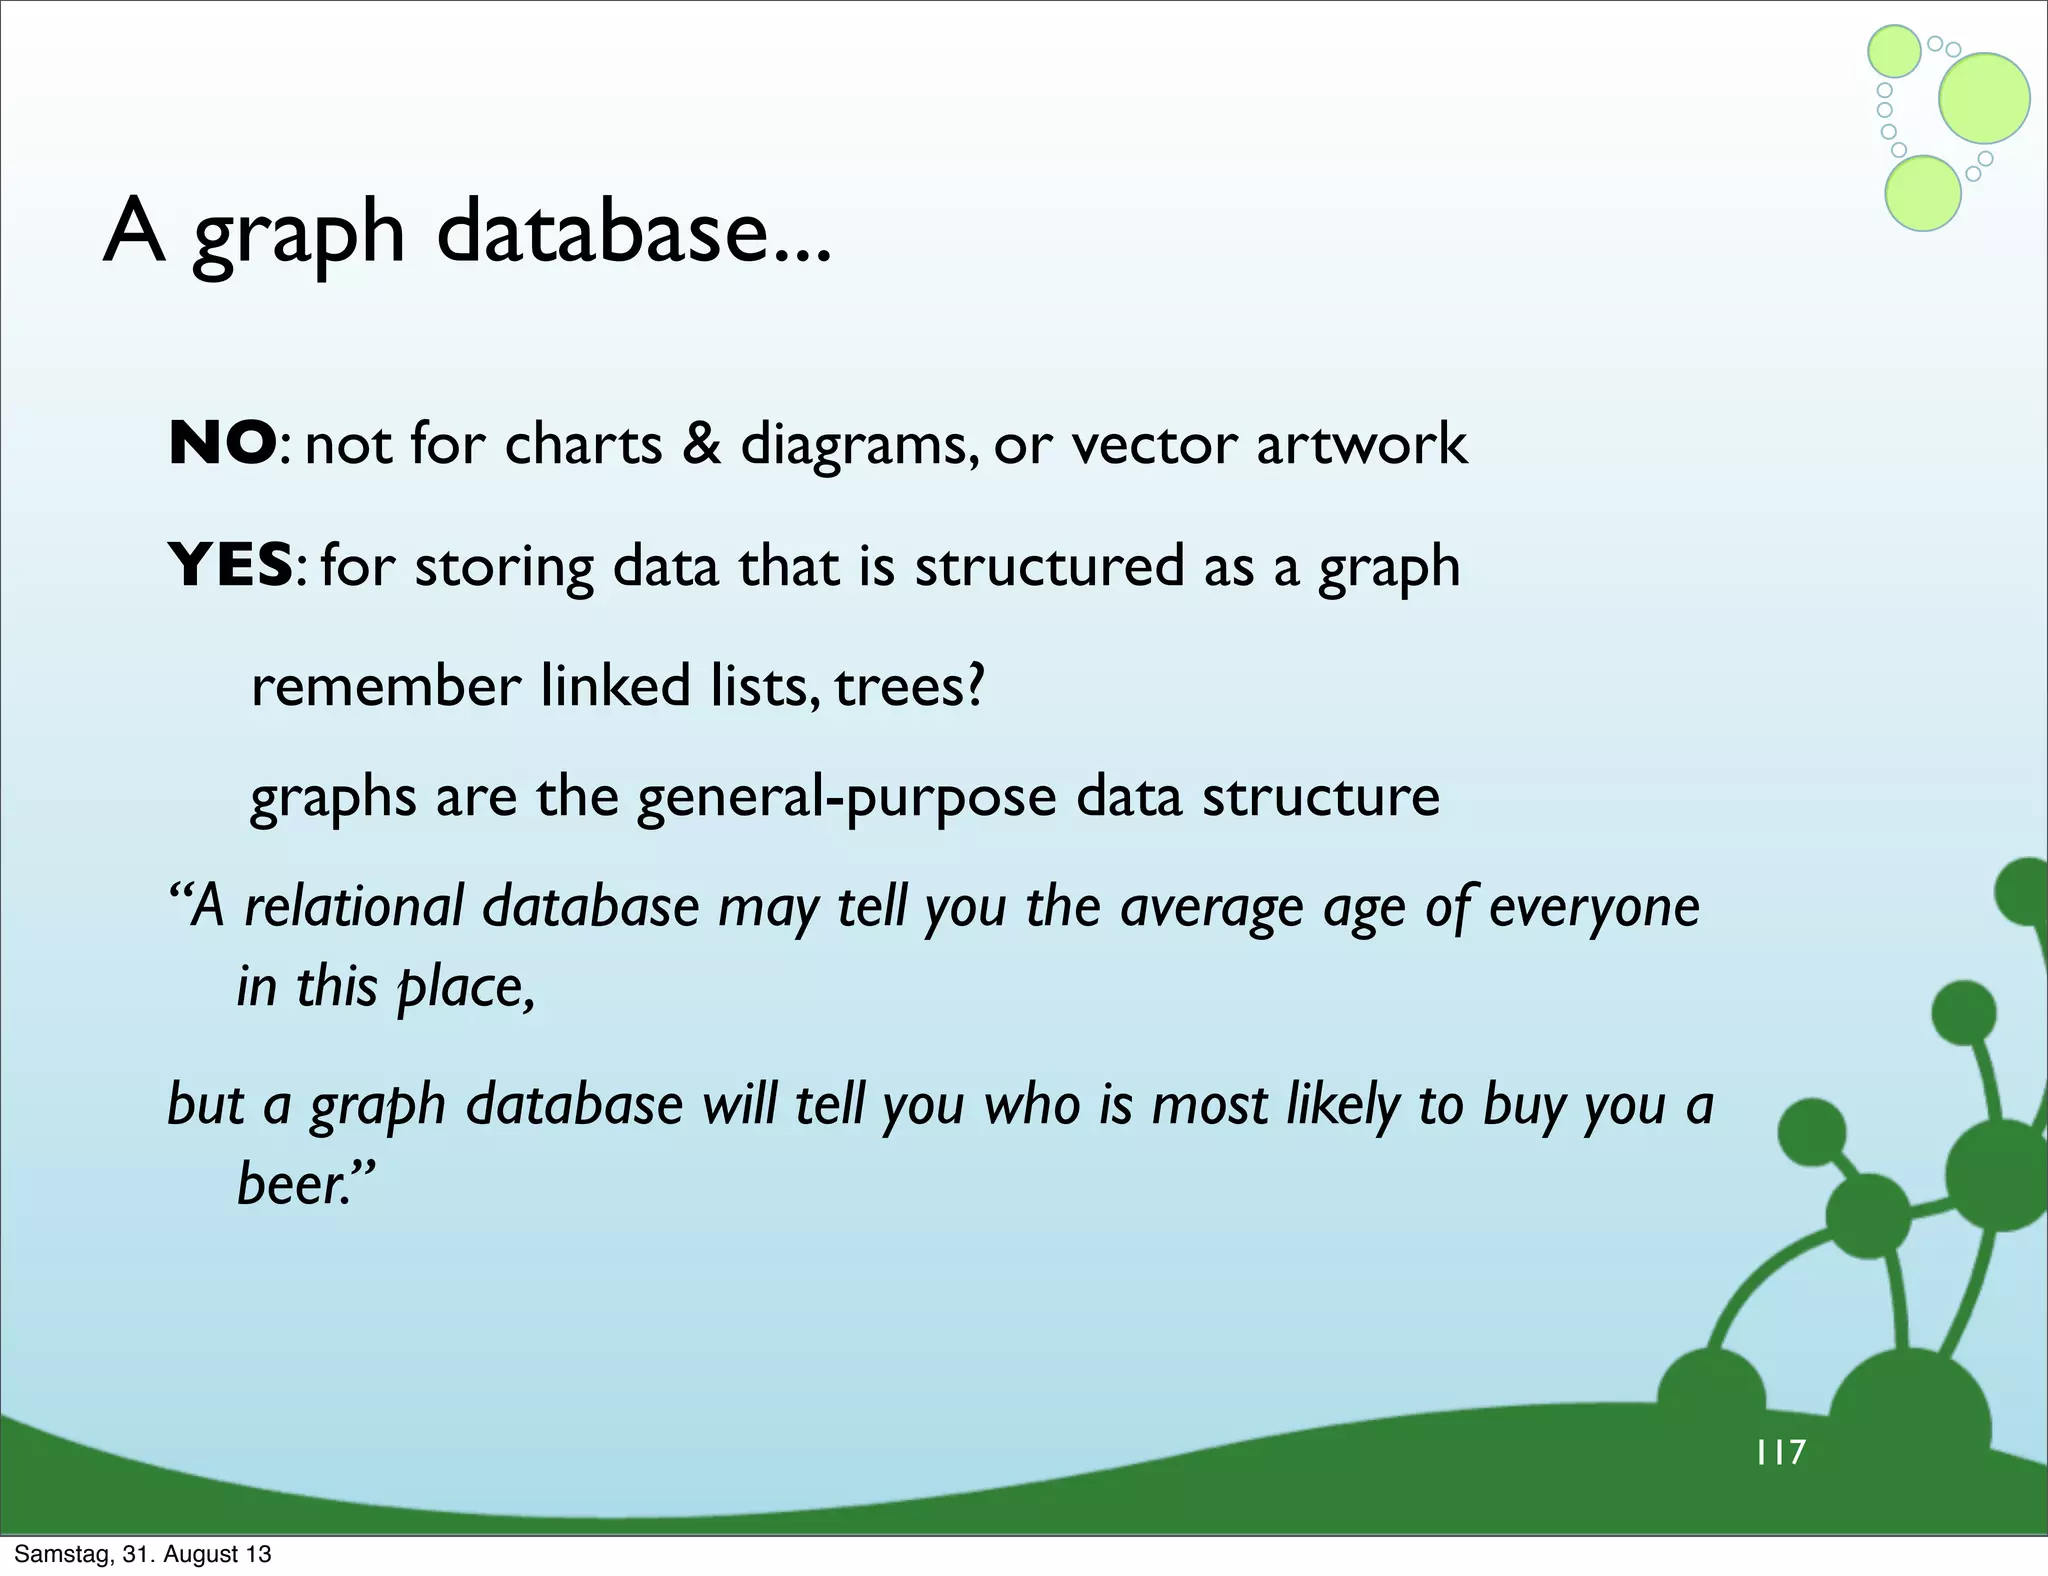
Differences between relational and graph models, emphasizing the latter's flexibility and suitability for complex data.
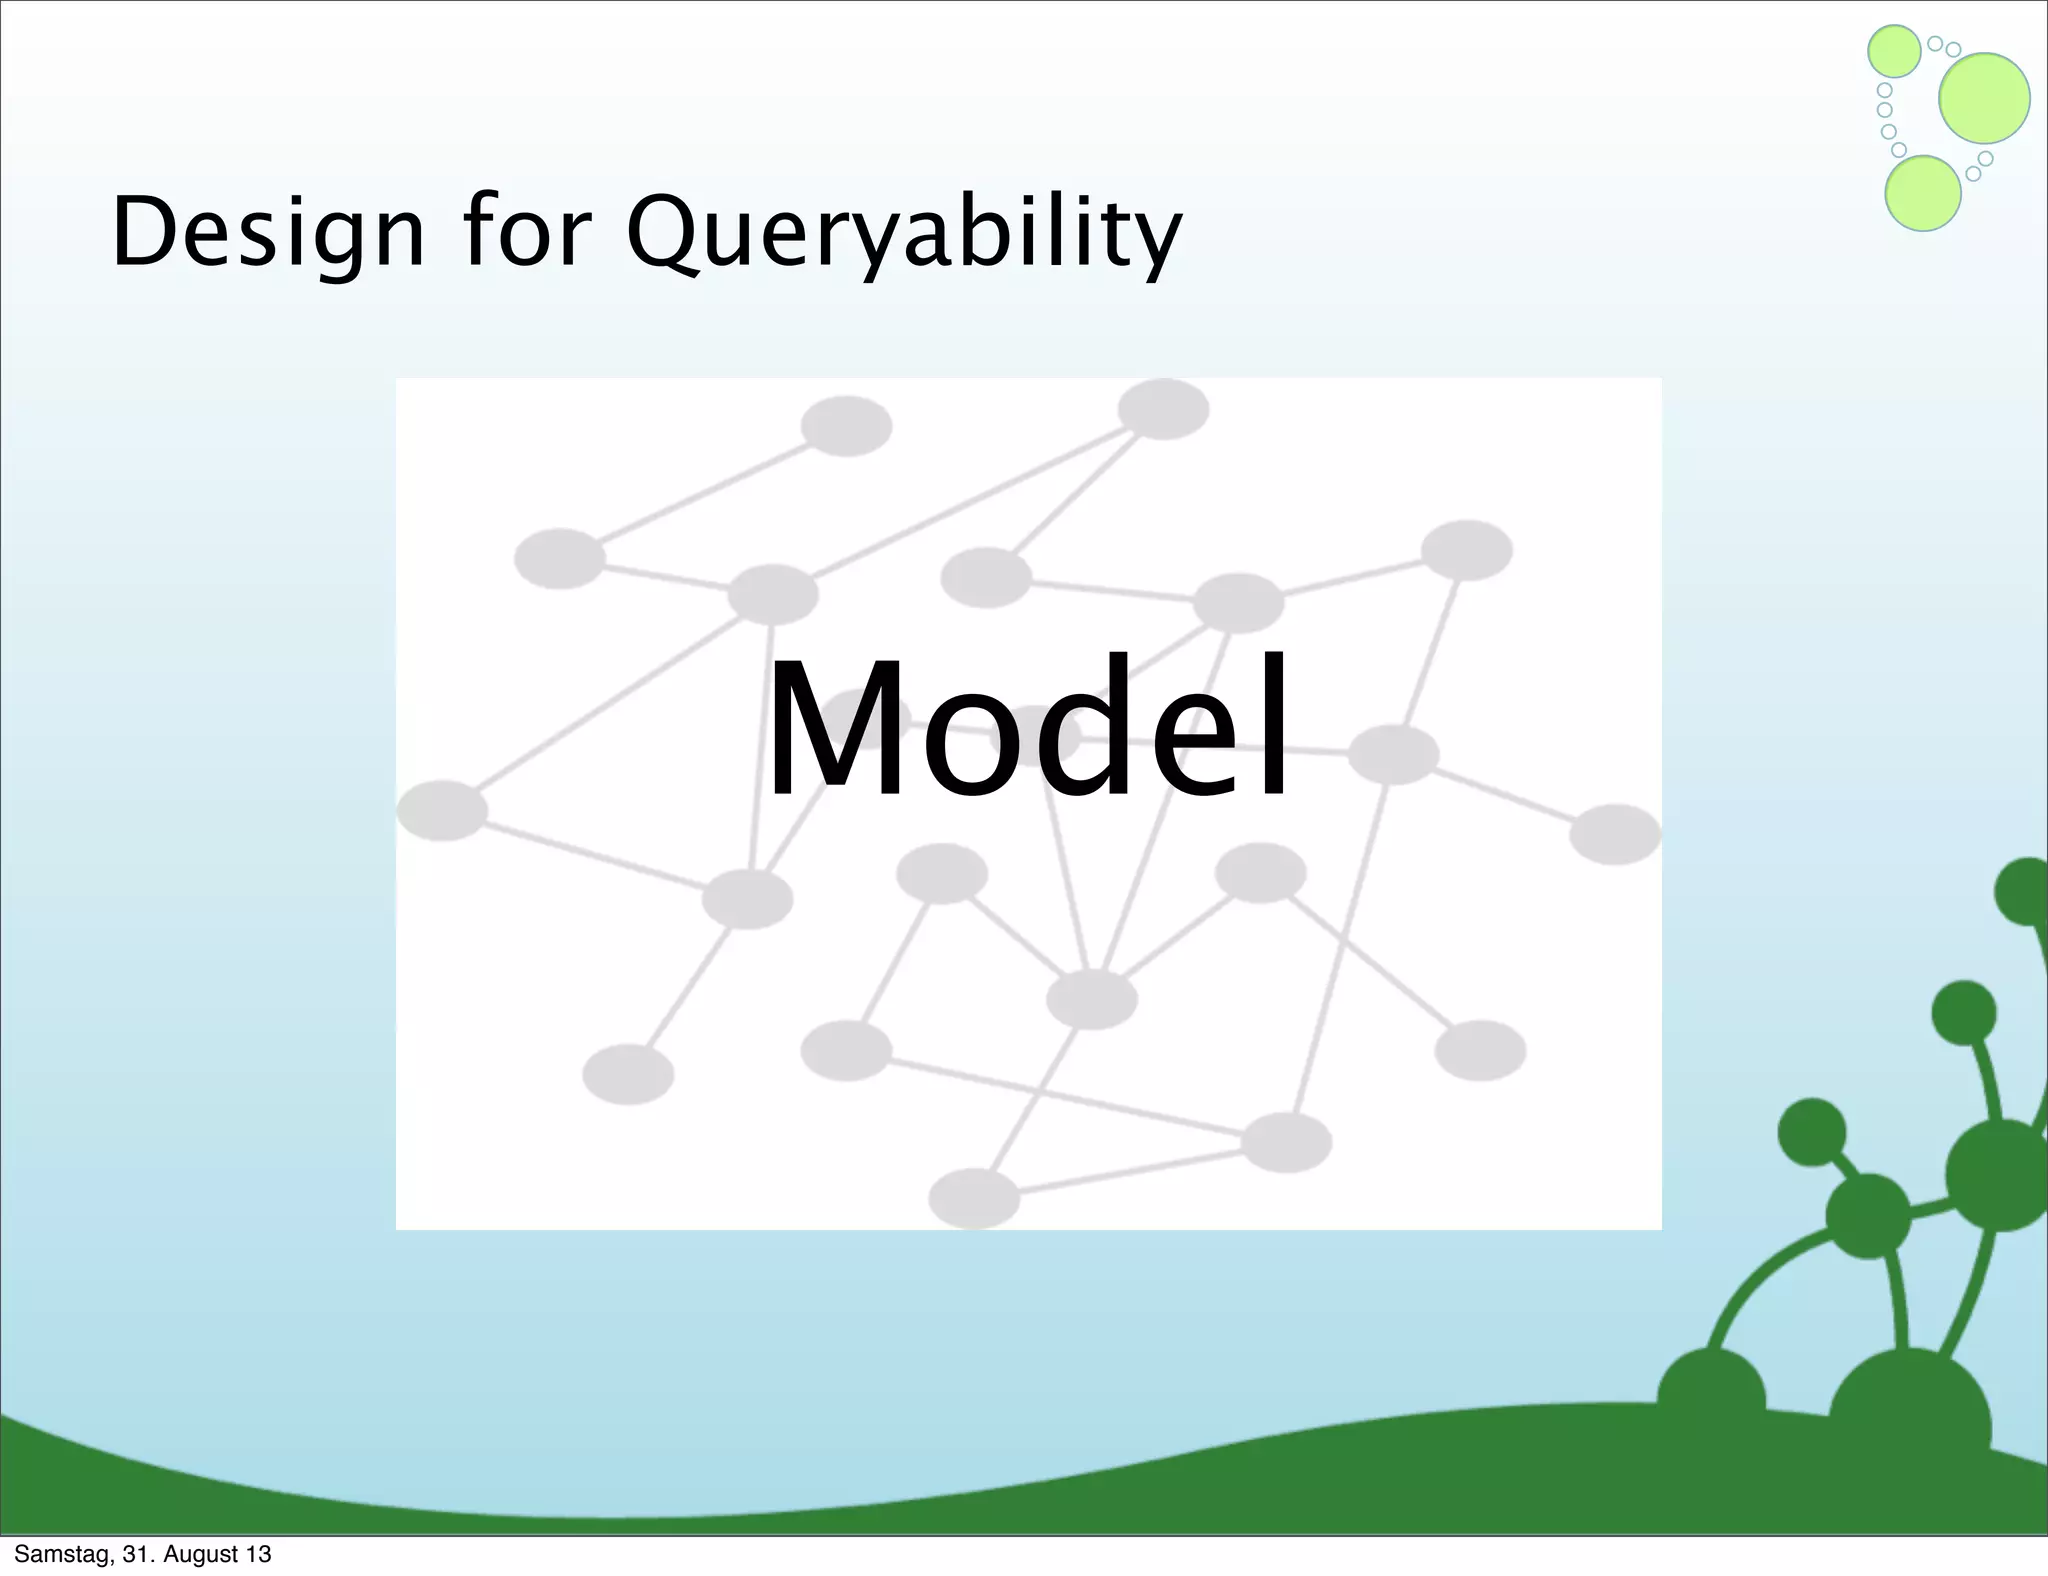
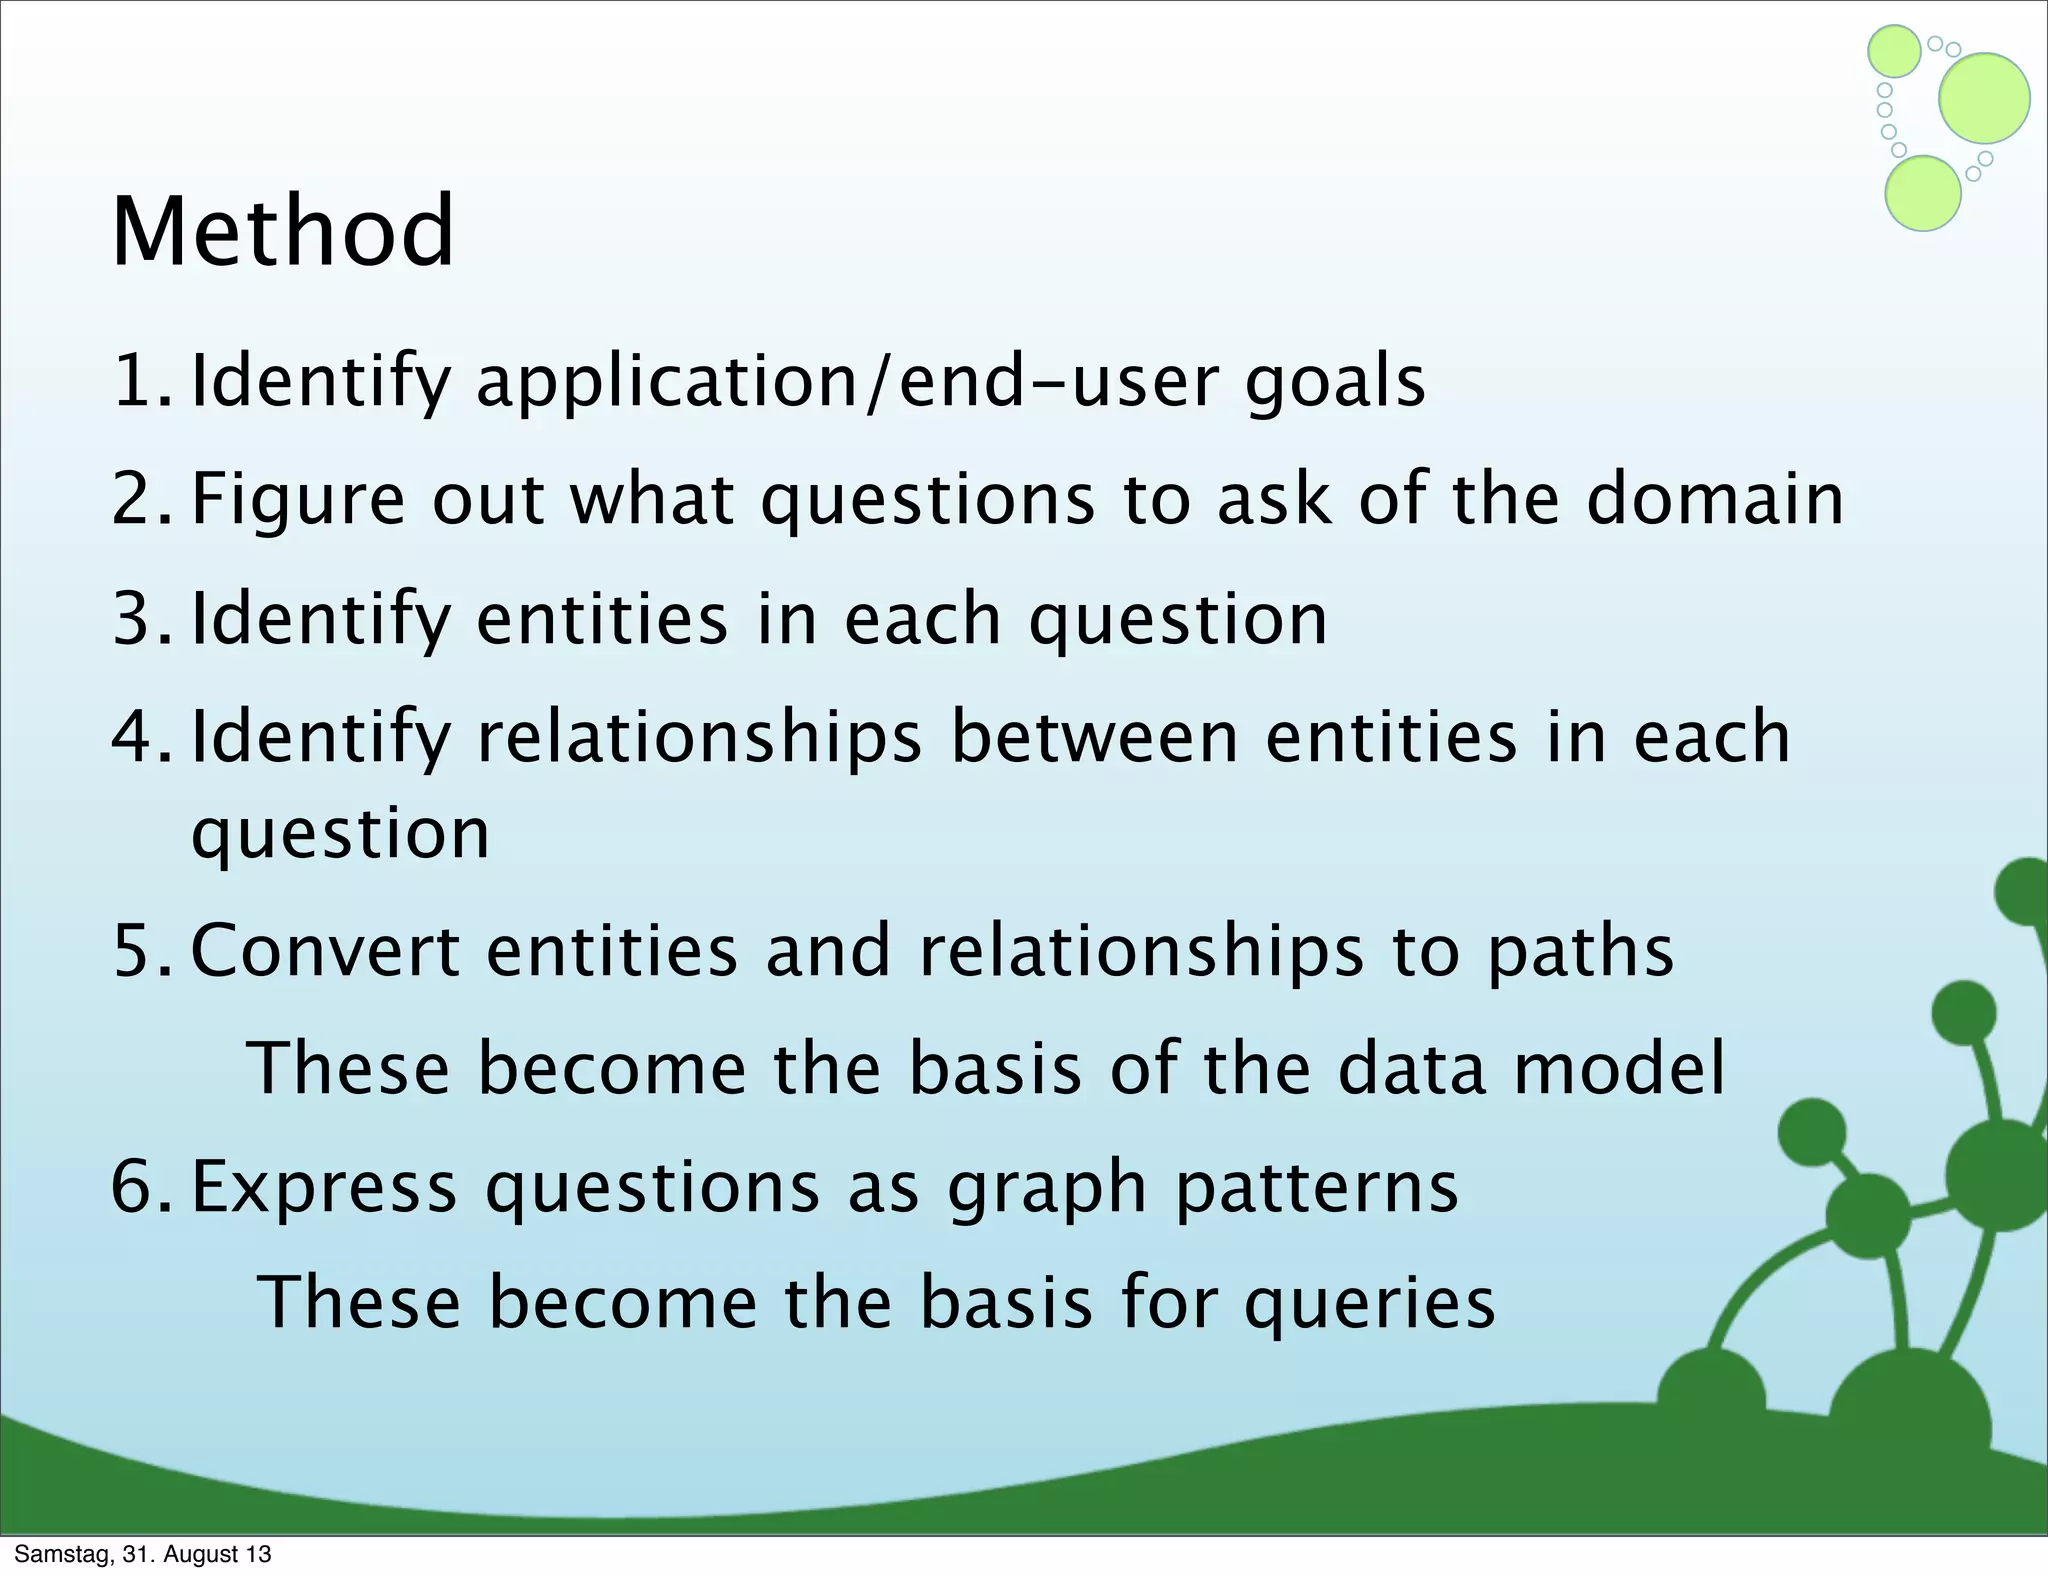
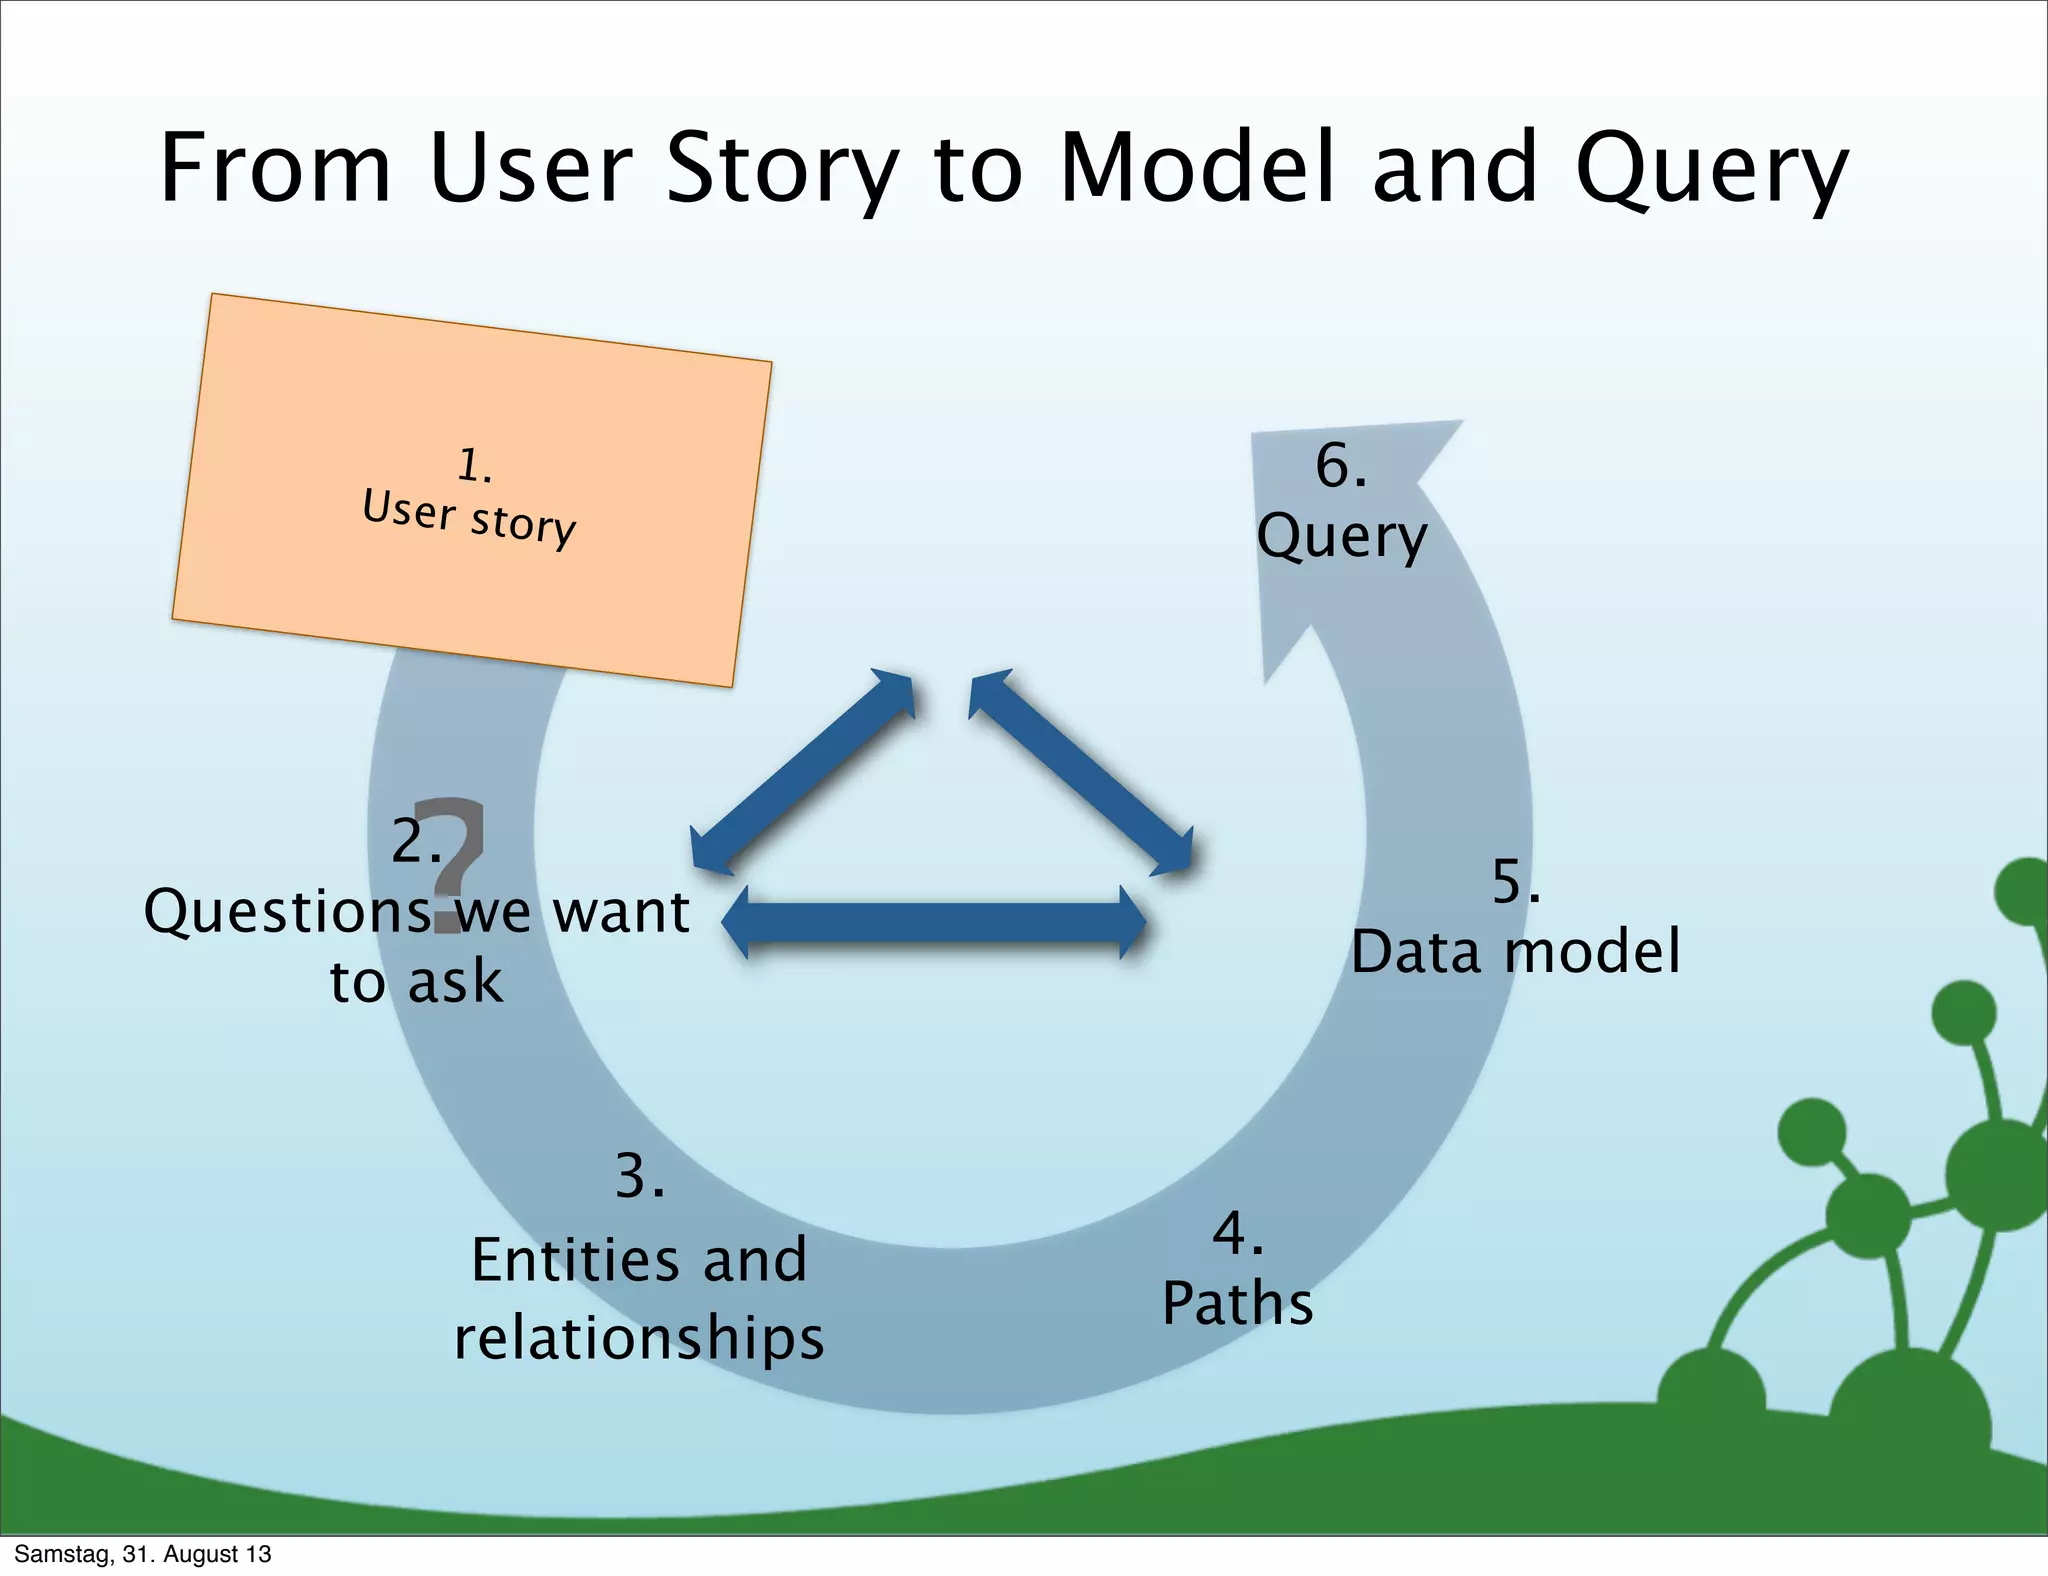
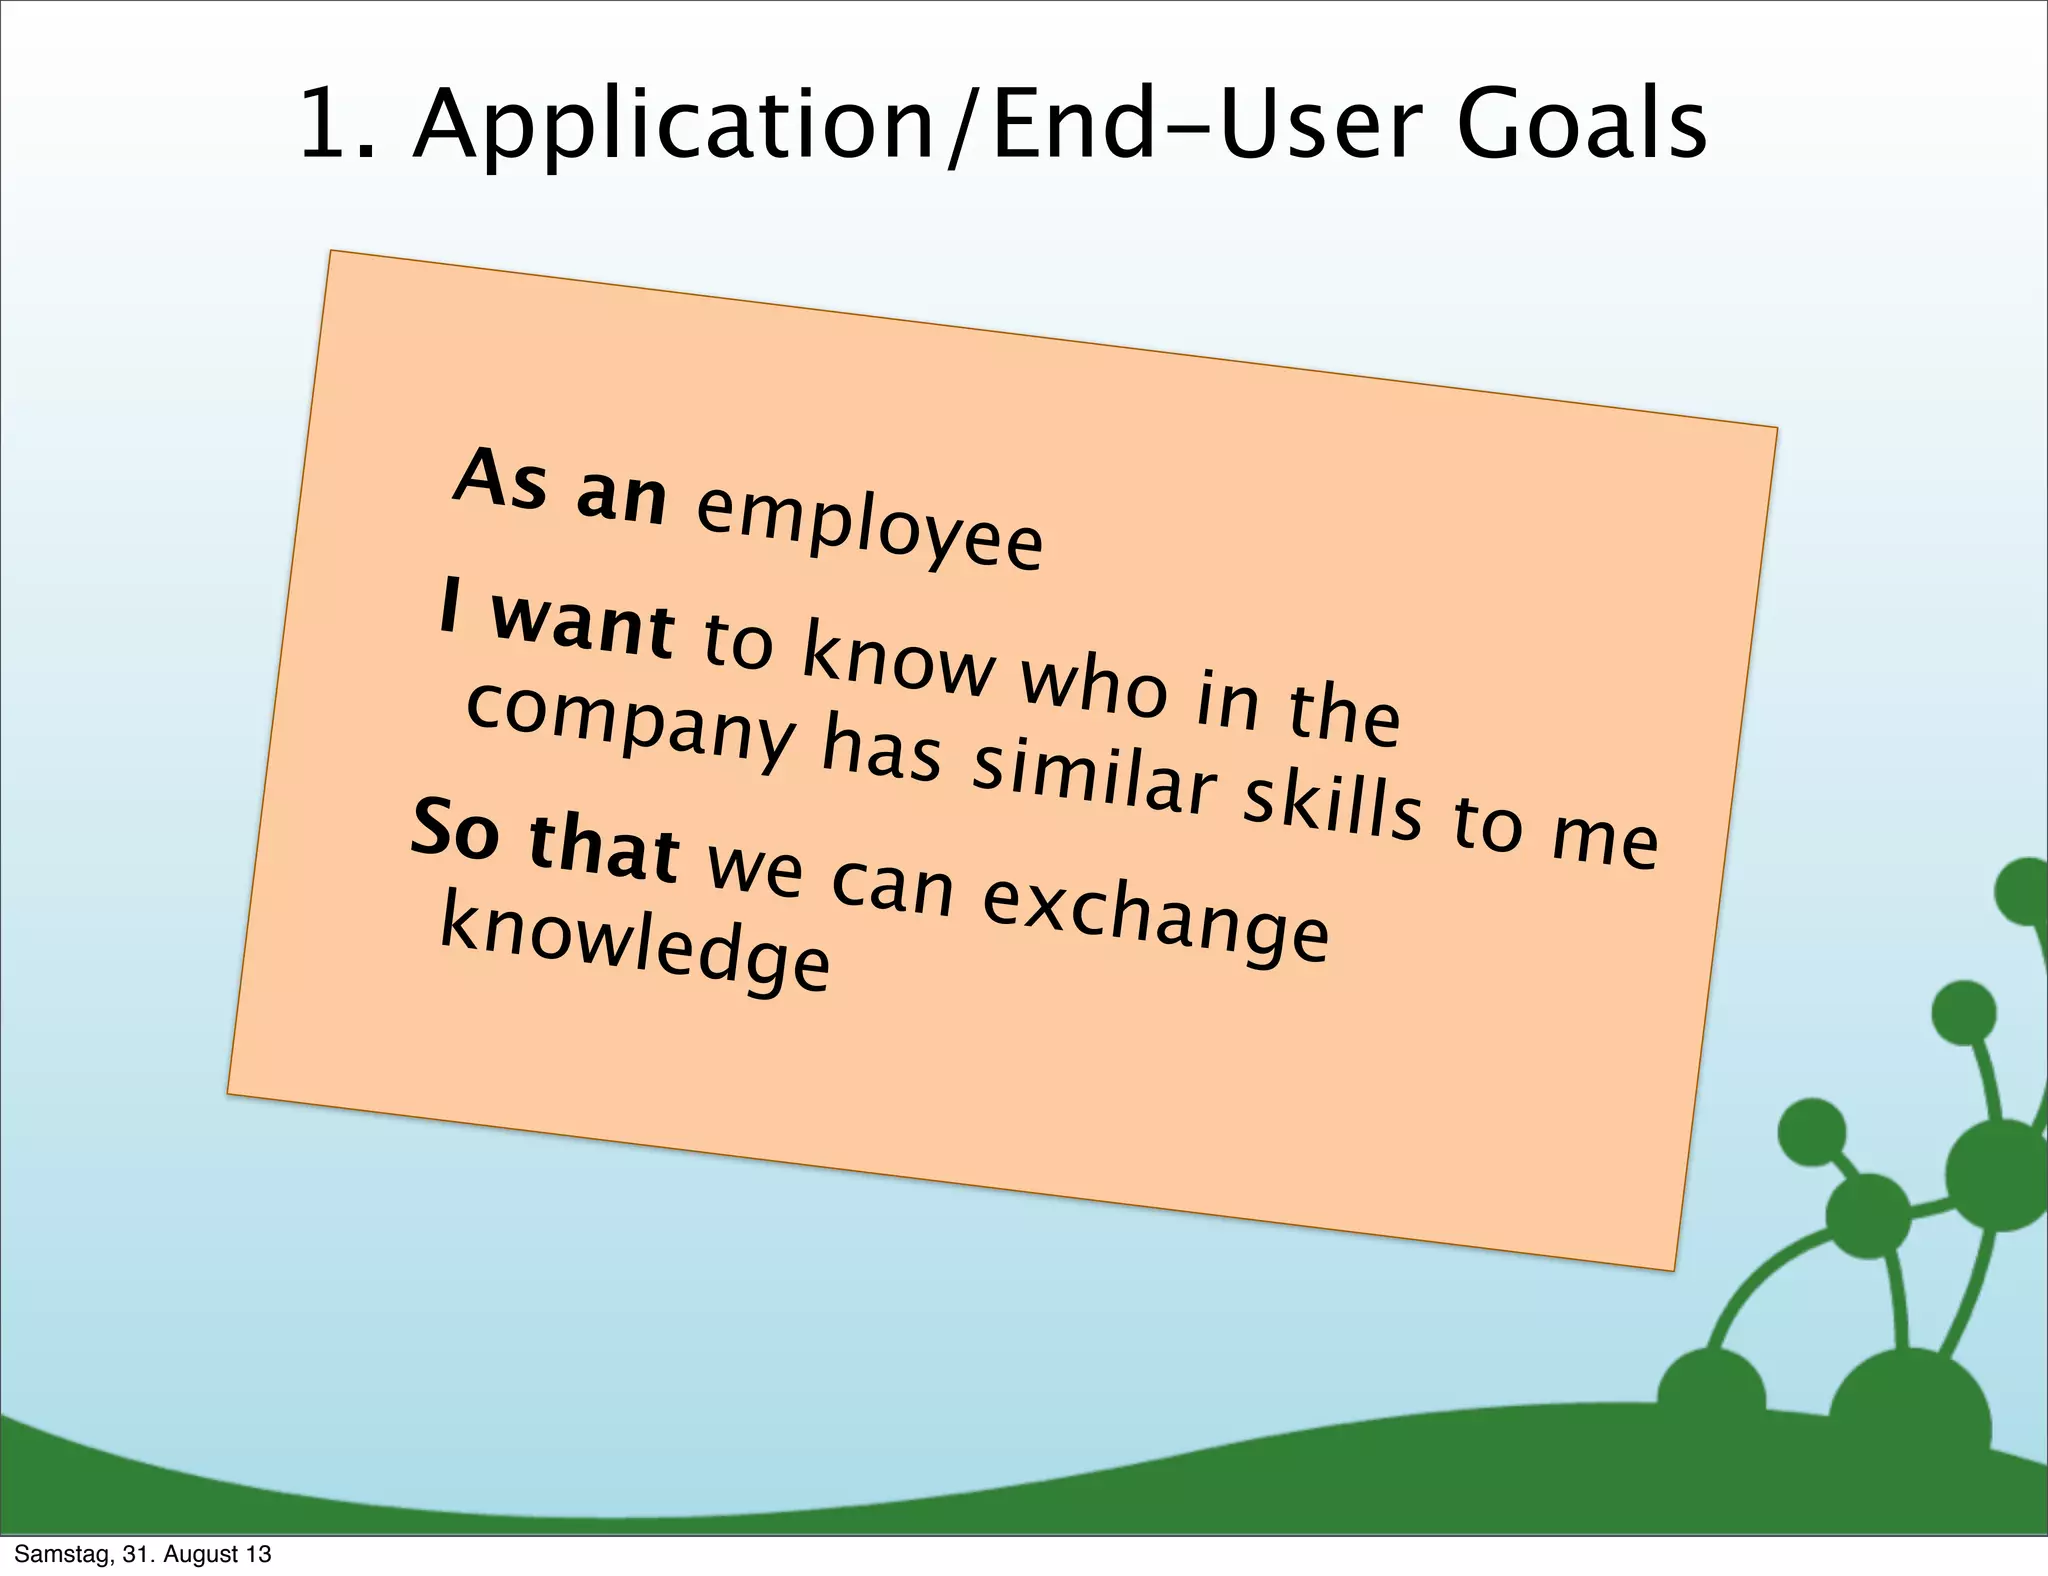
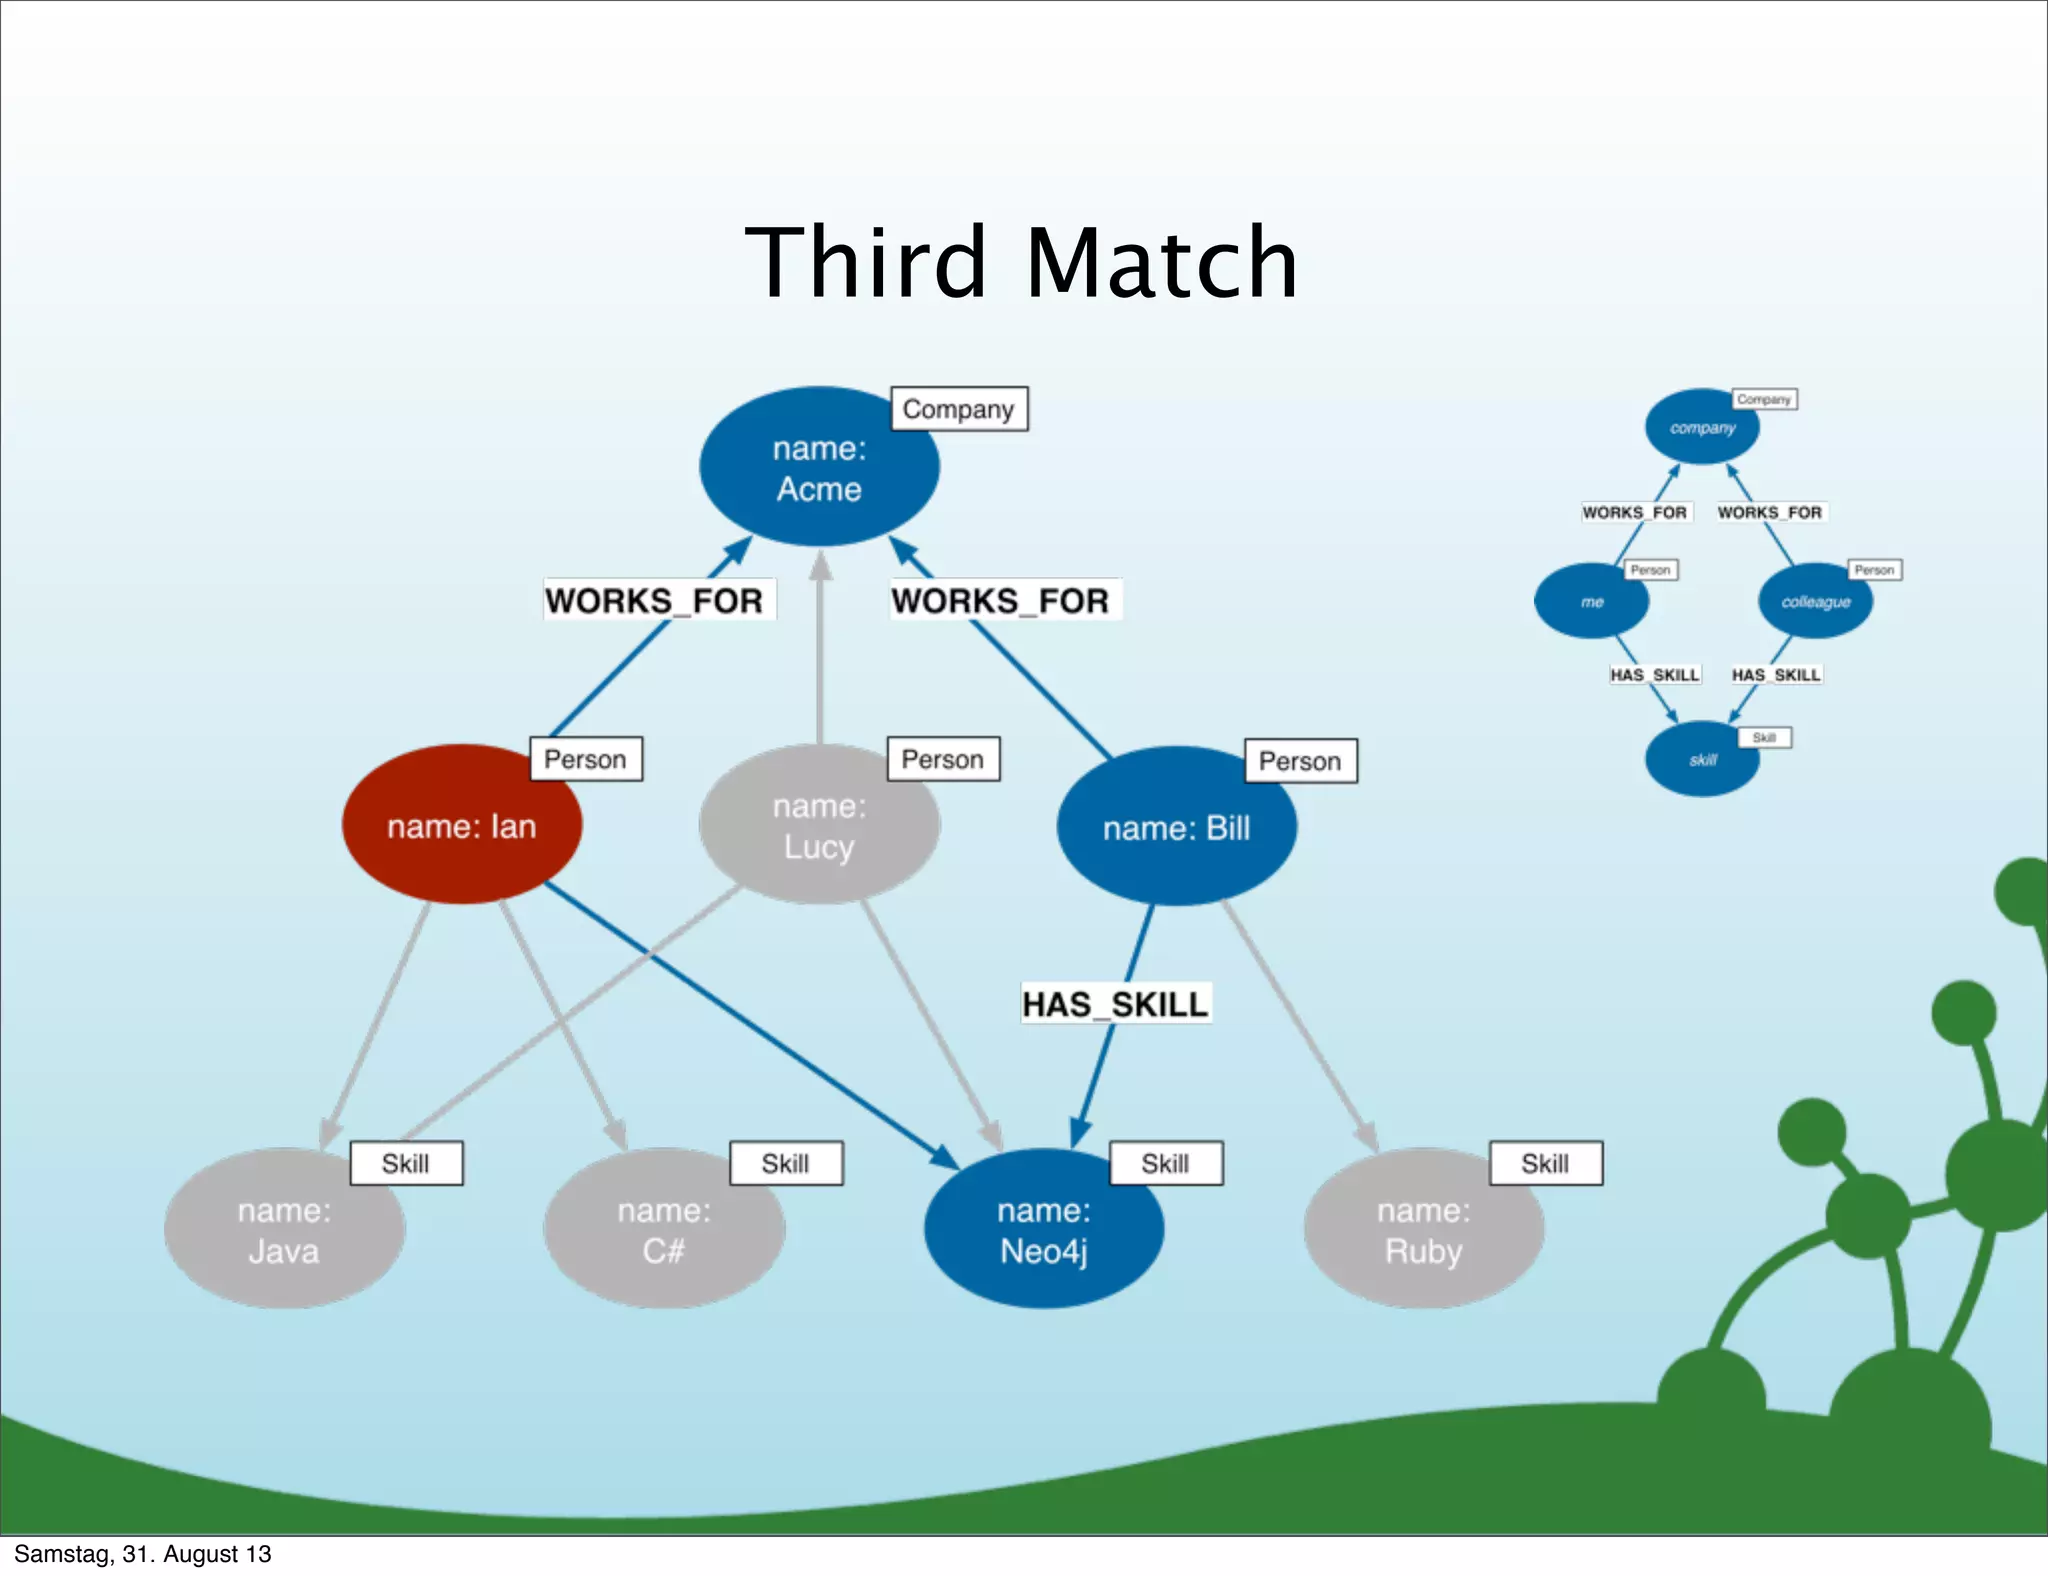
Explains how to design a graph model based on user stories and patterns, including query design.
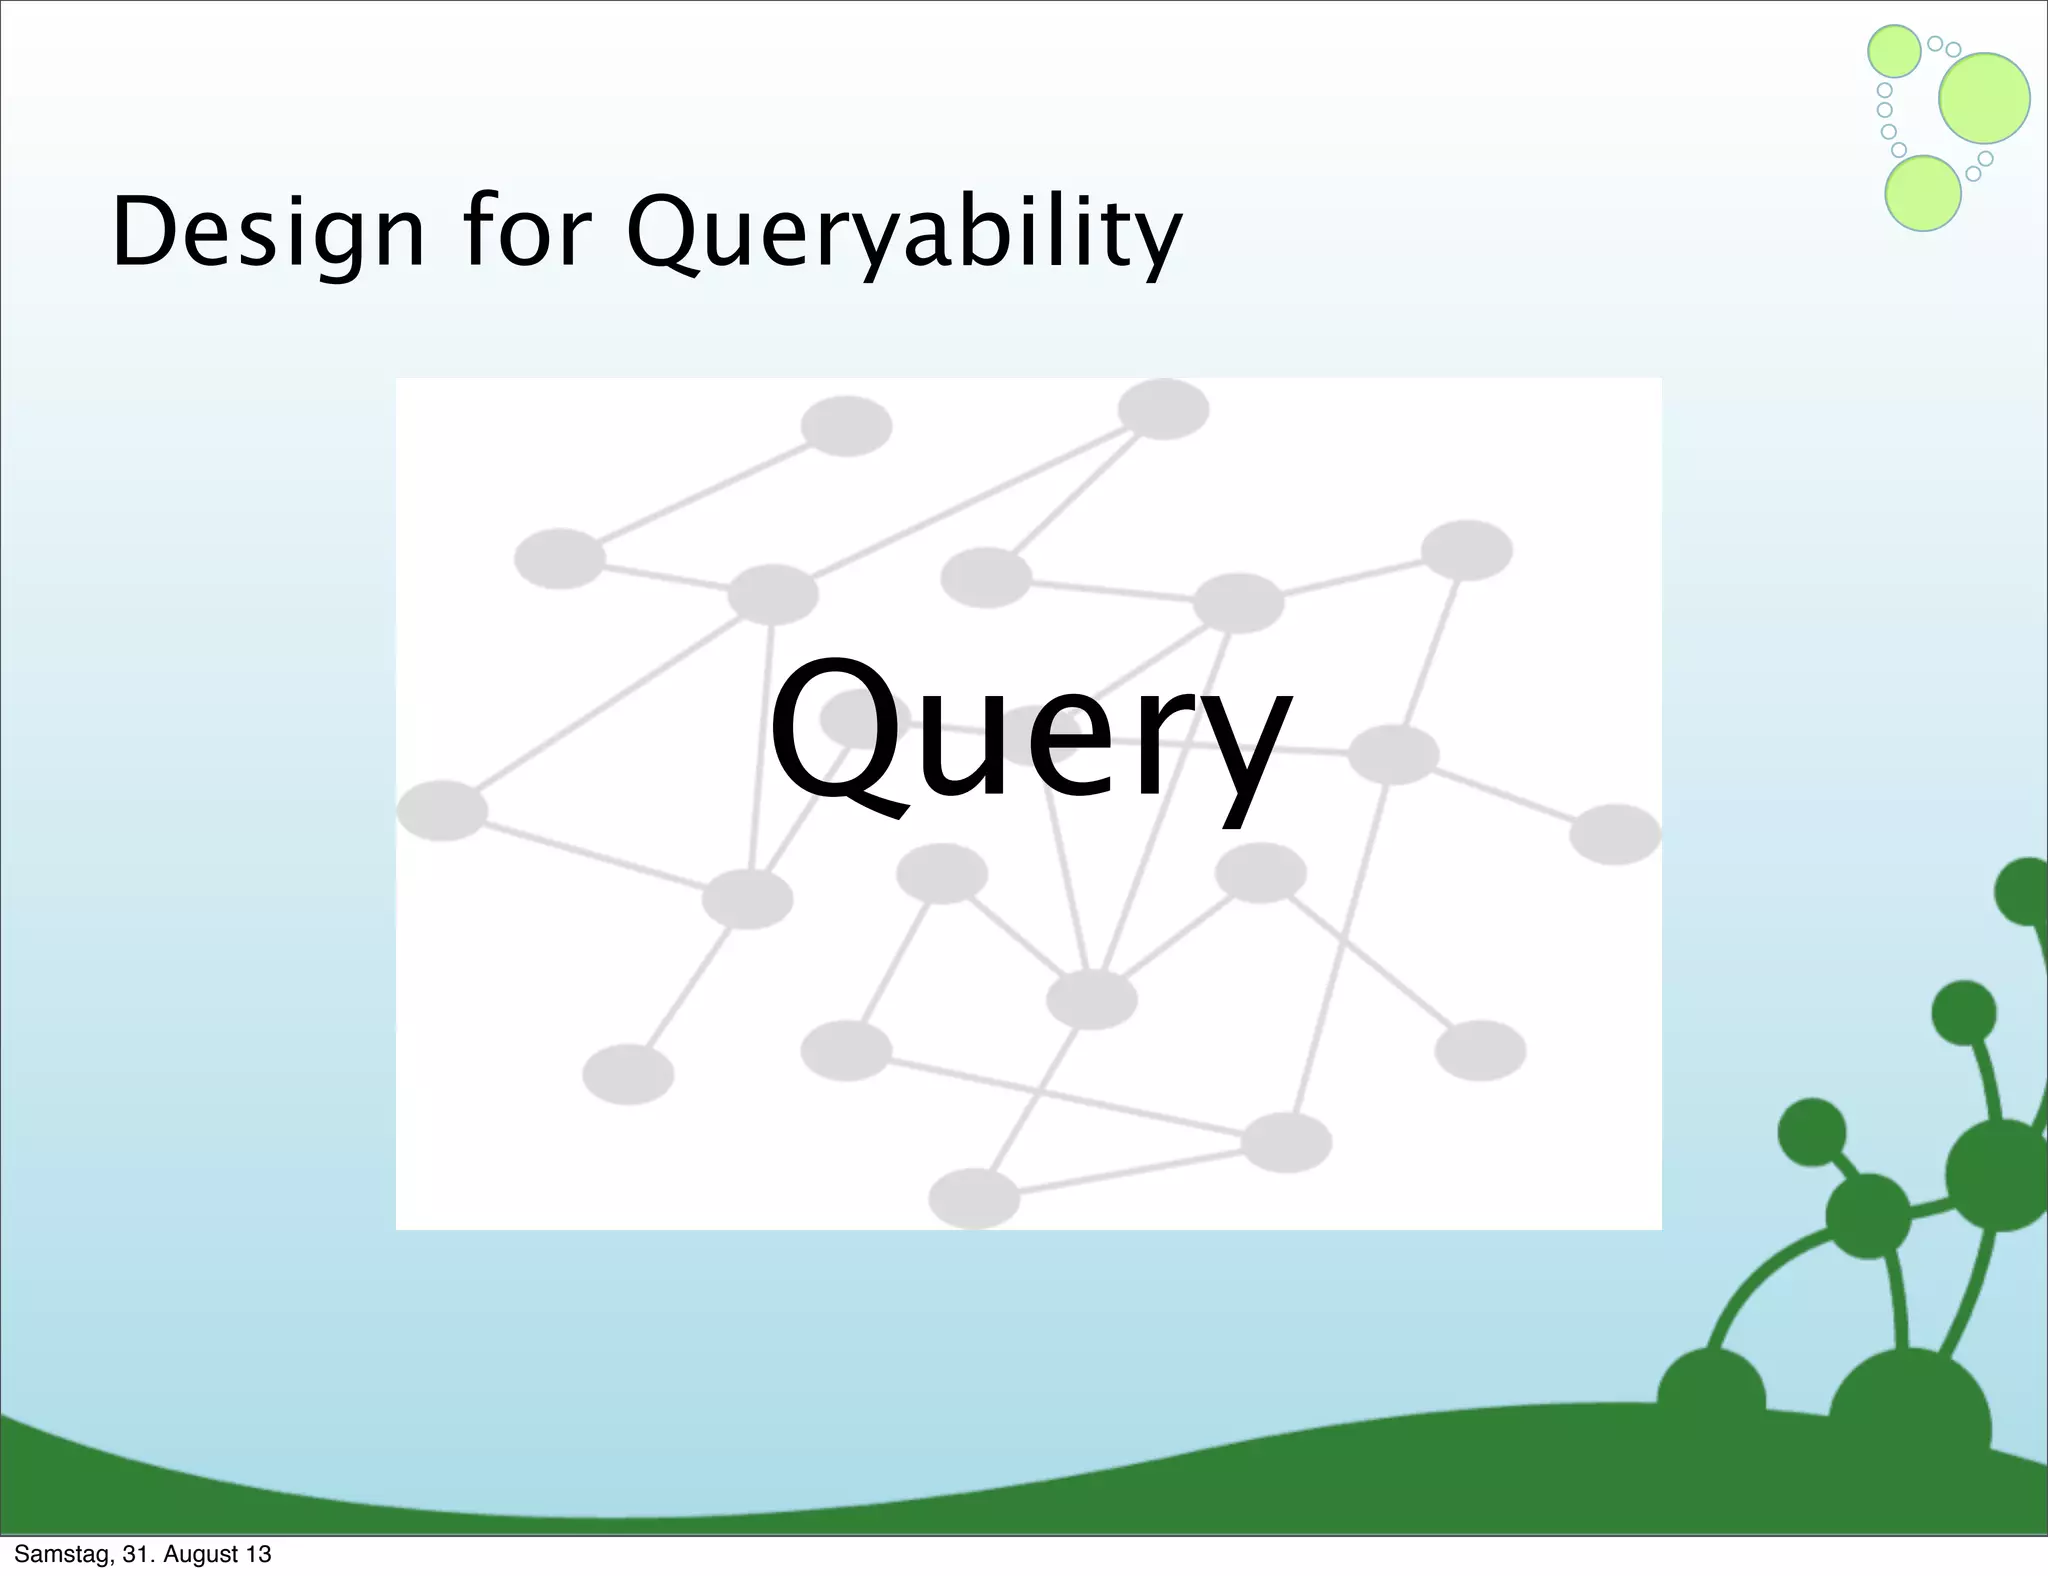
Developing Cypher queries to match user questions to graph patterns and refine data models.
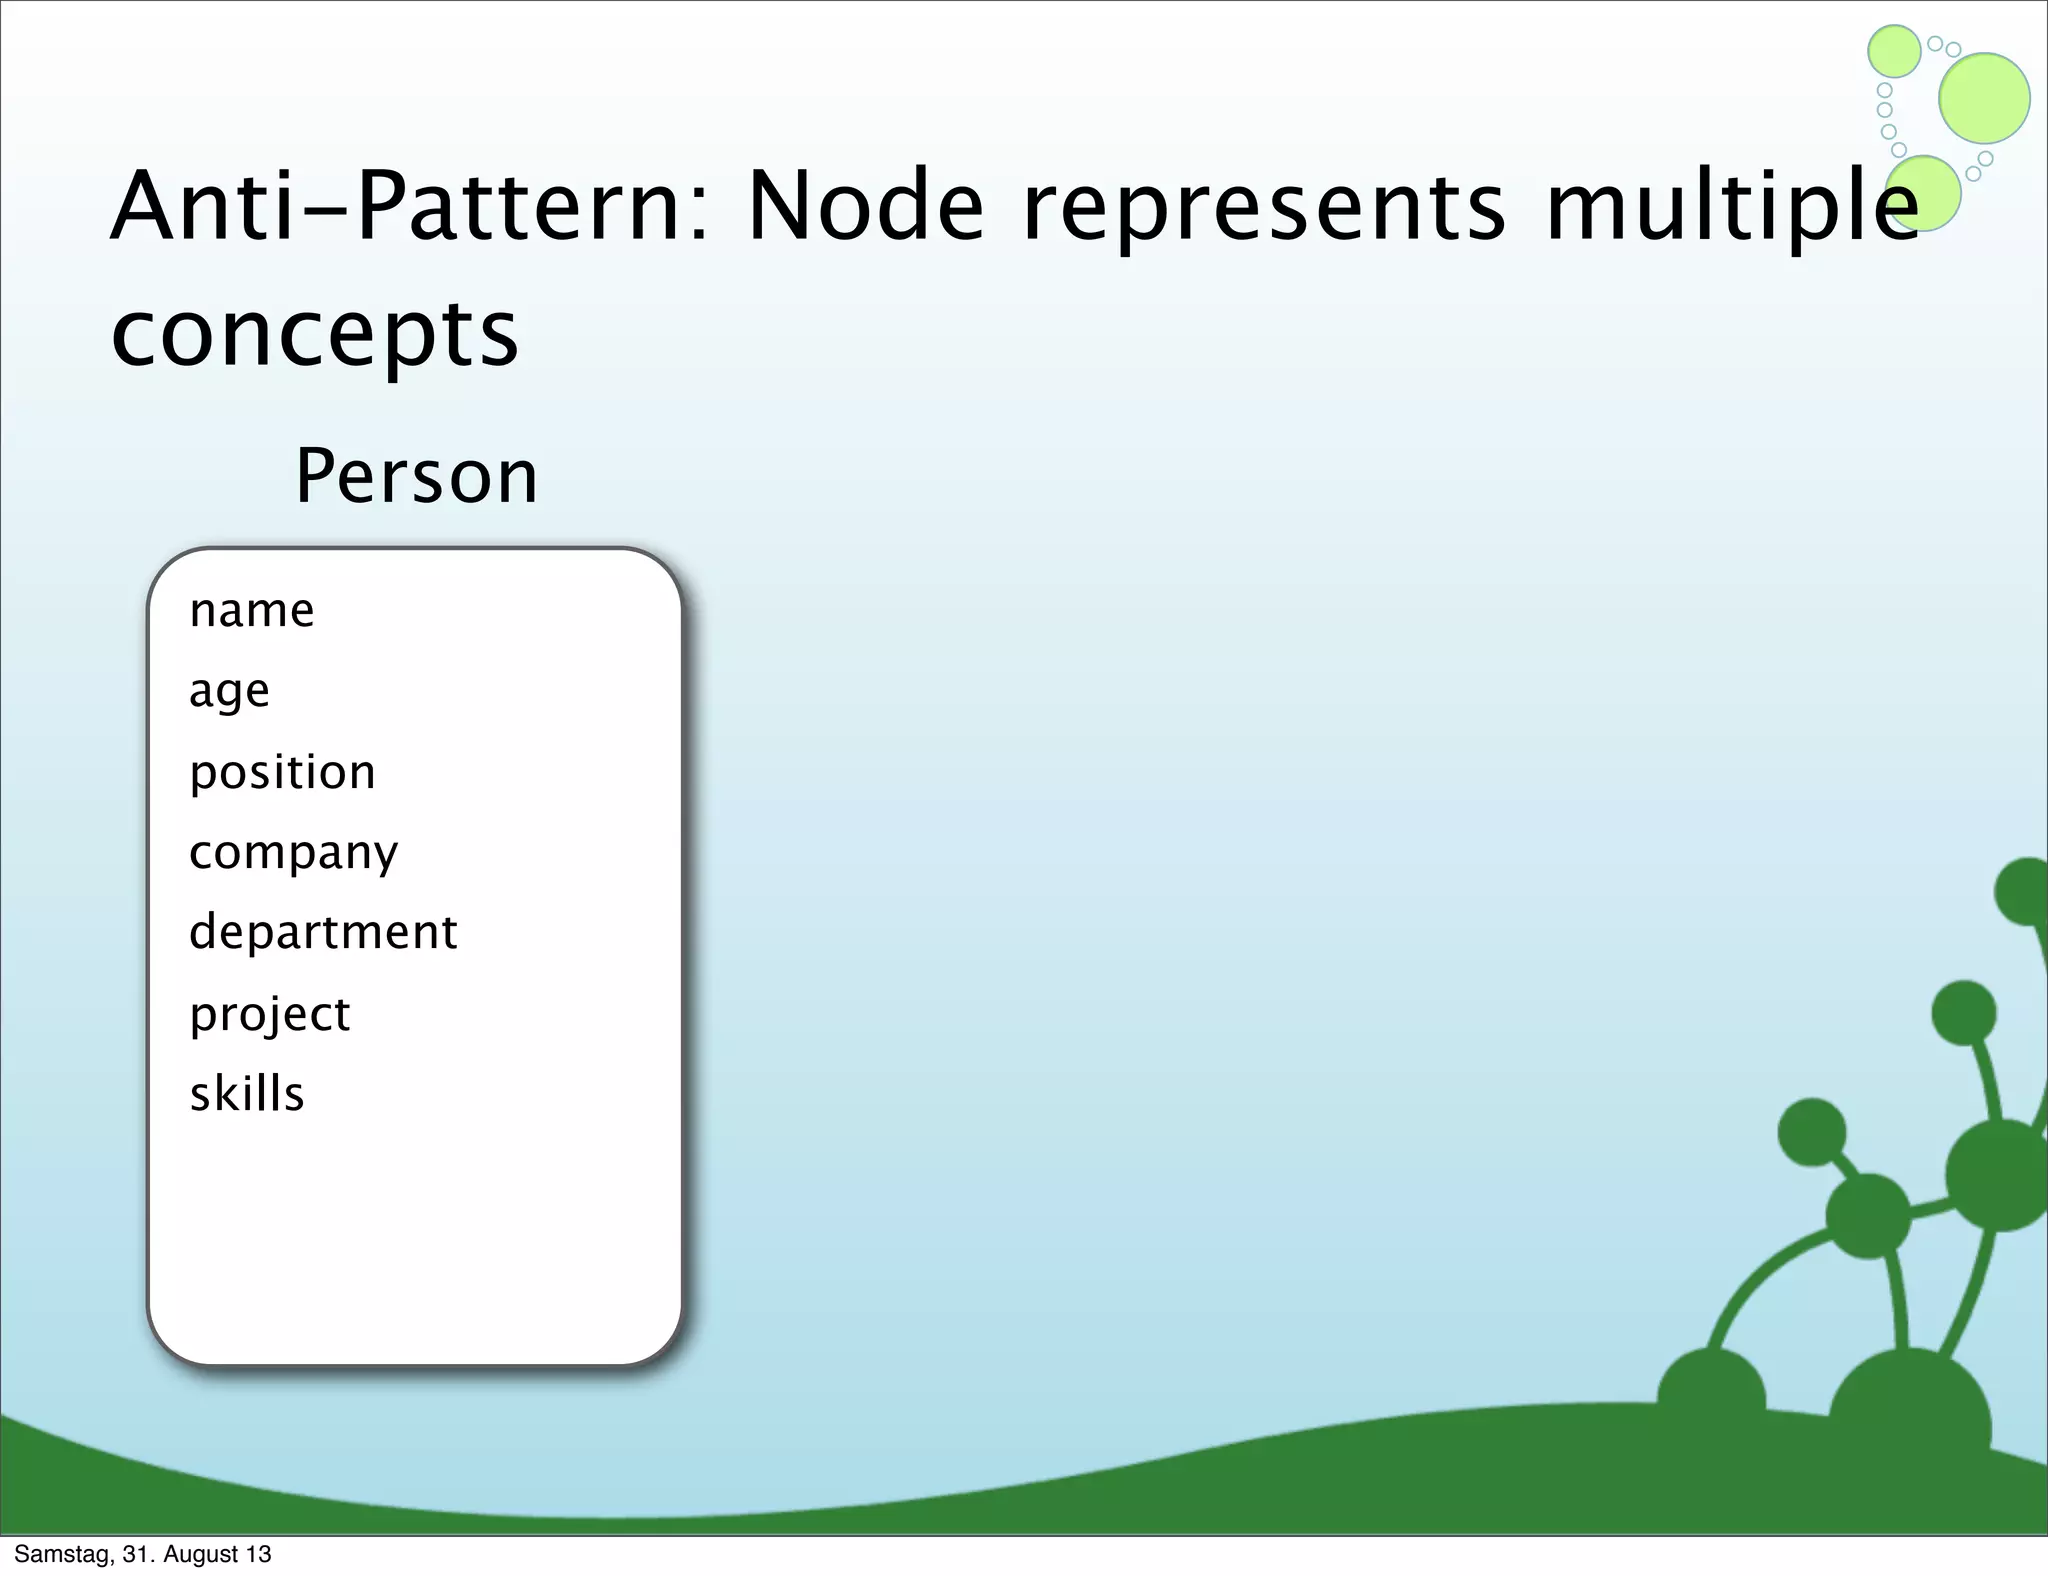
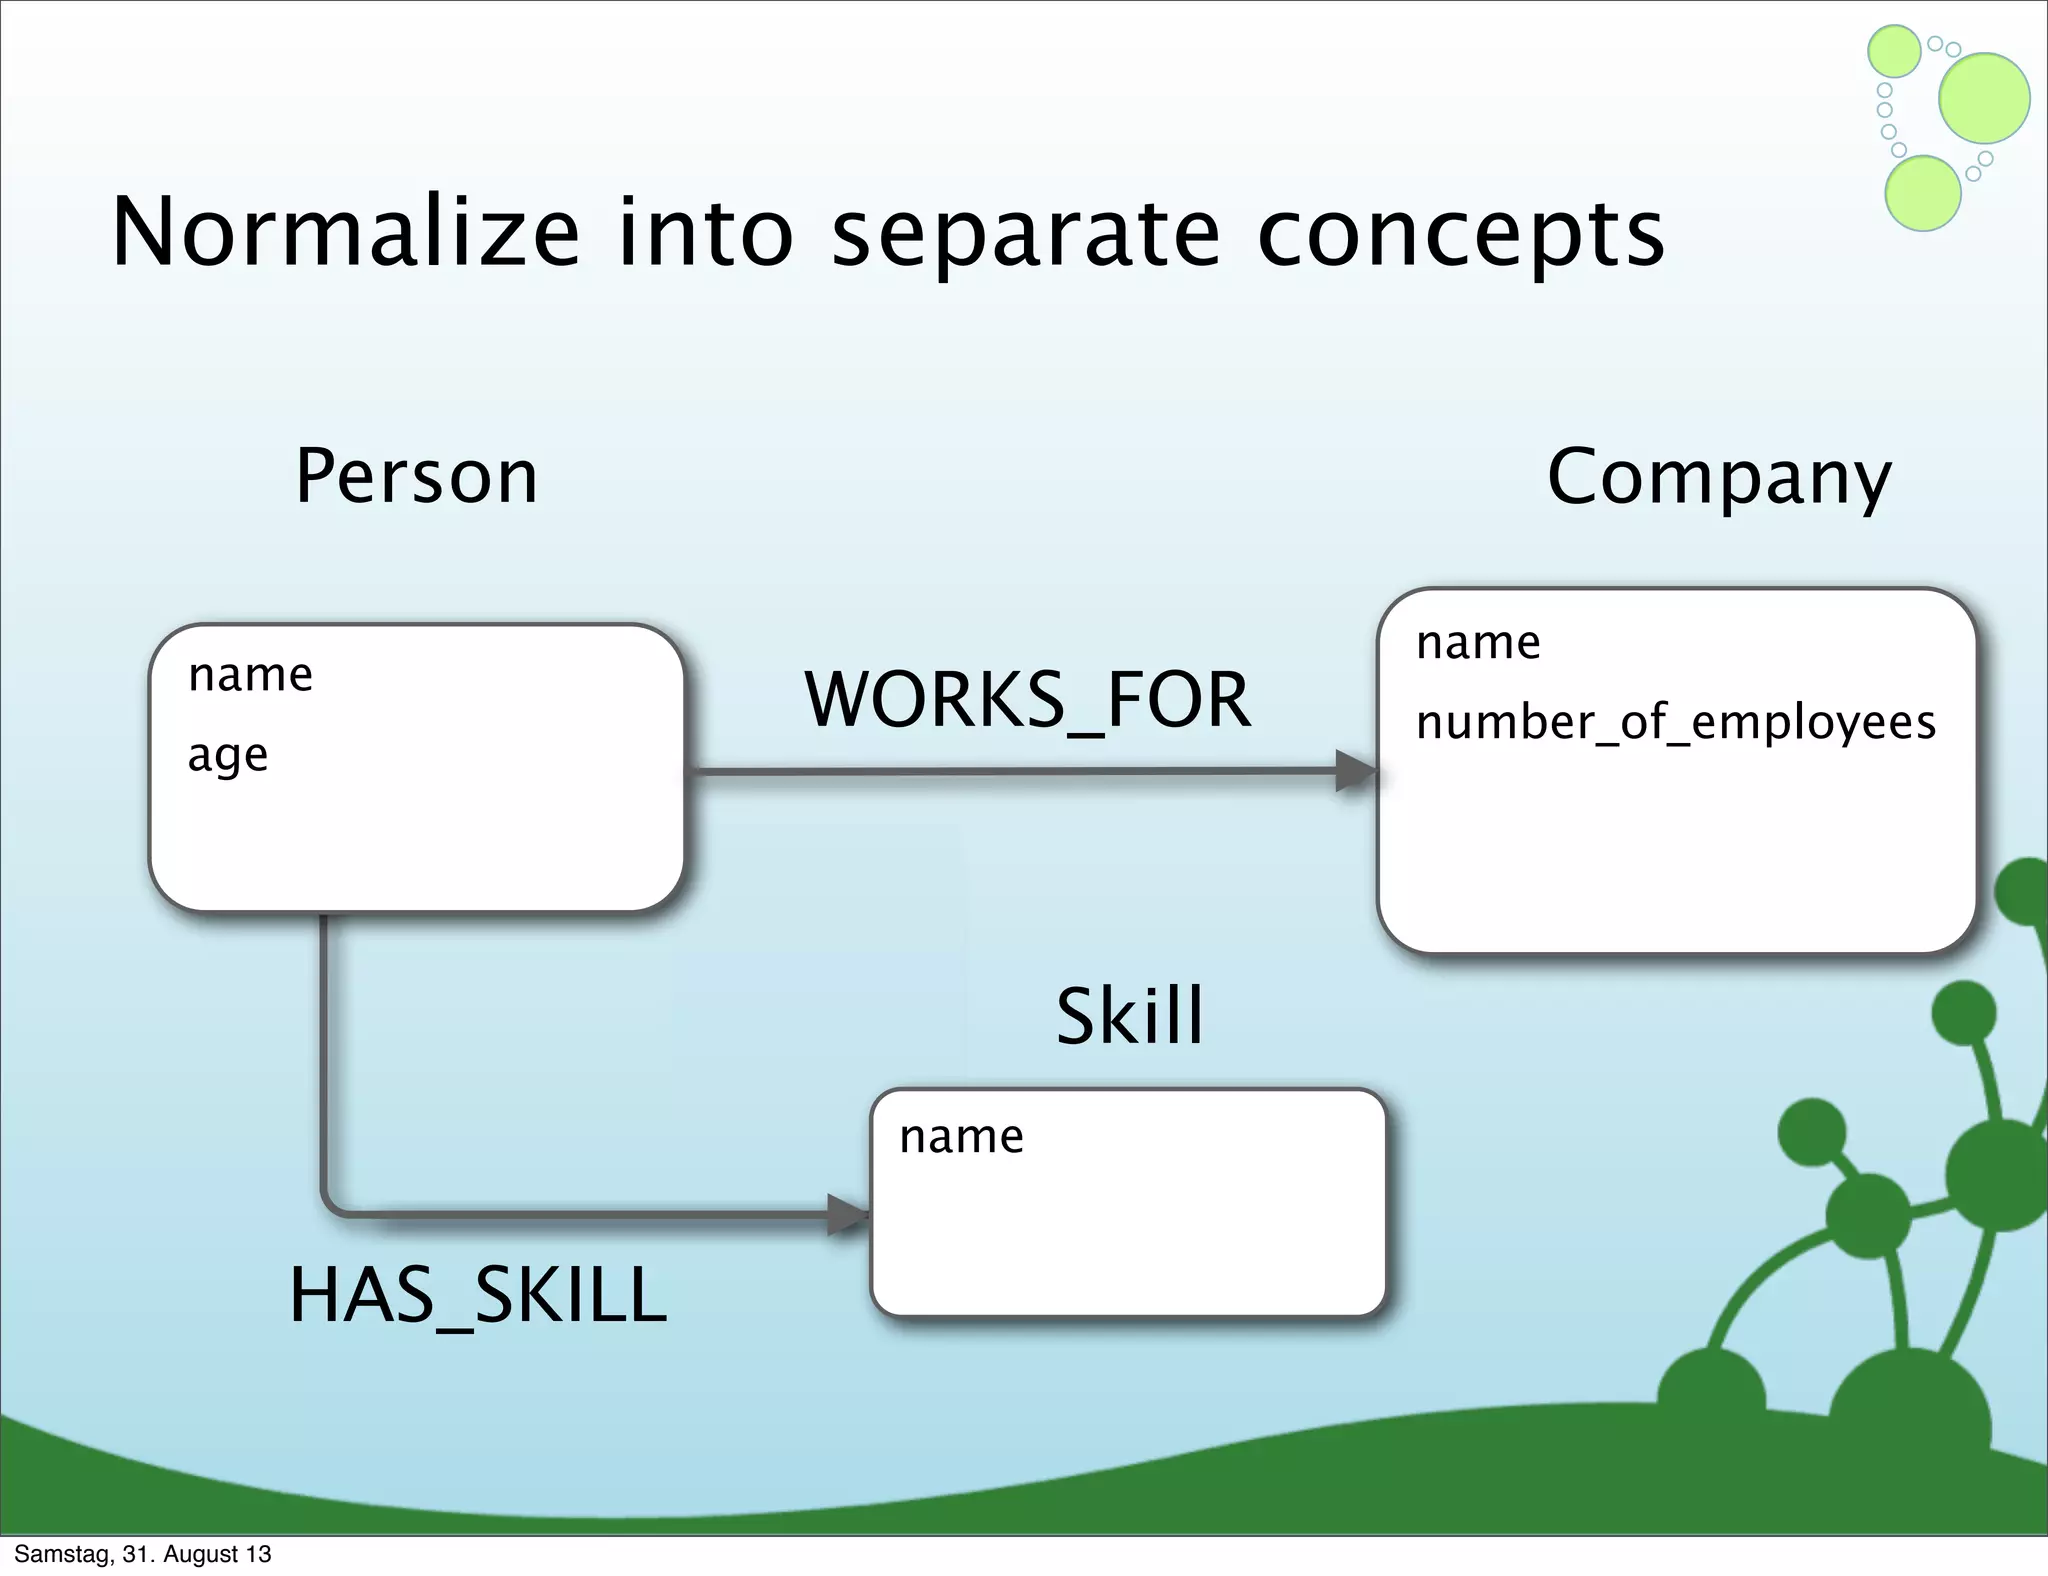
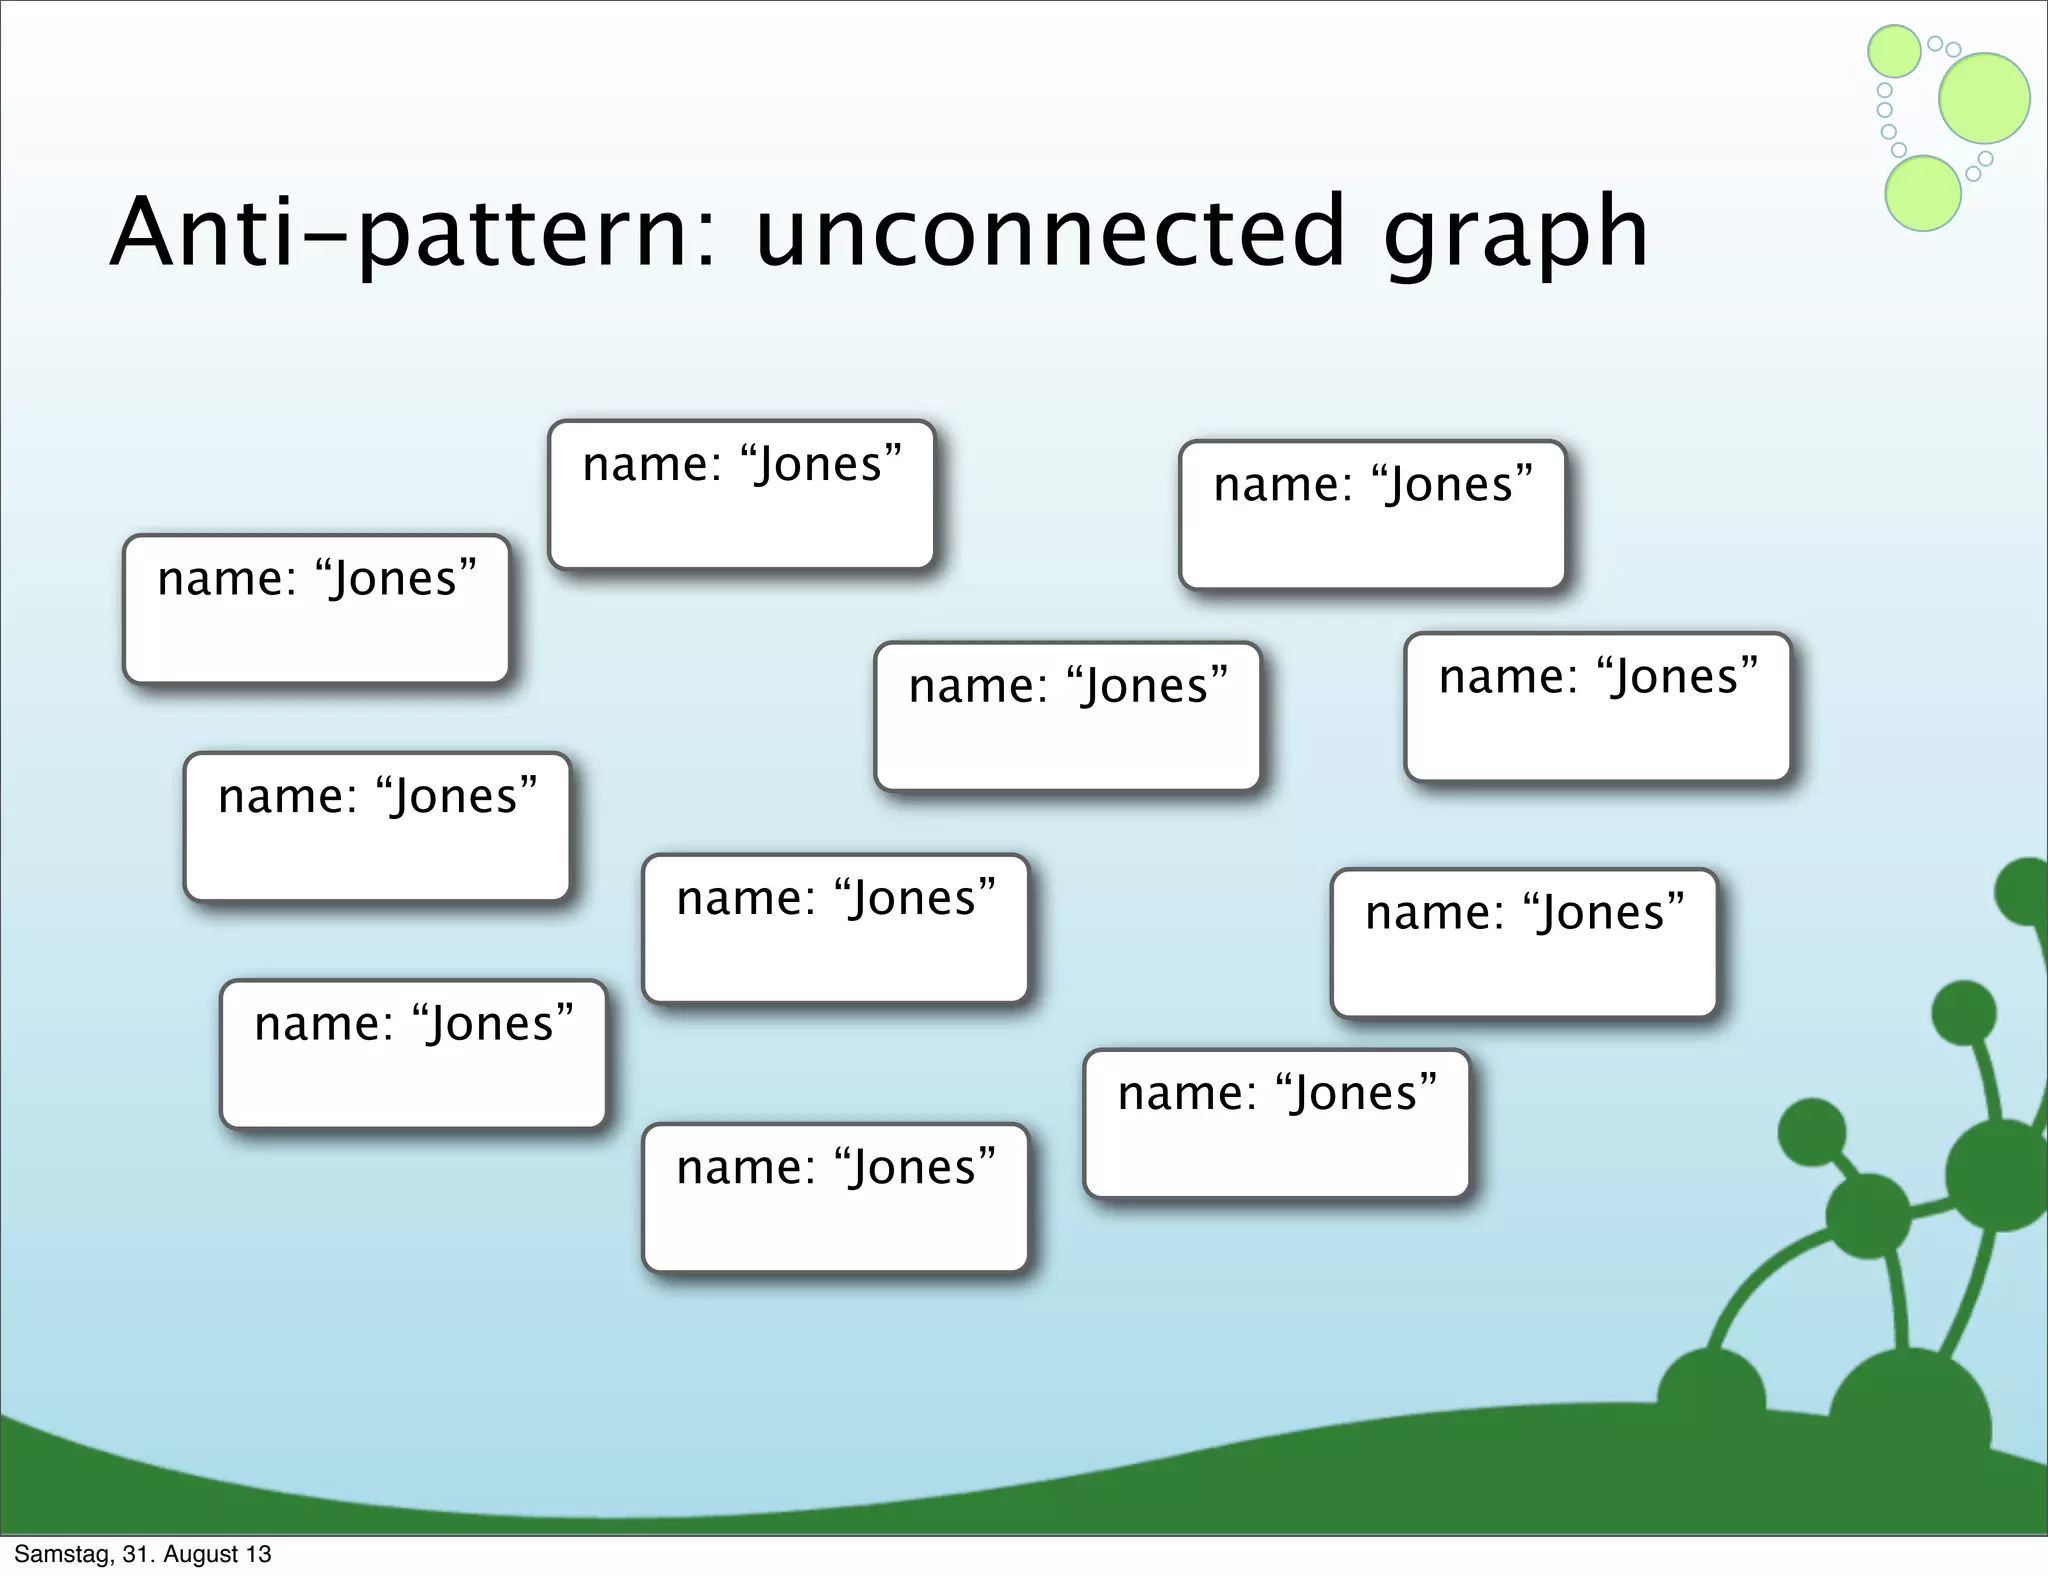
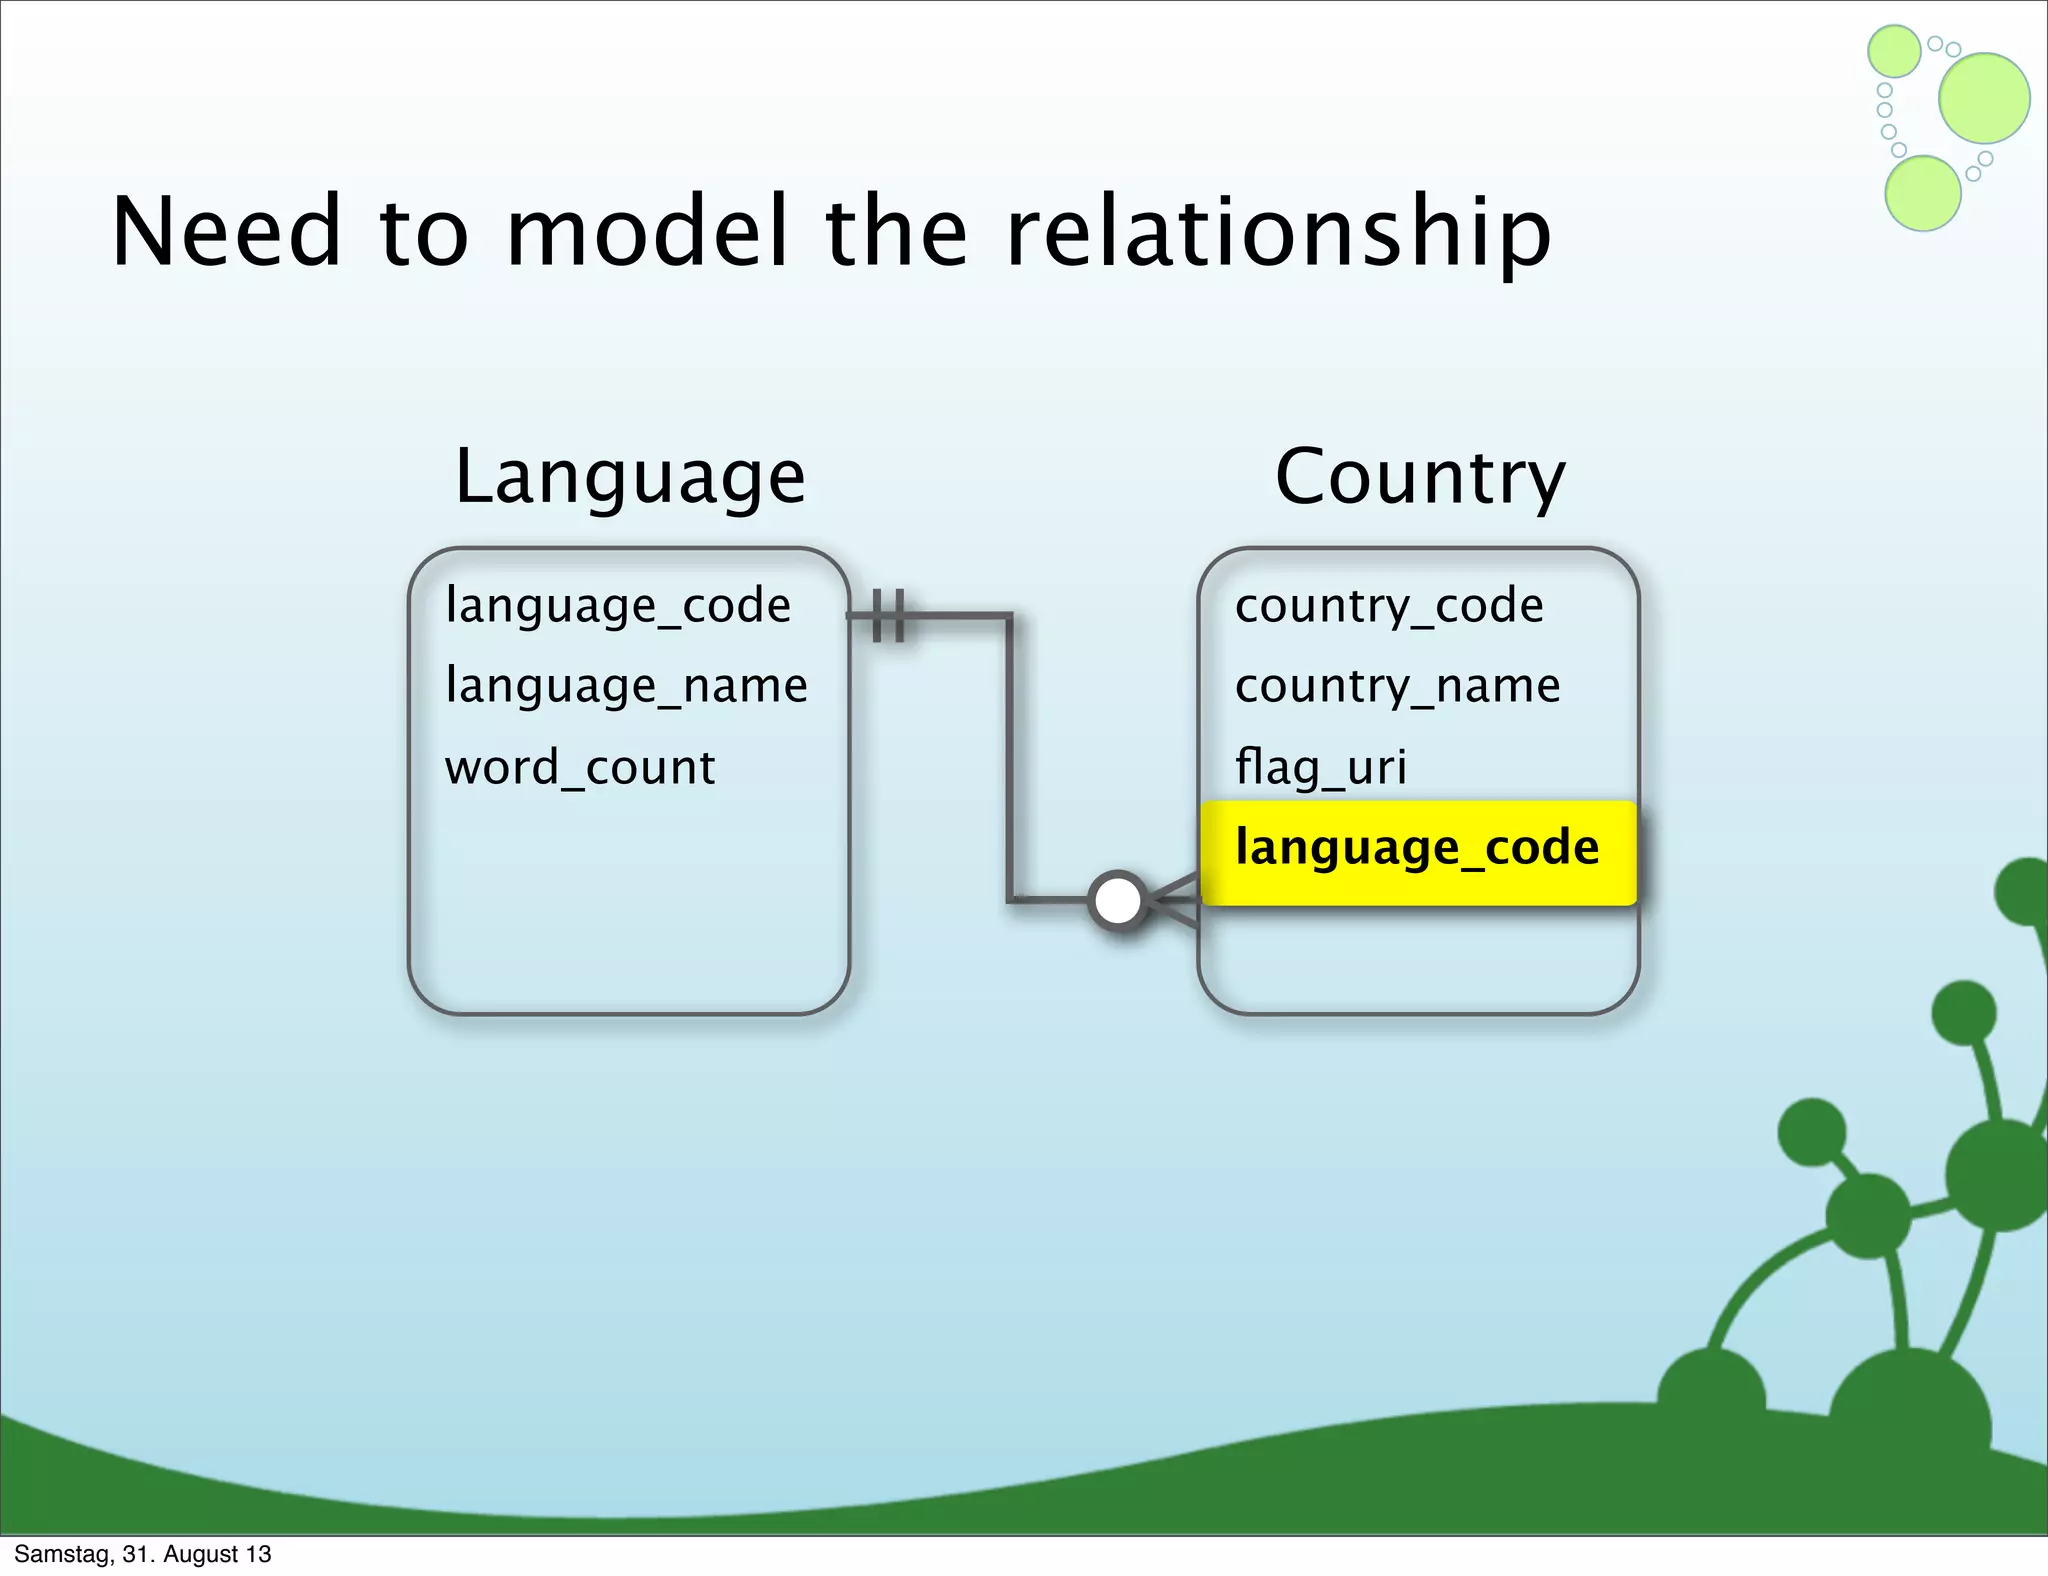
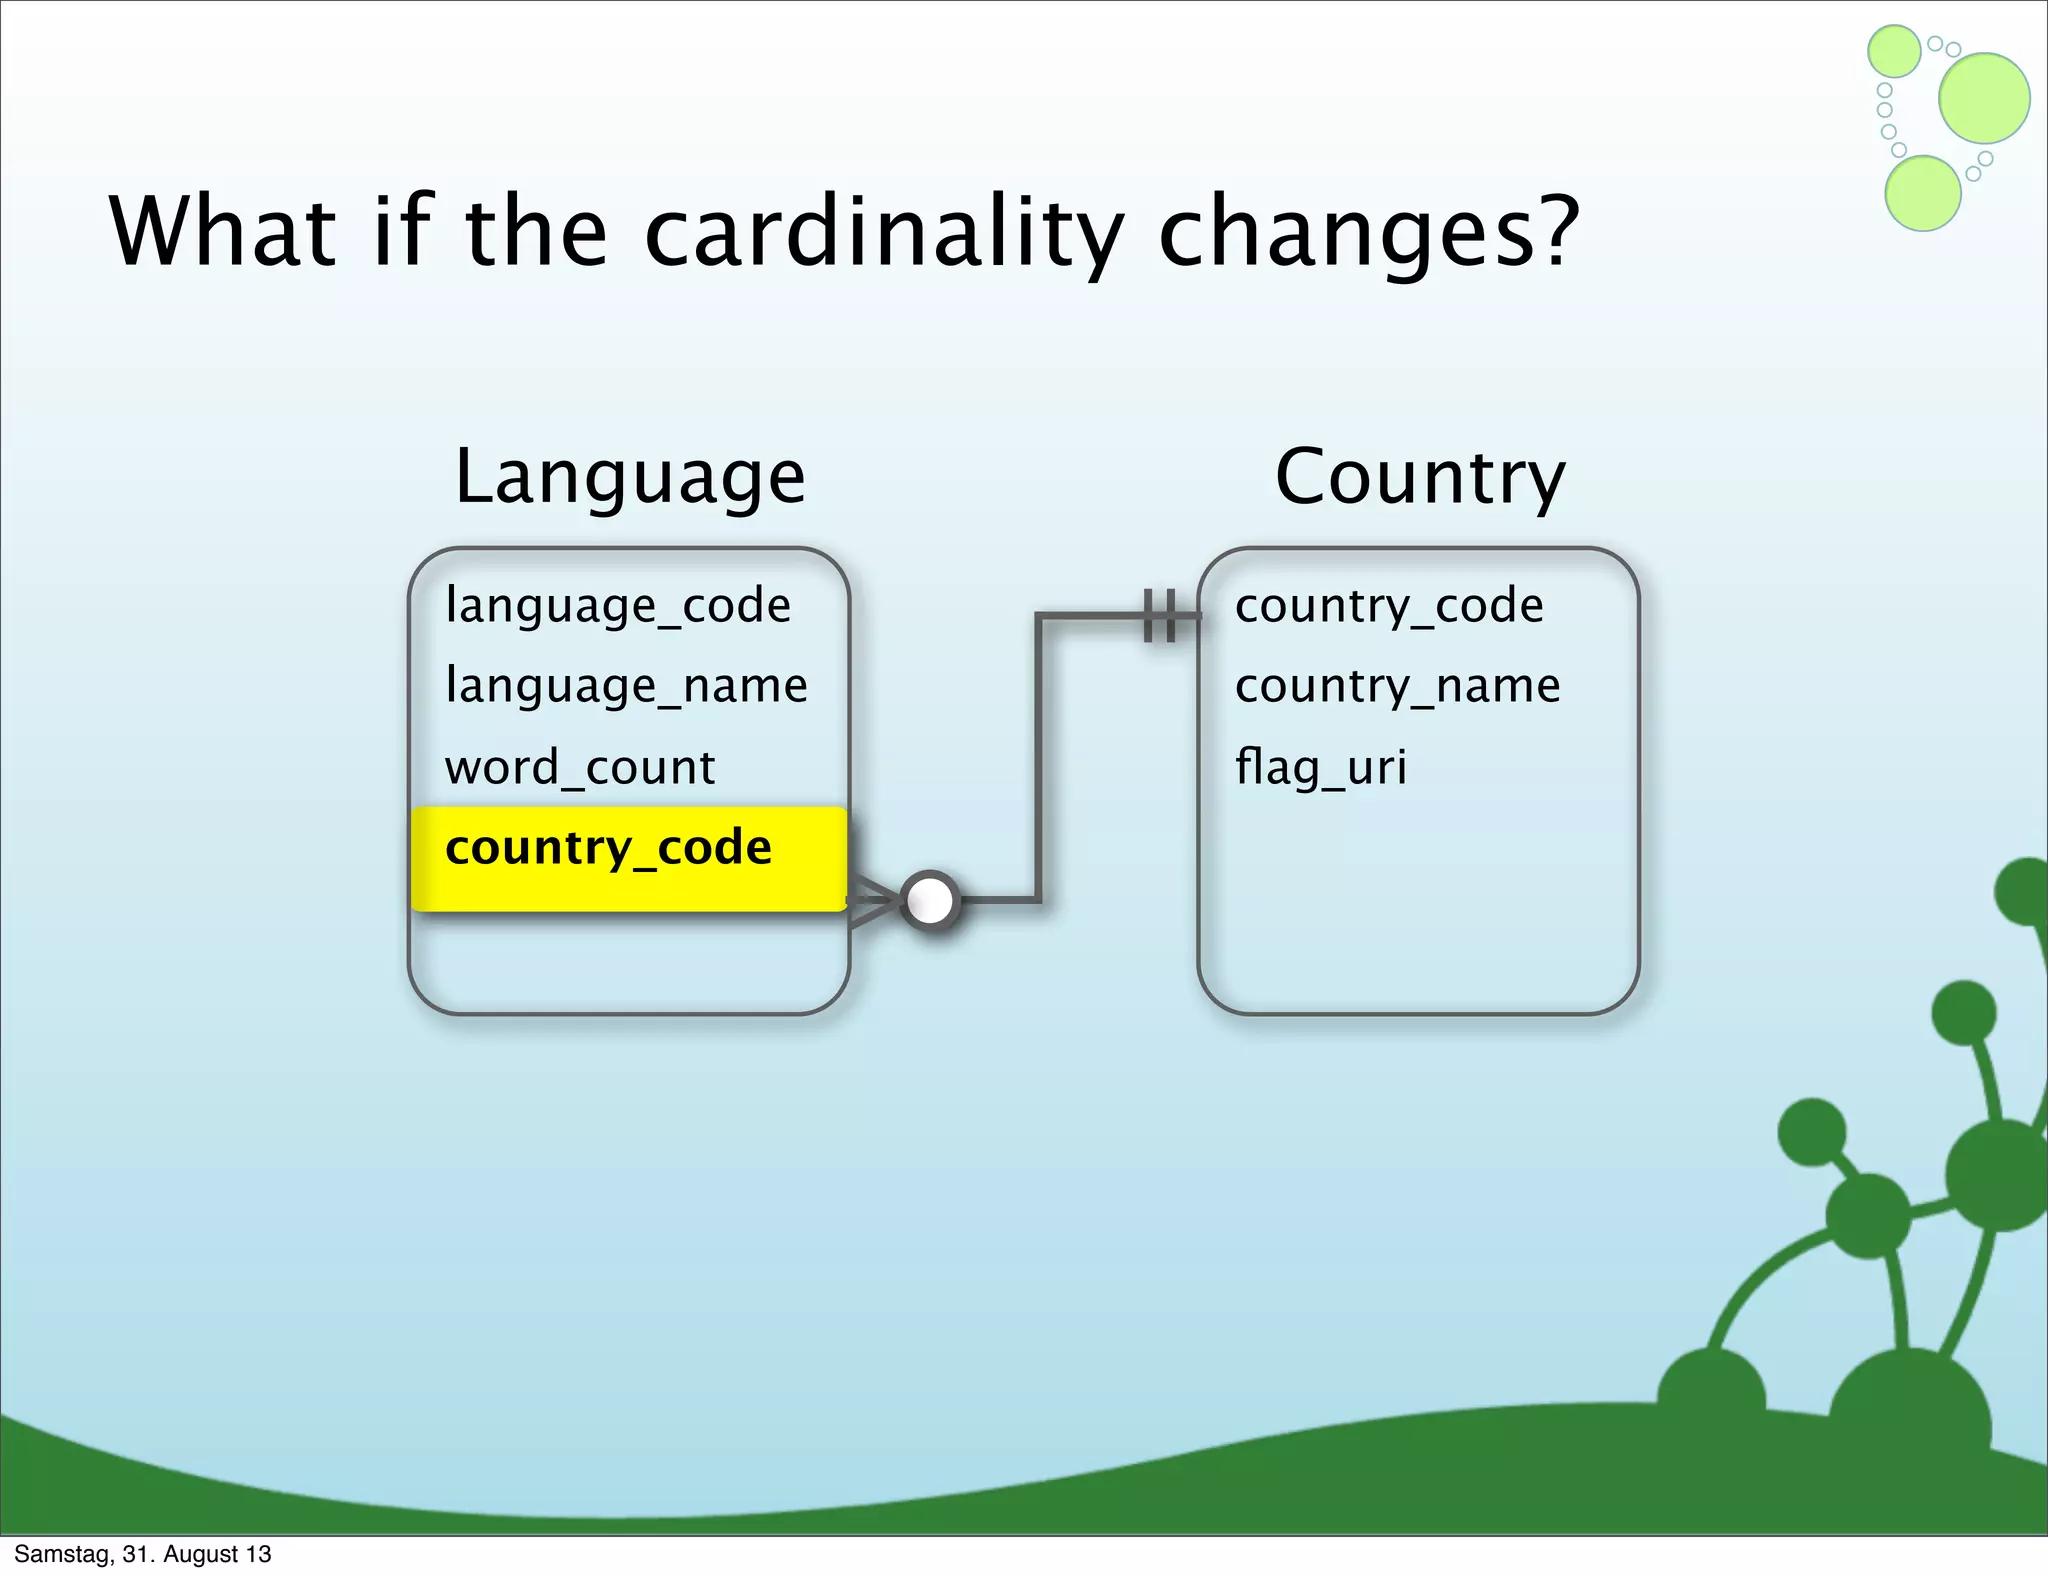
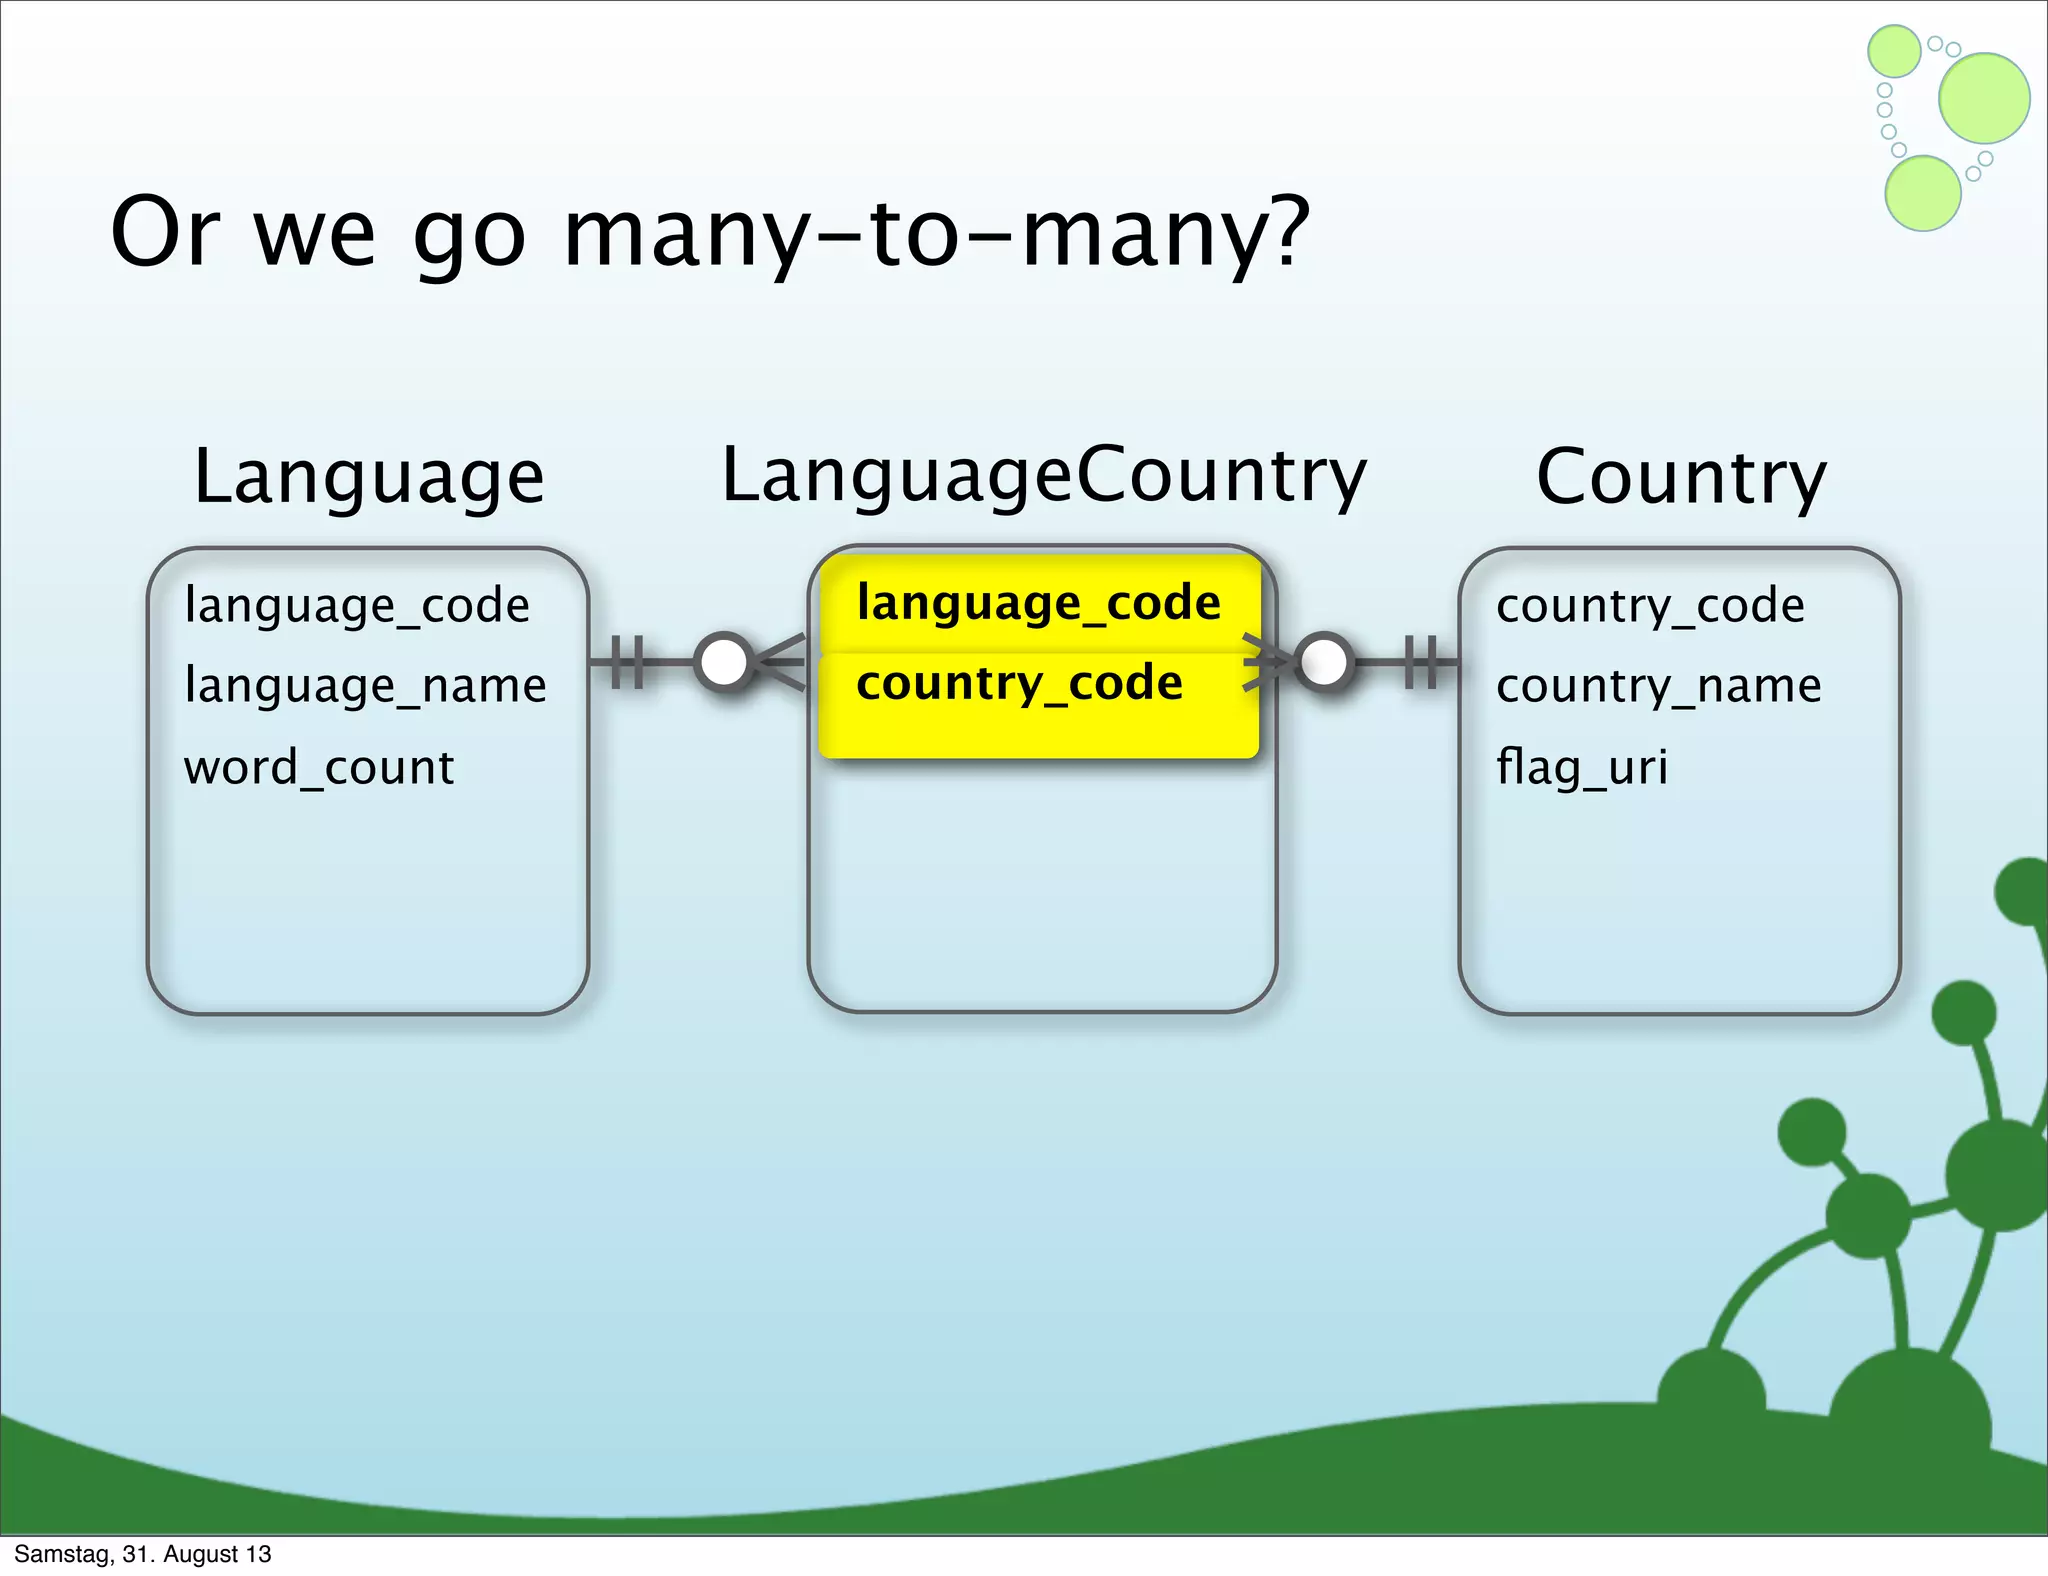
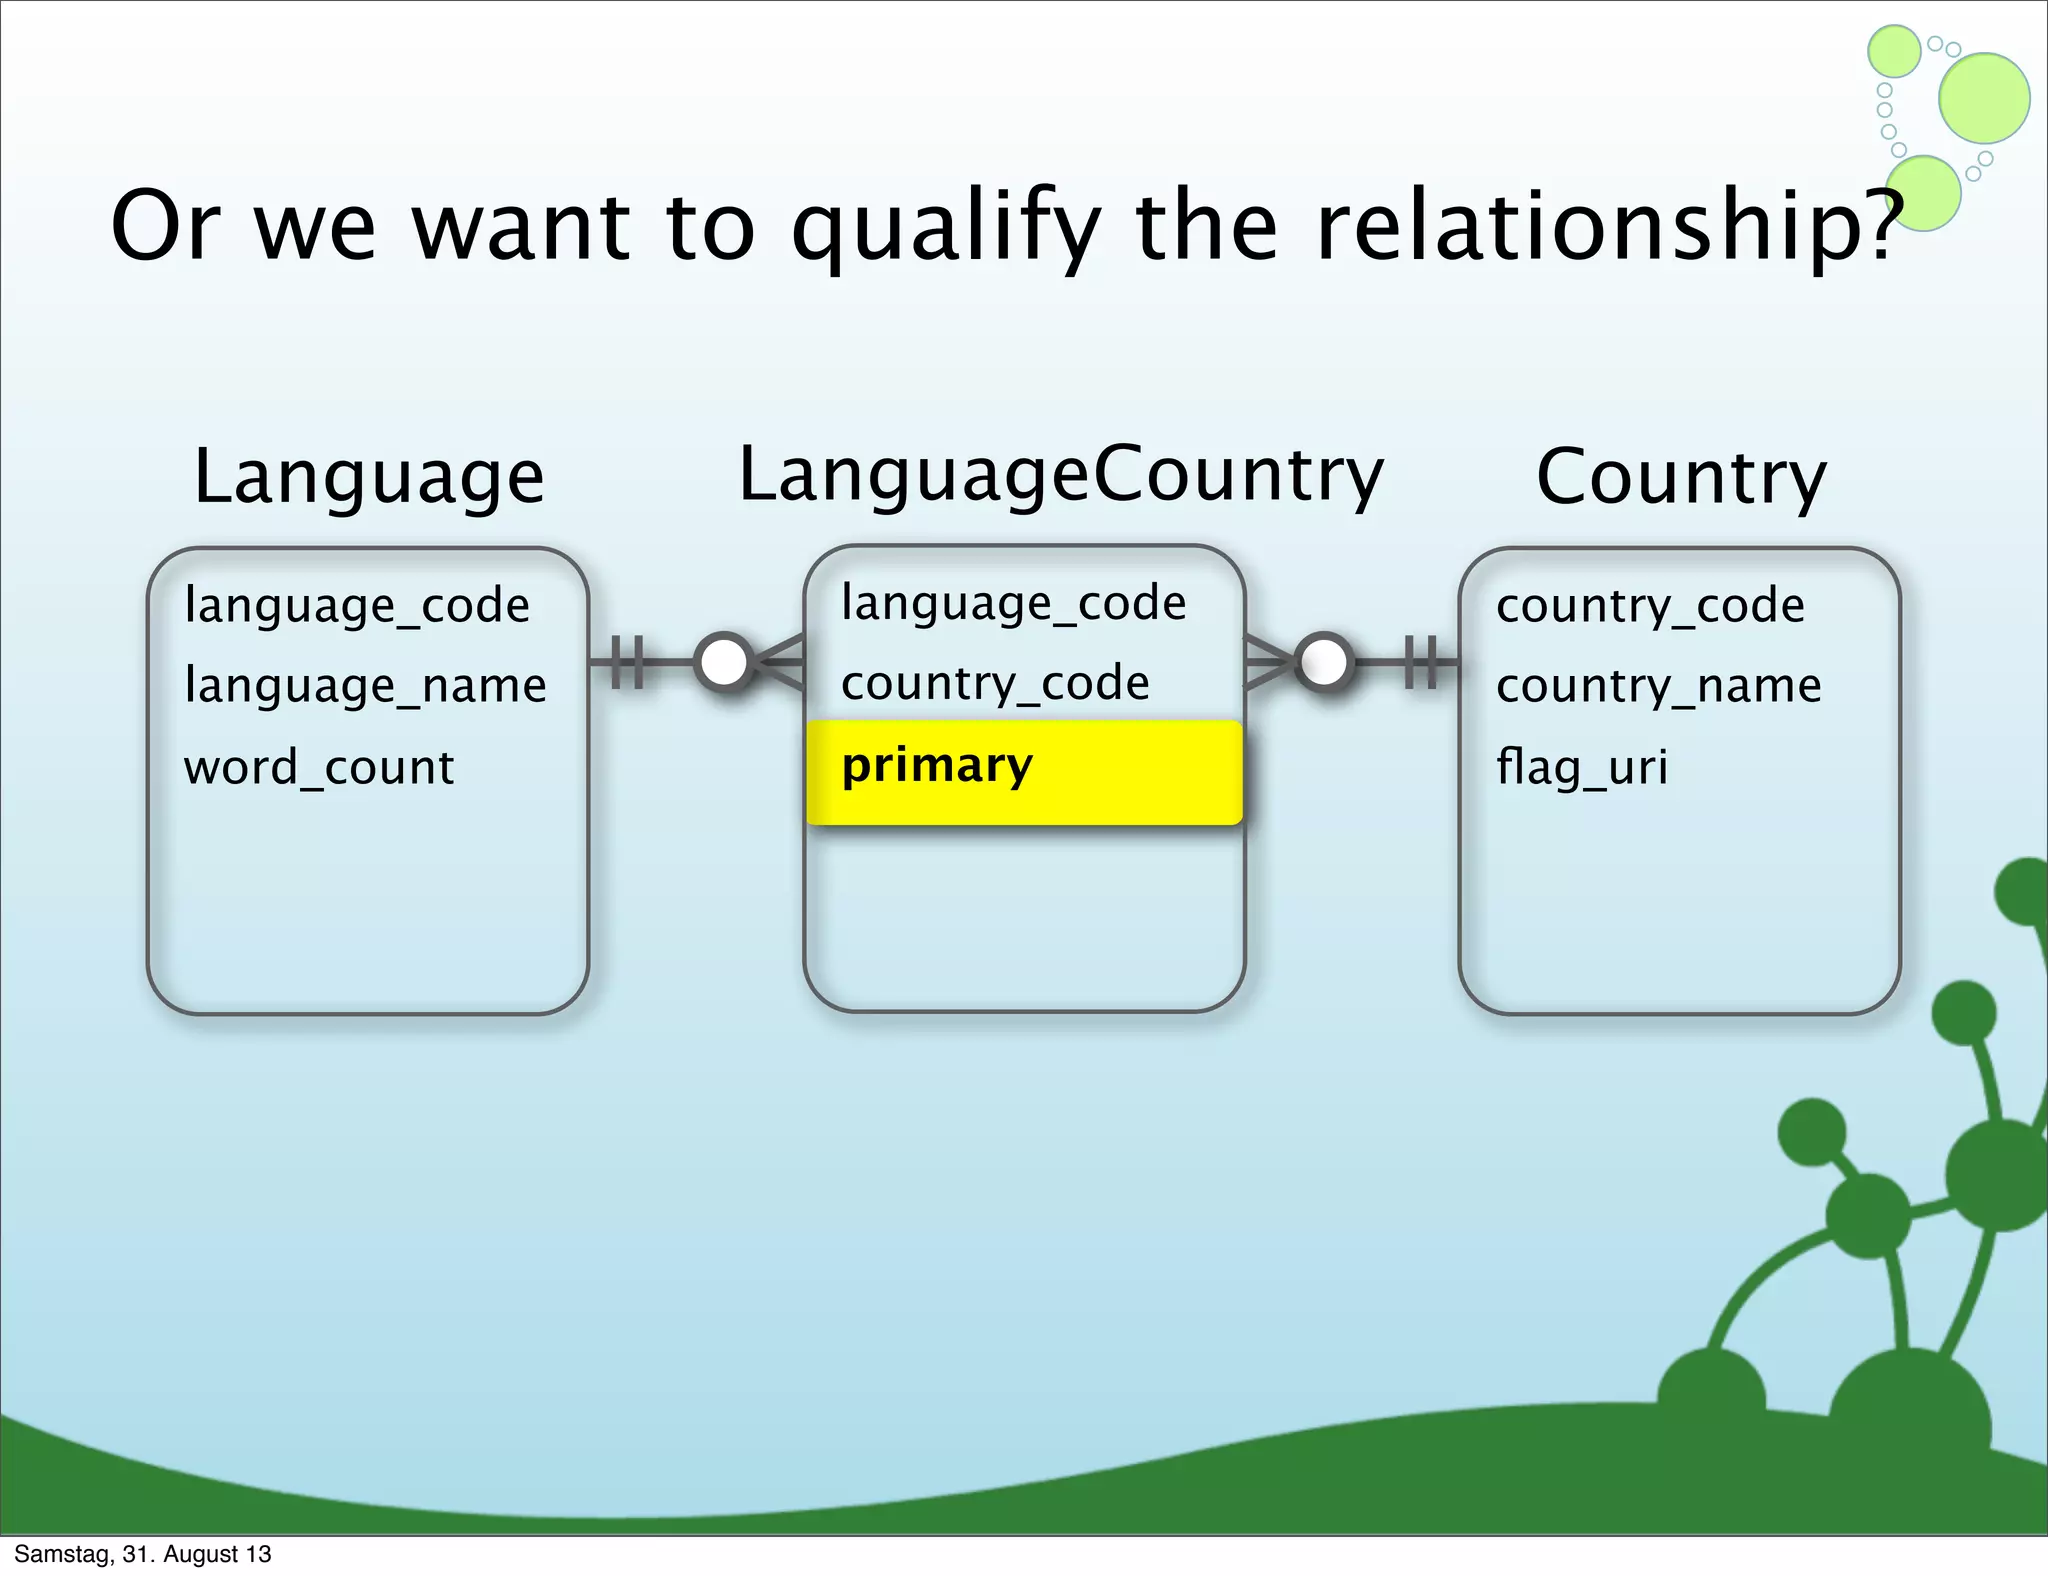
Challenges of creating effective nodes and relationships in graph databases, including normalization.
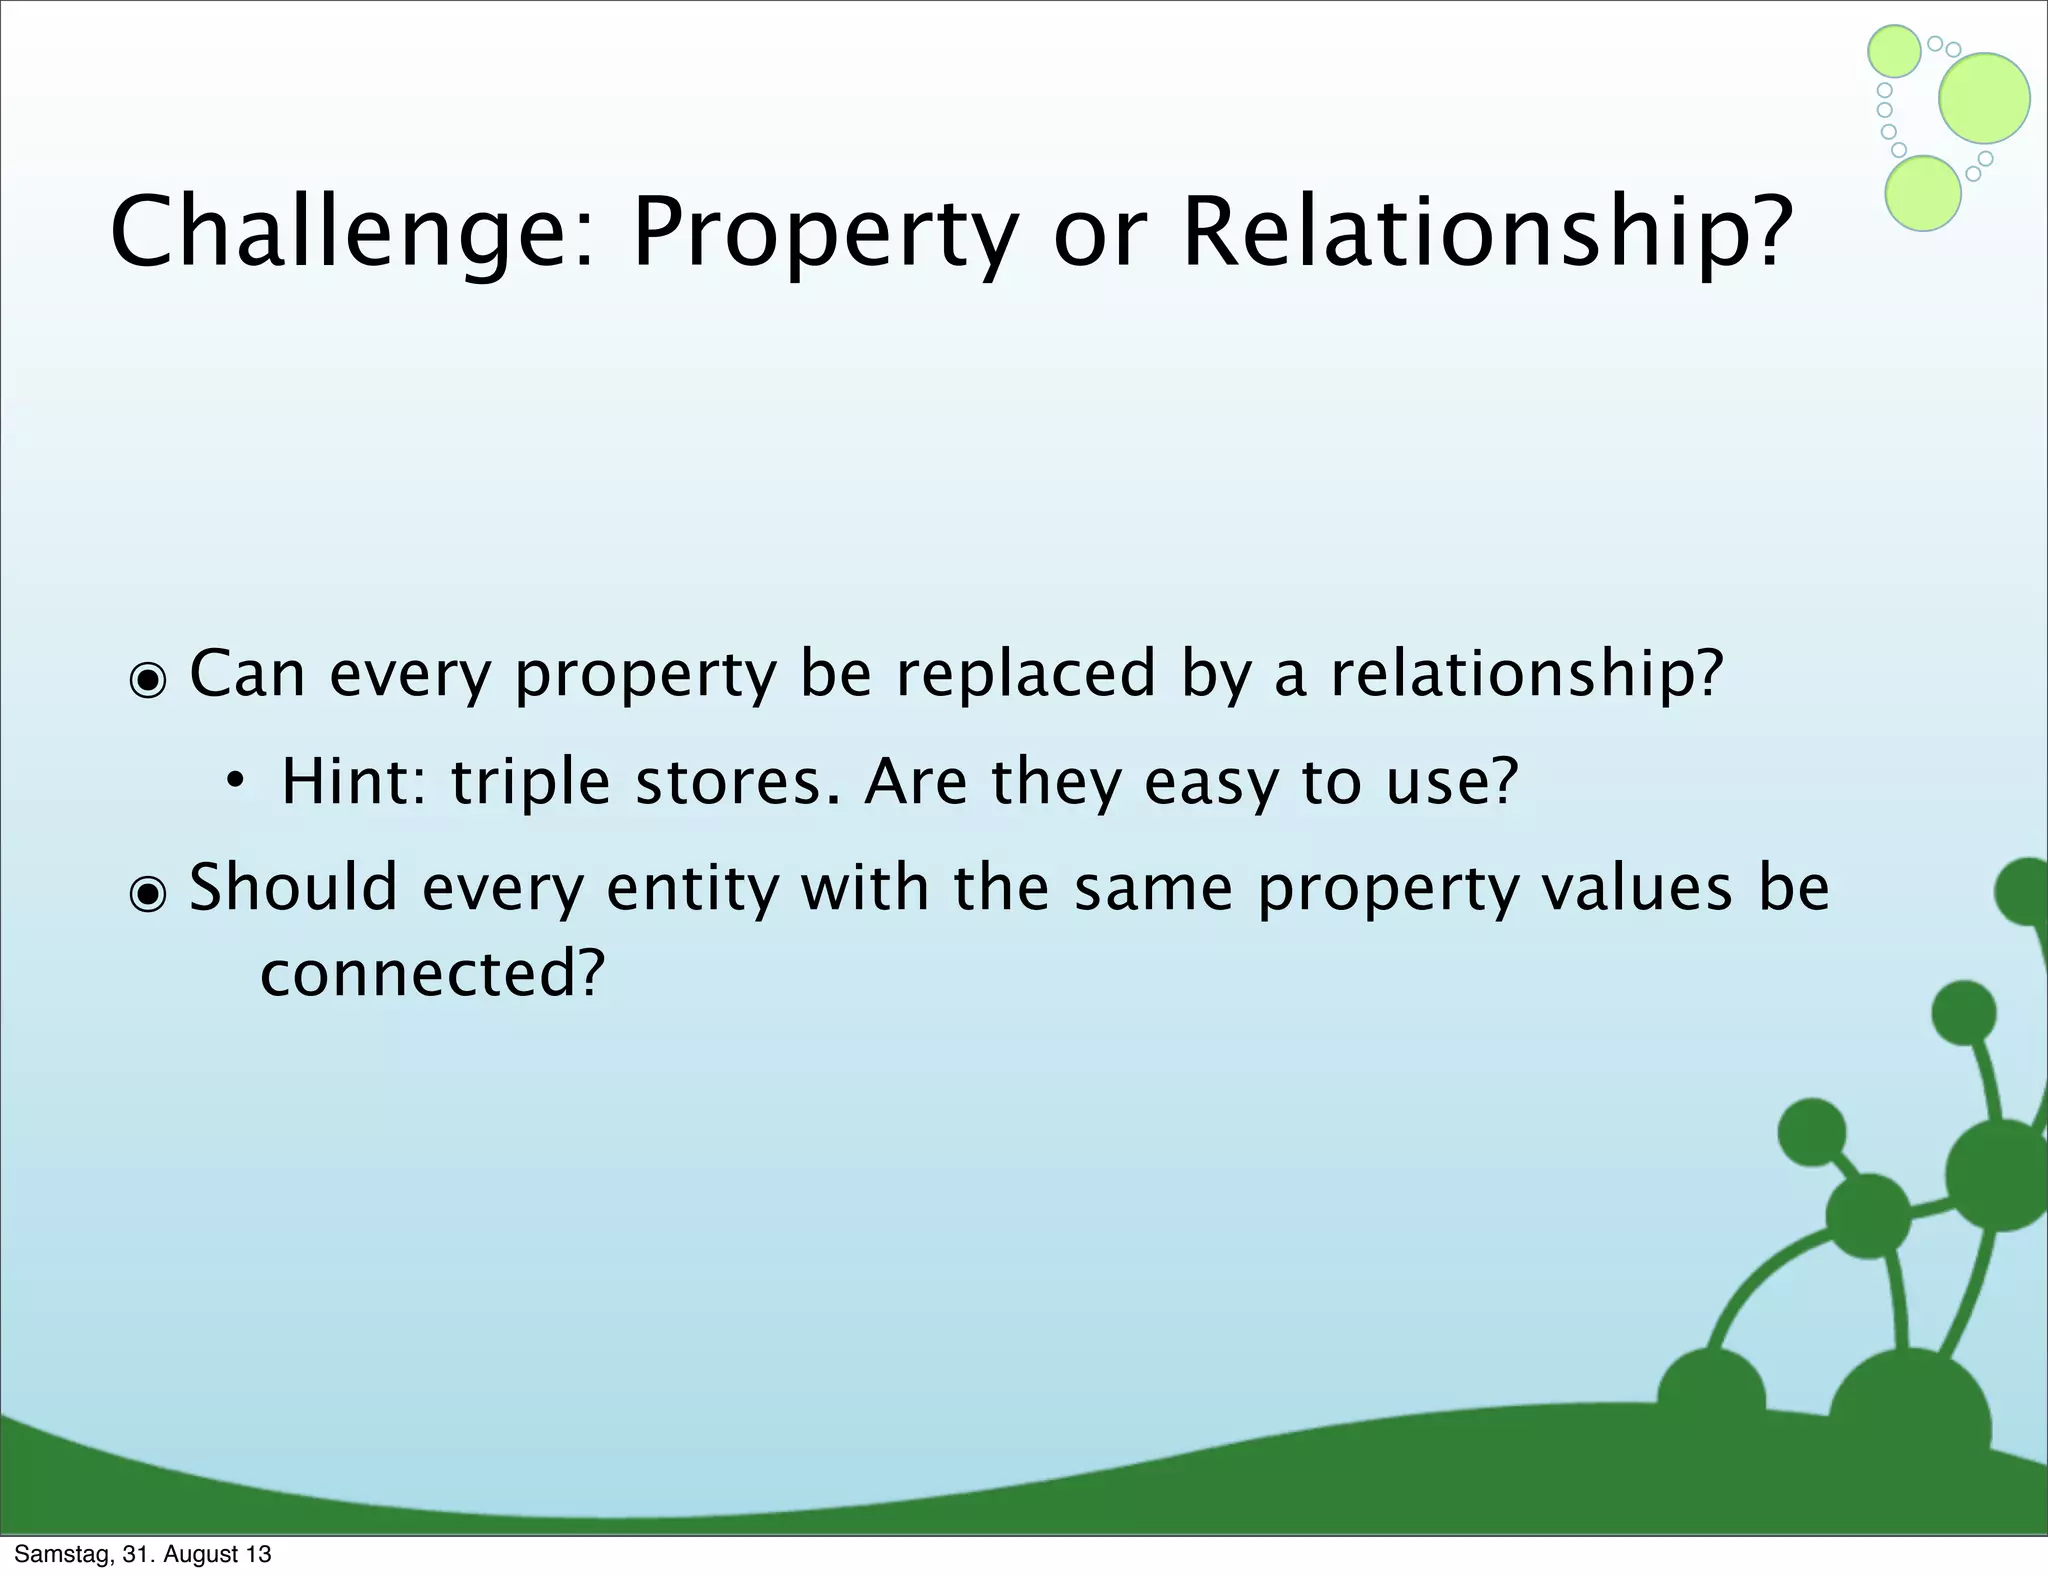
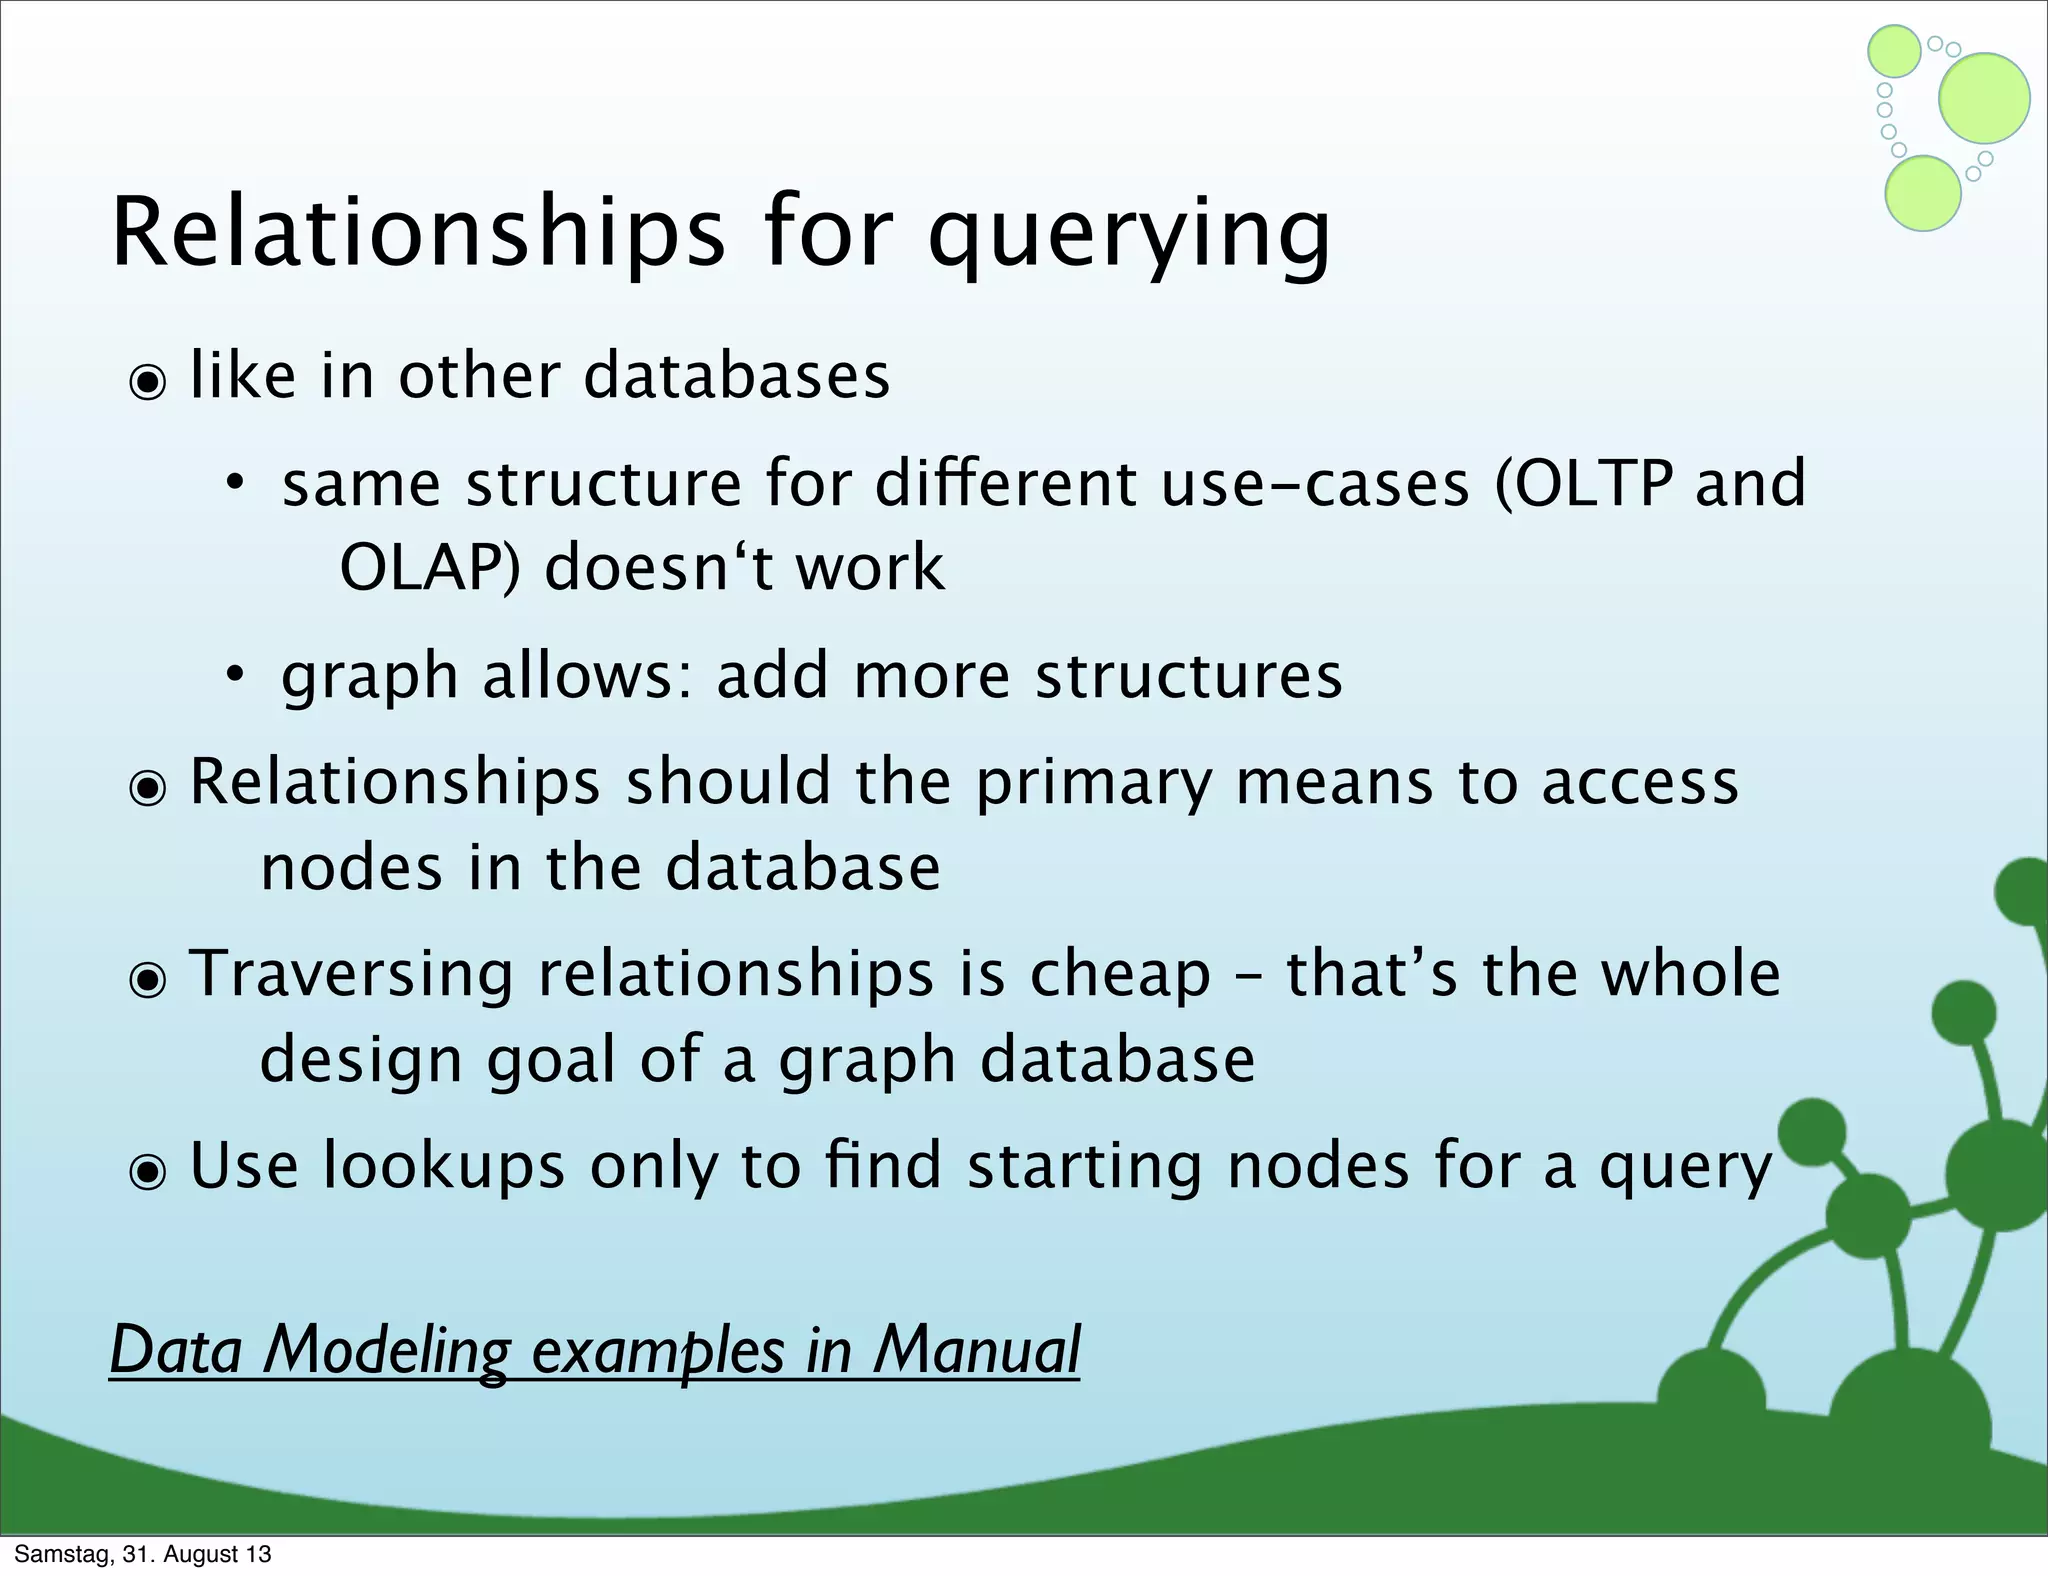
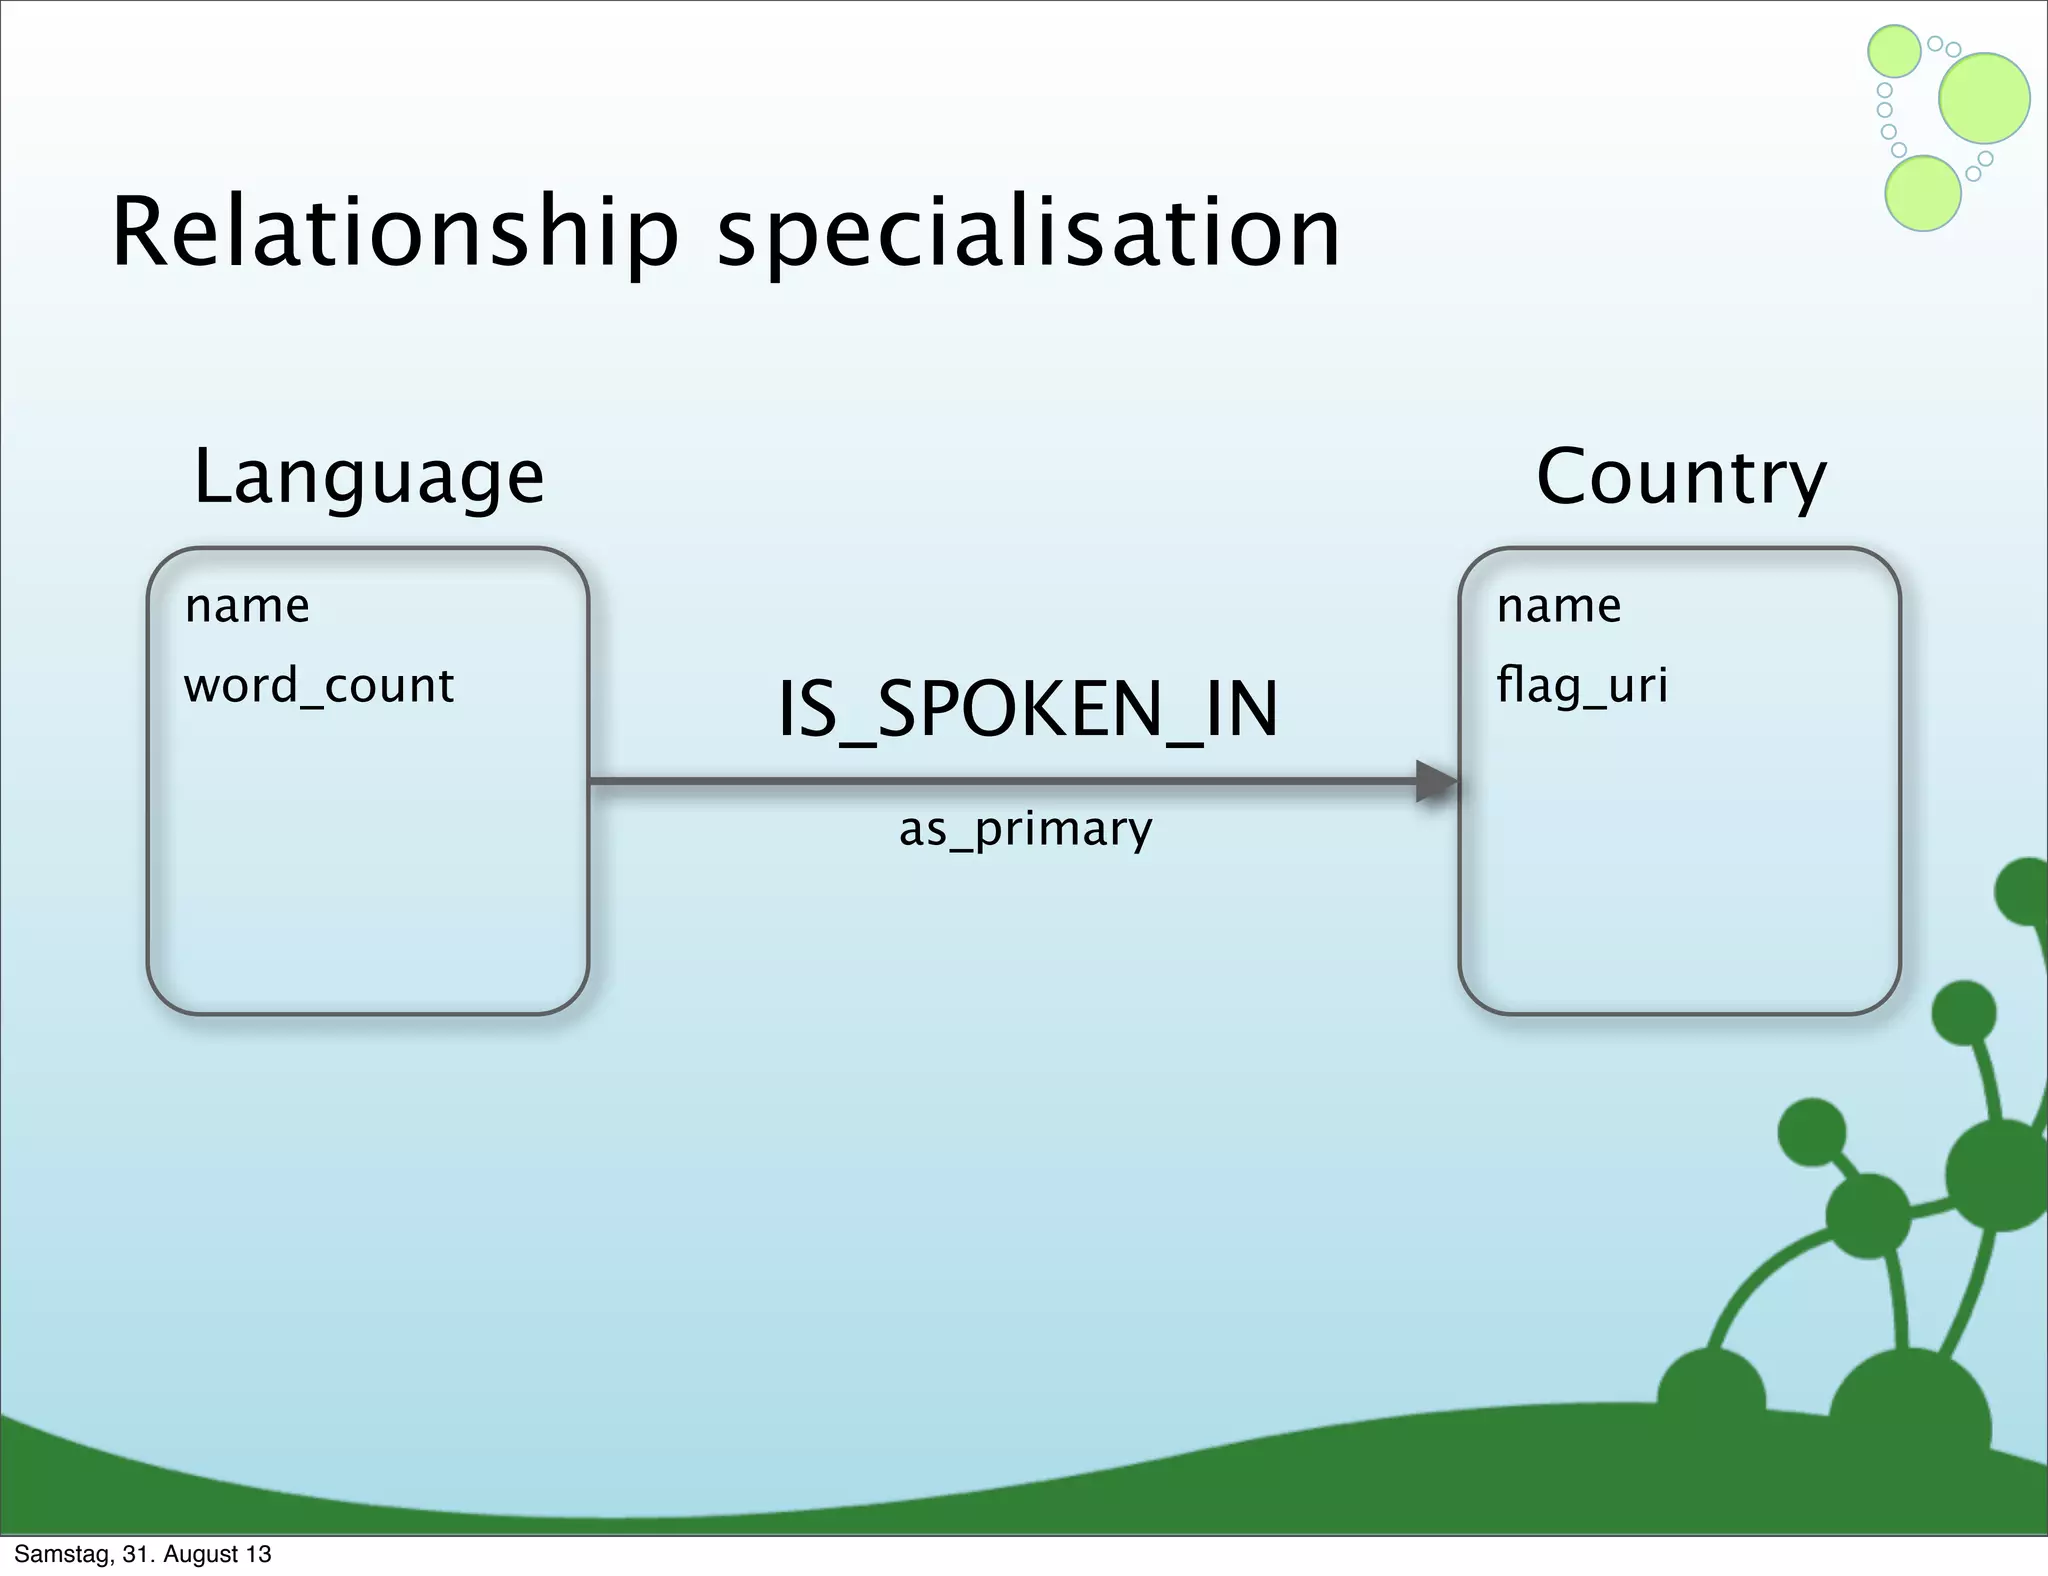
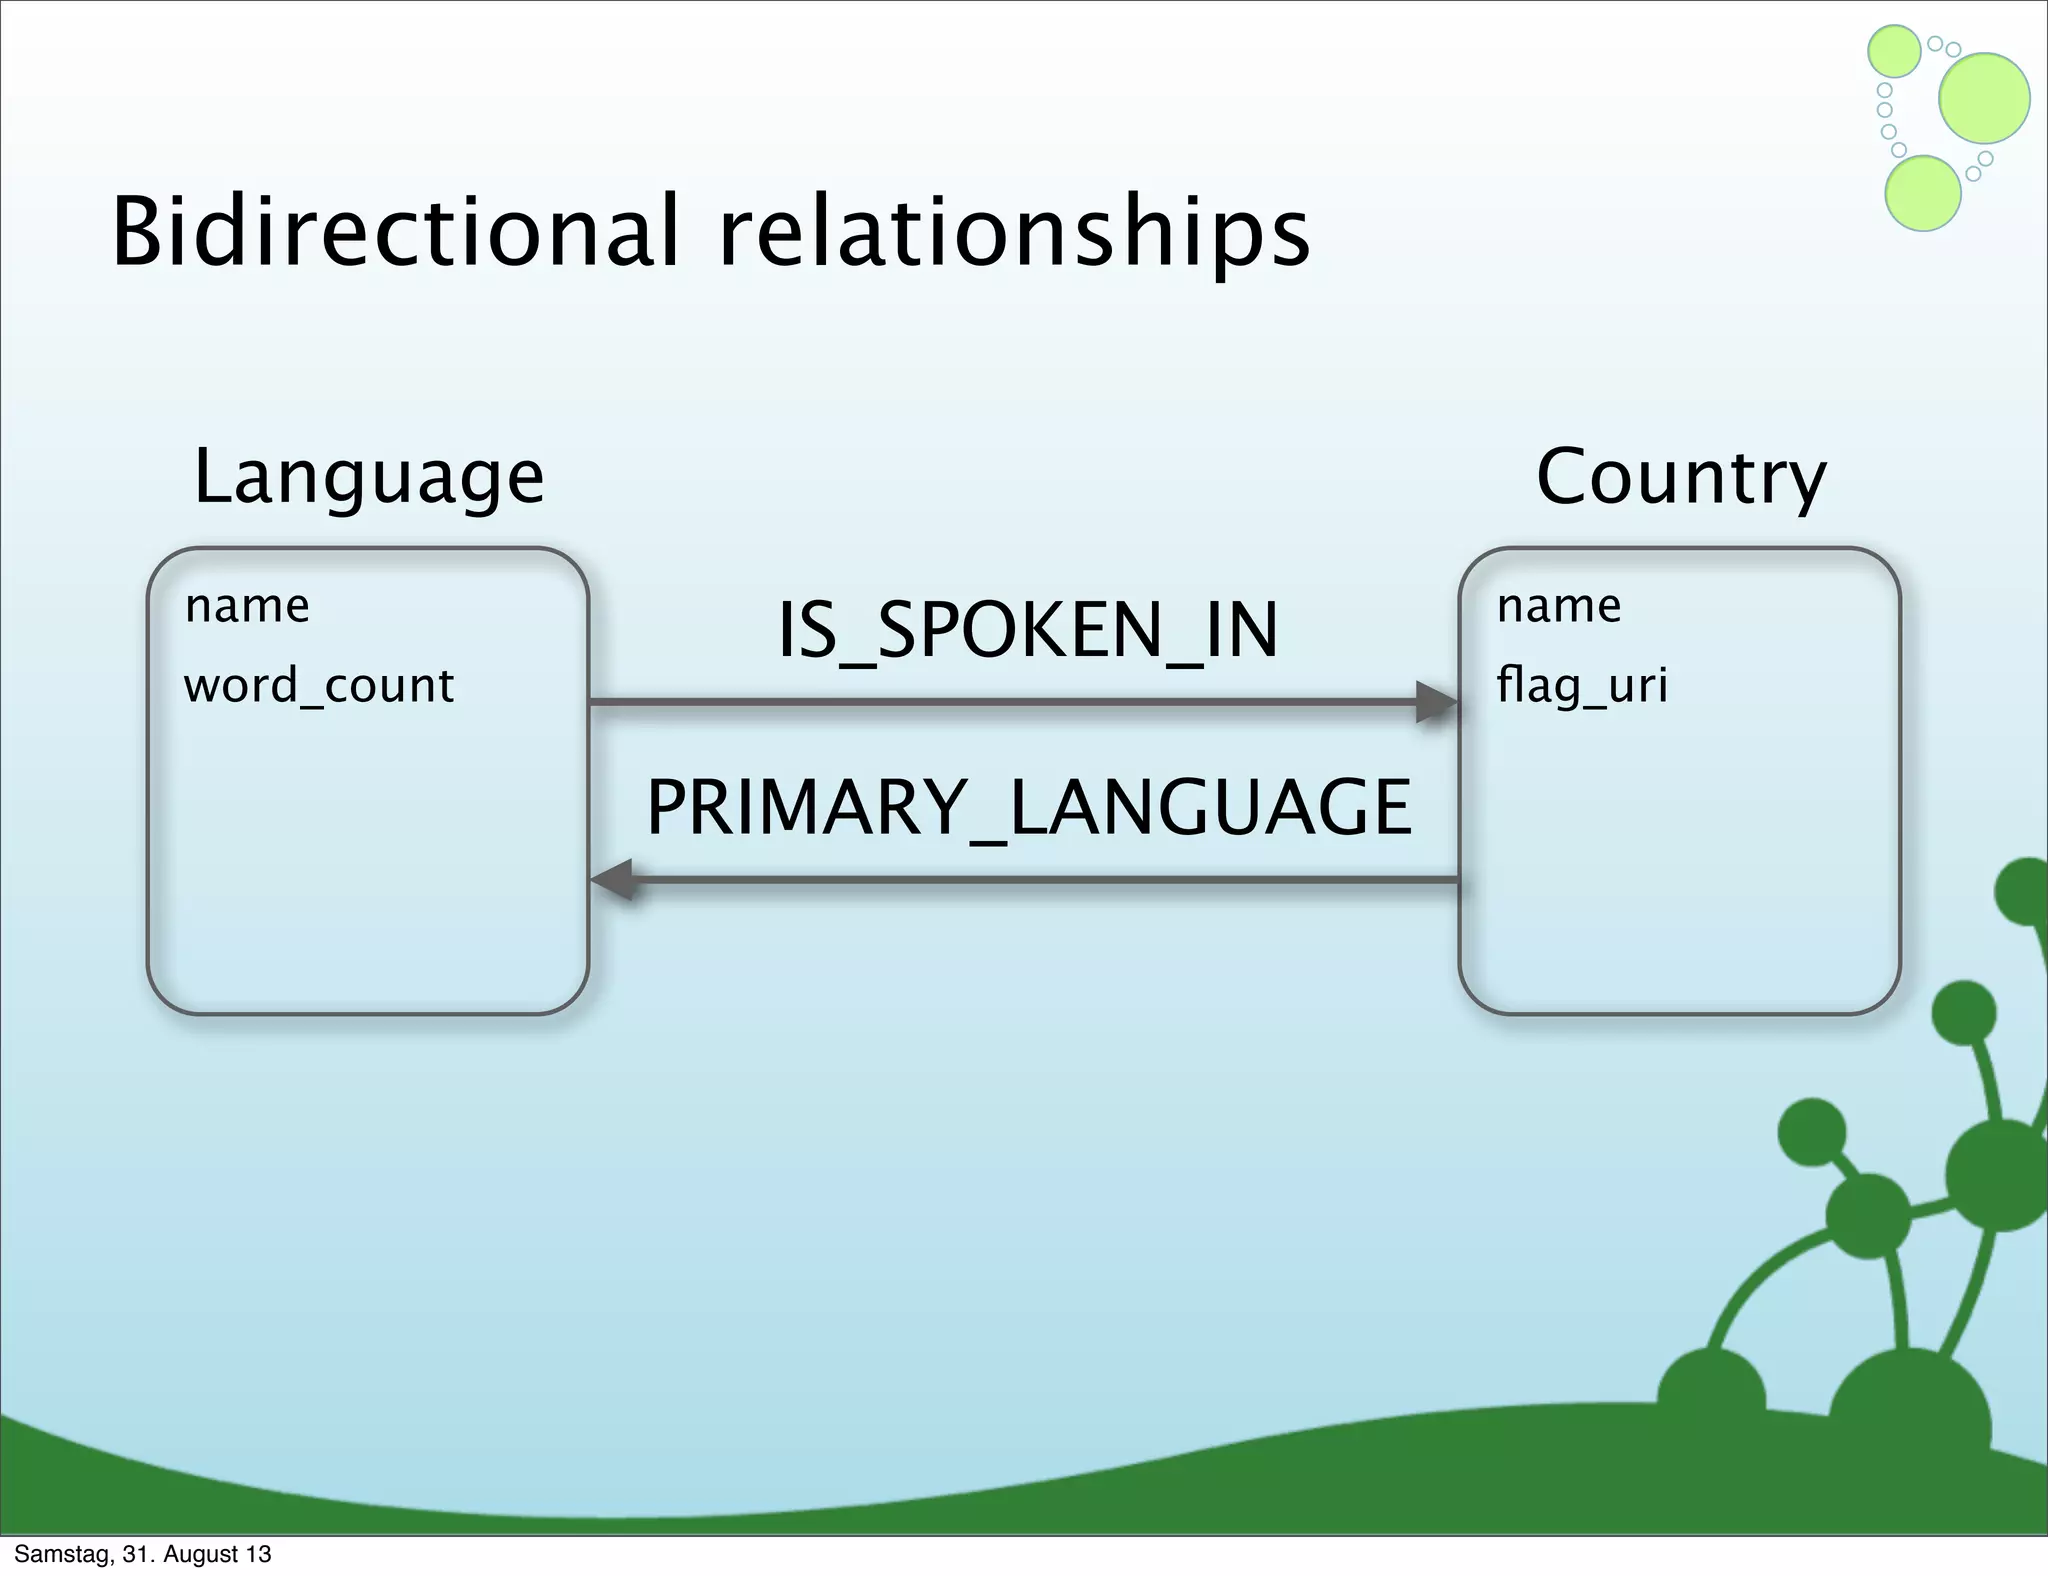
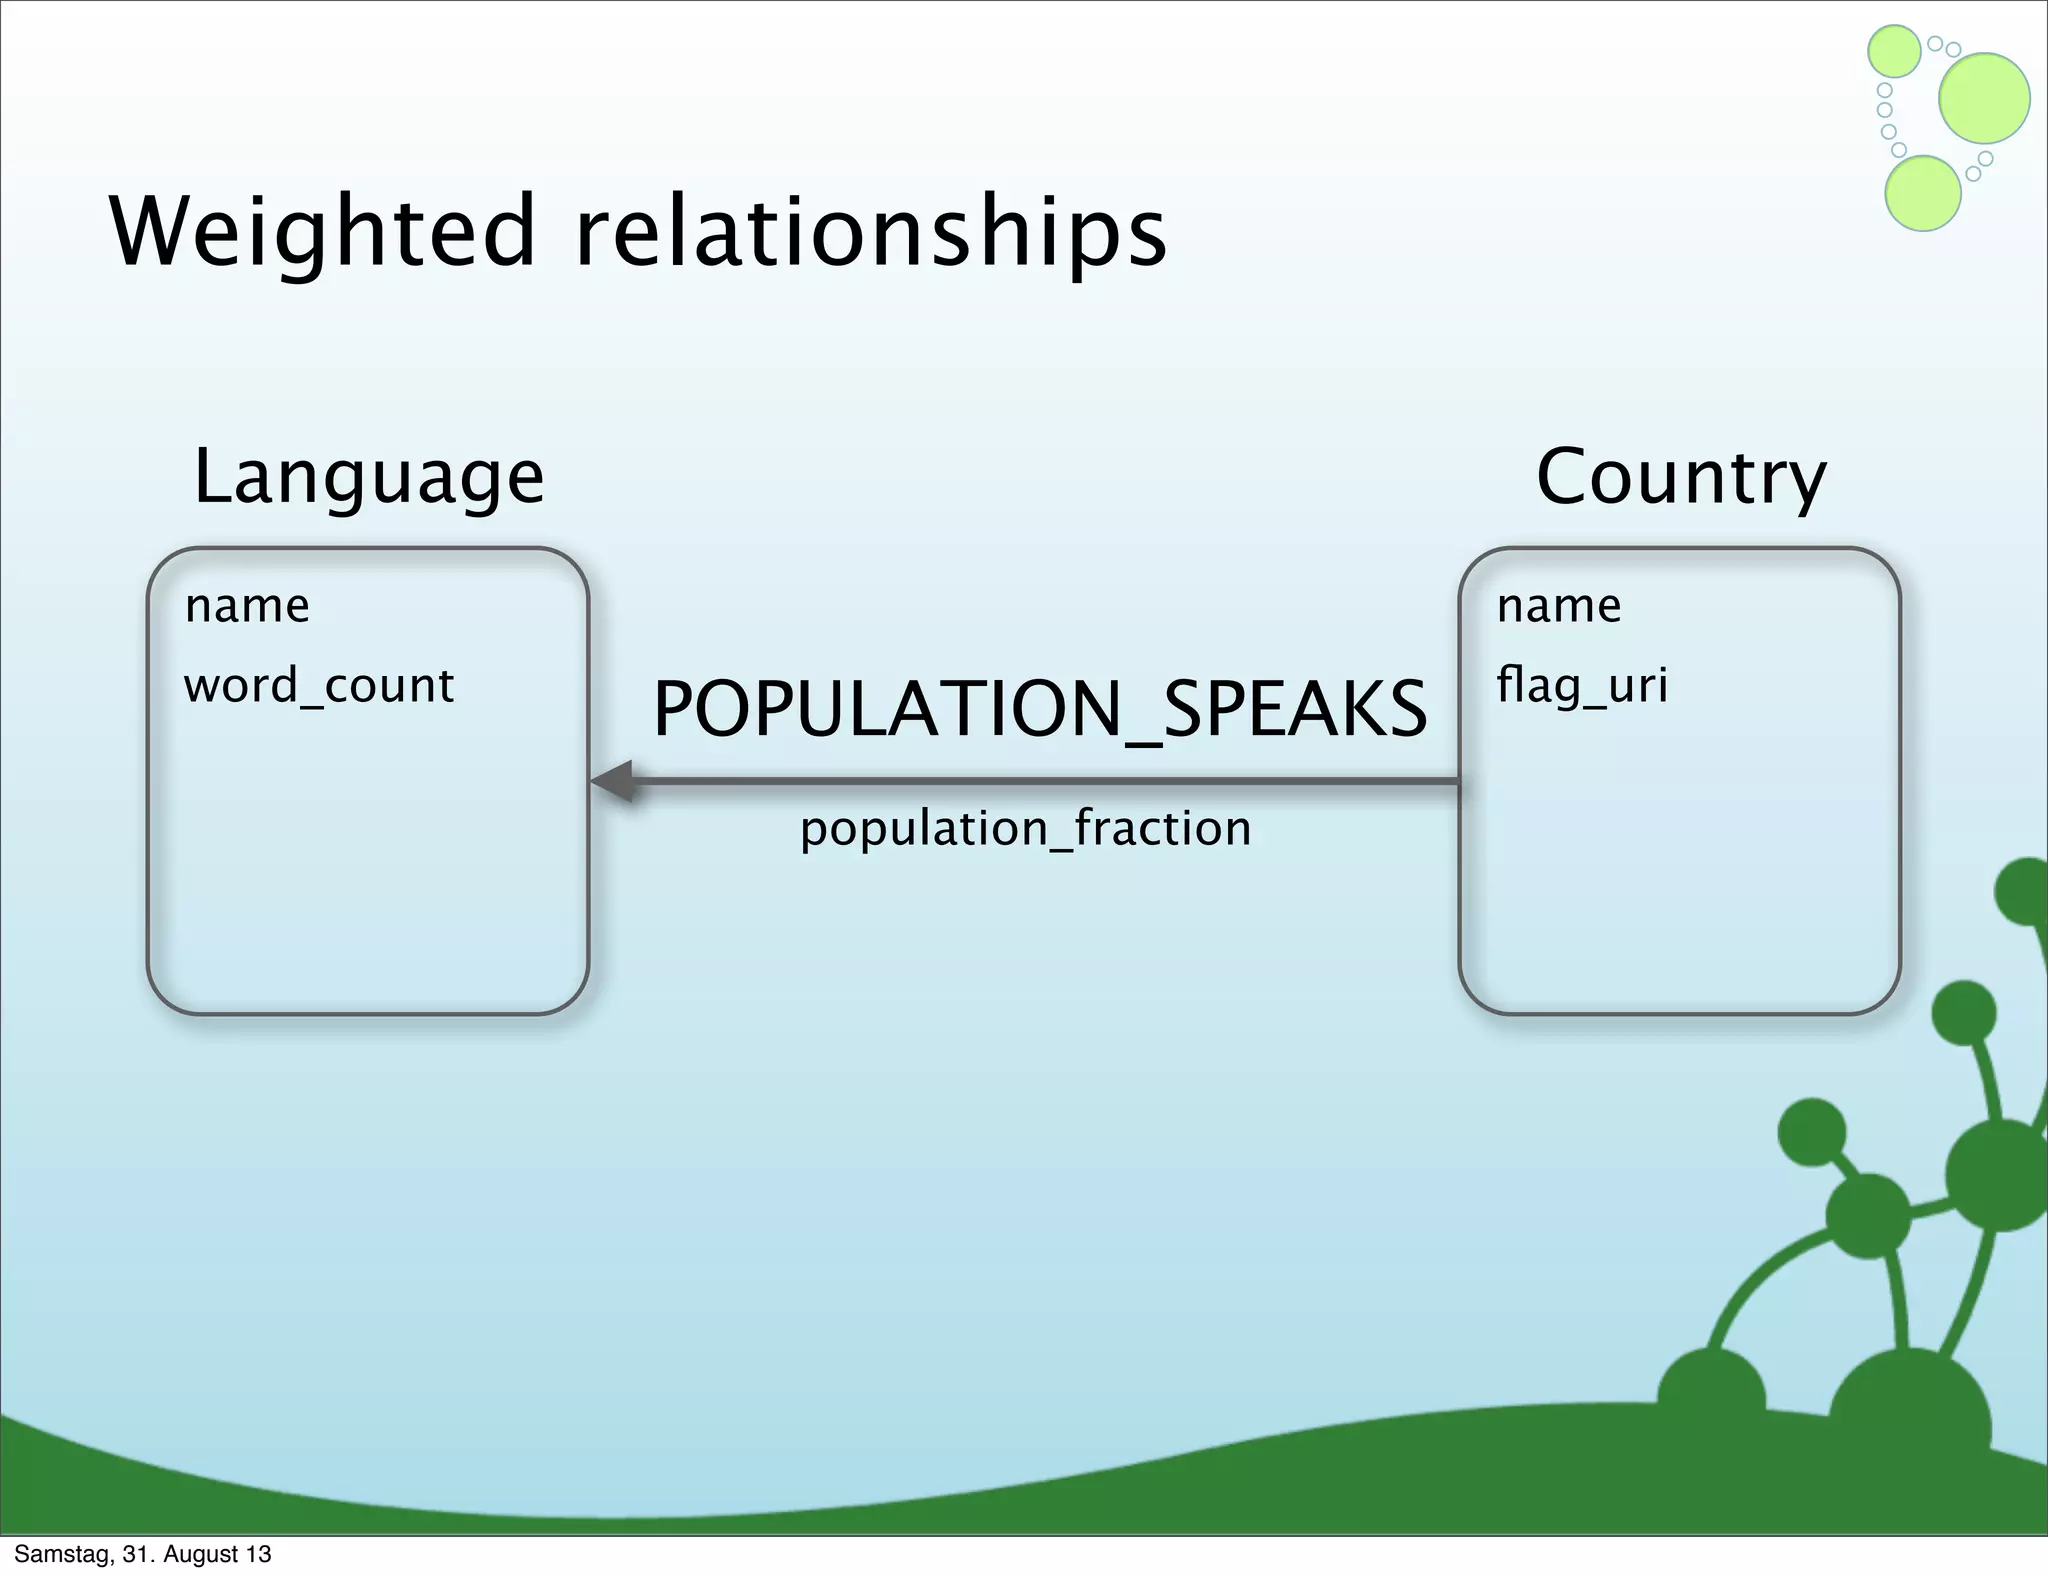
Emphasizes using relationships for efficient data access and querying structures in a graph.
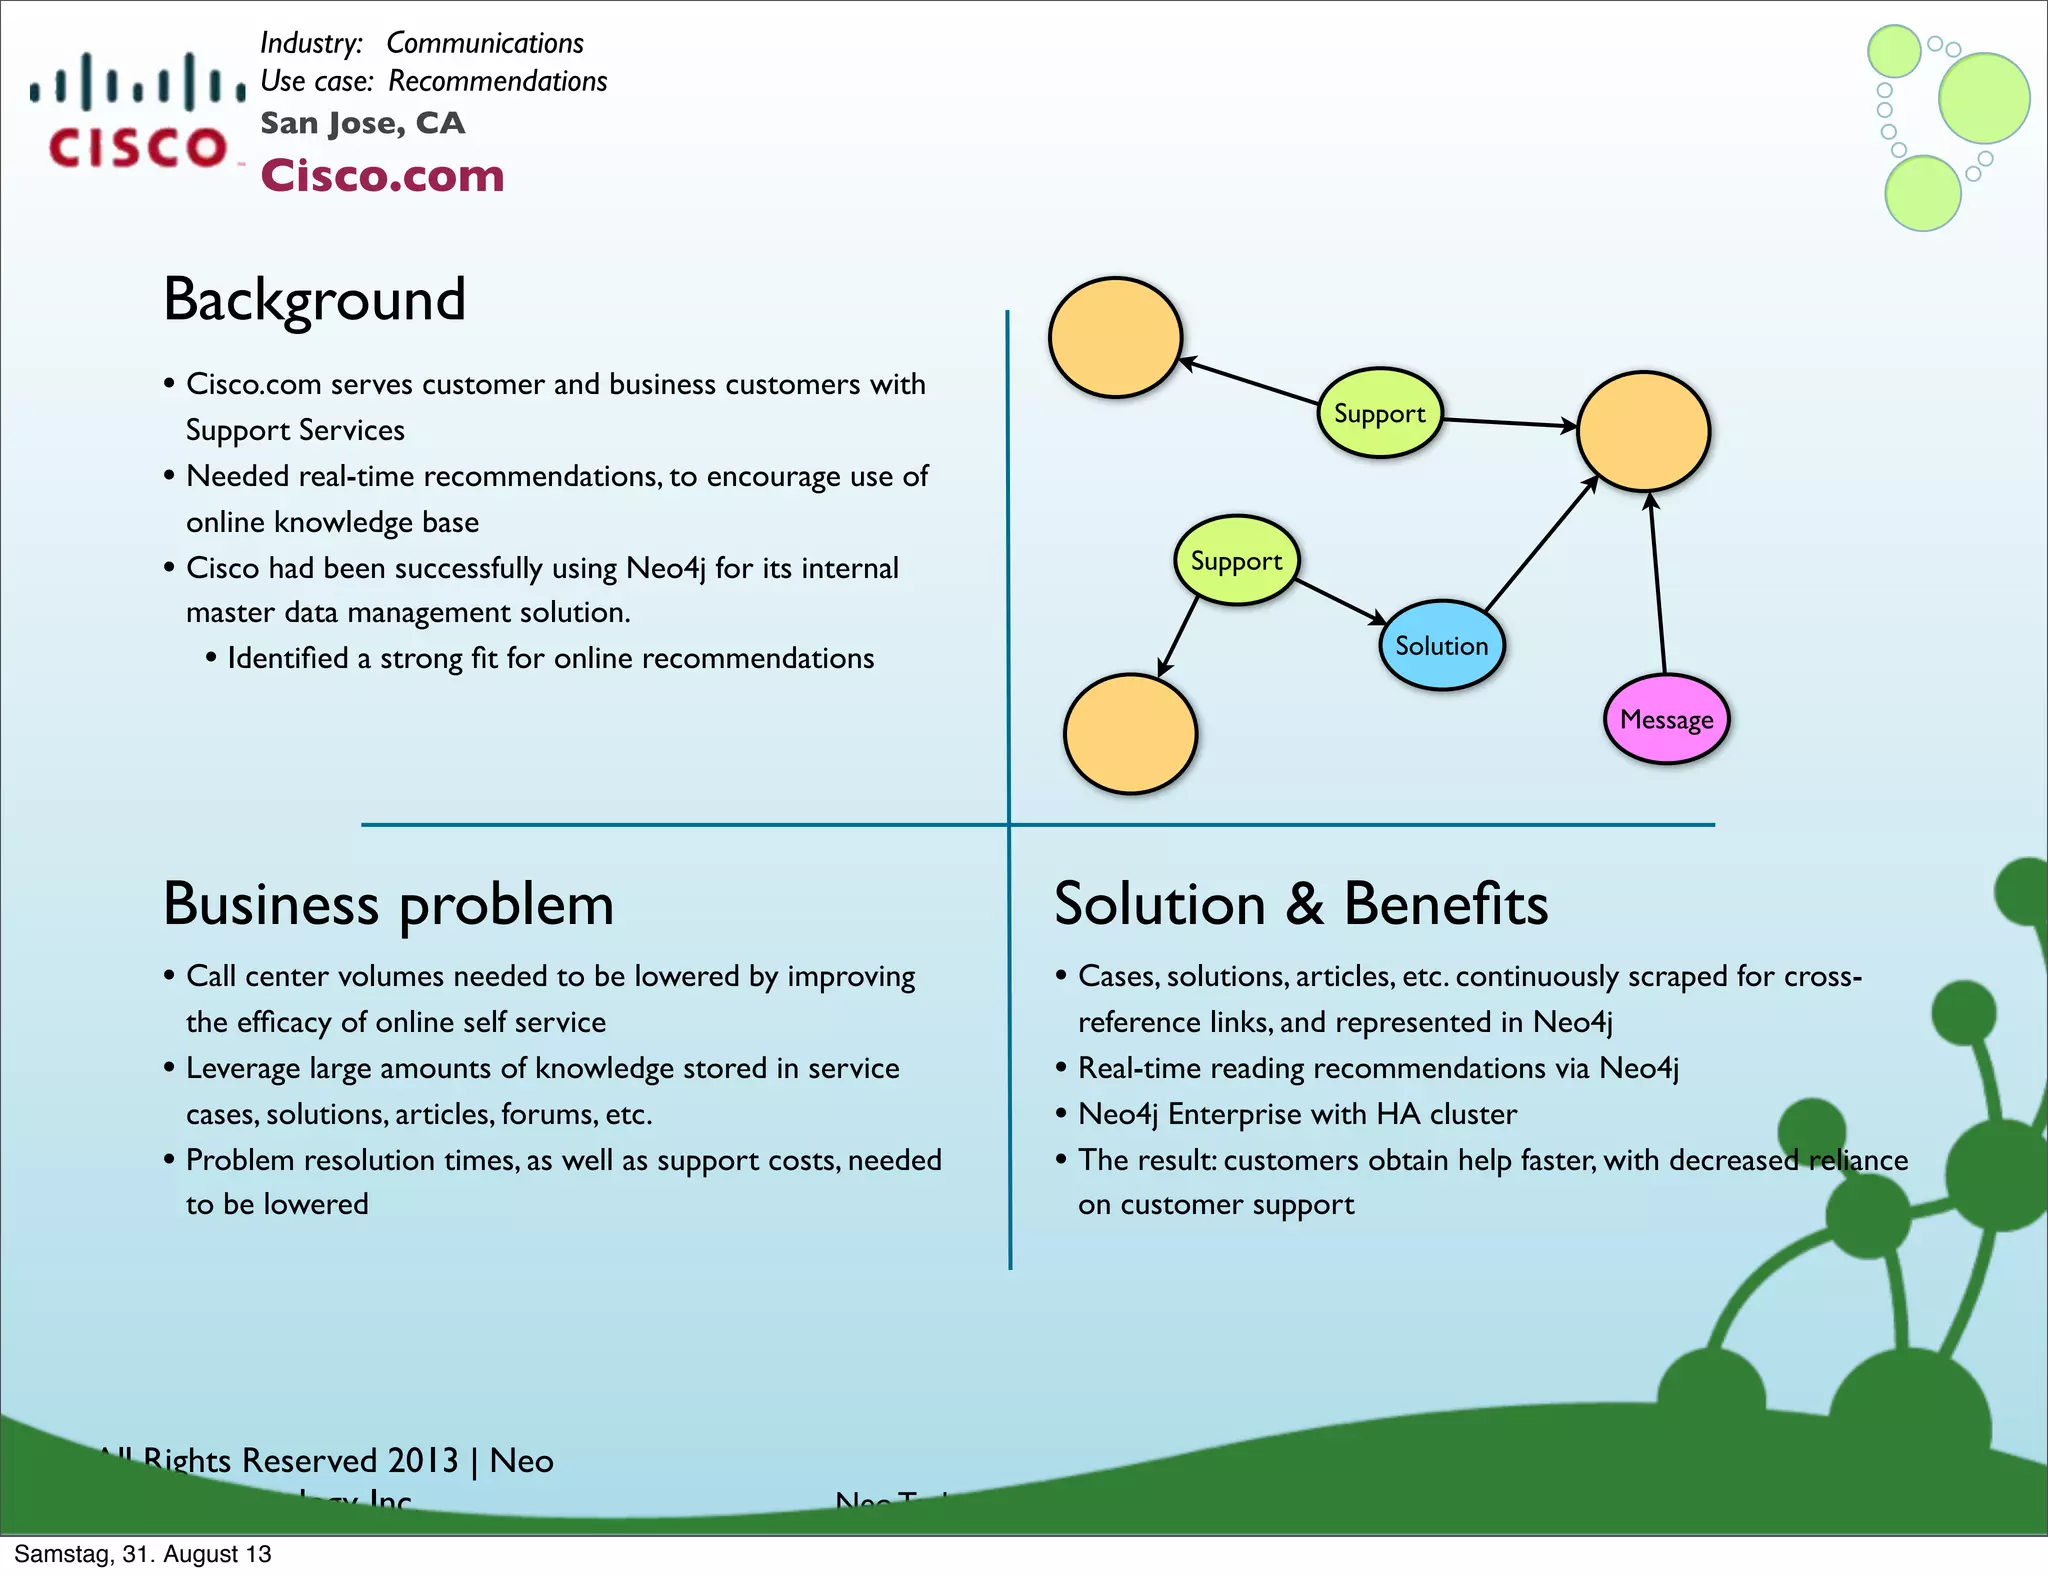
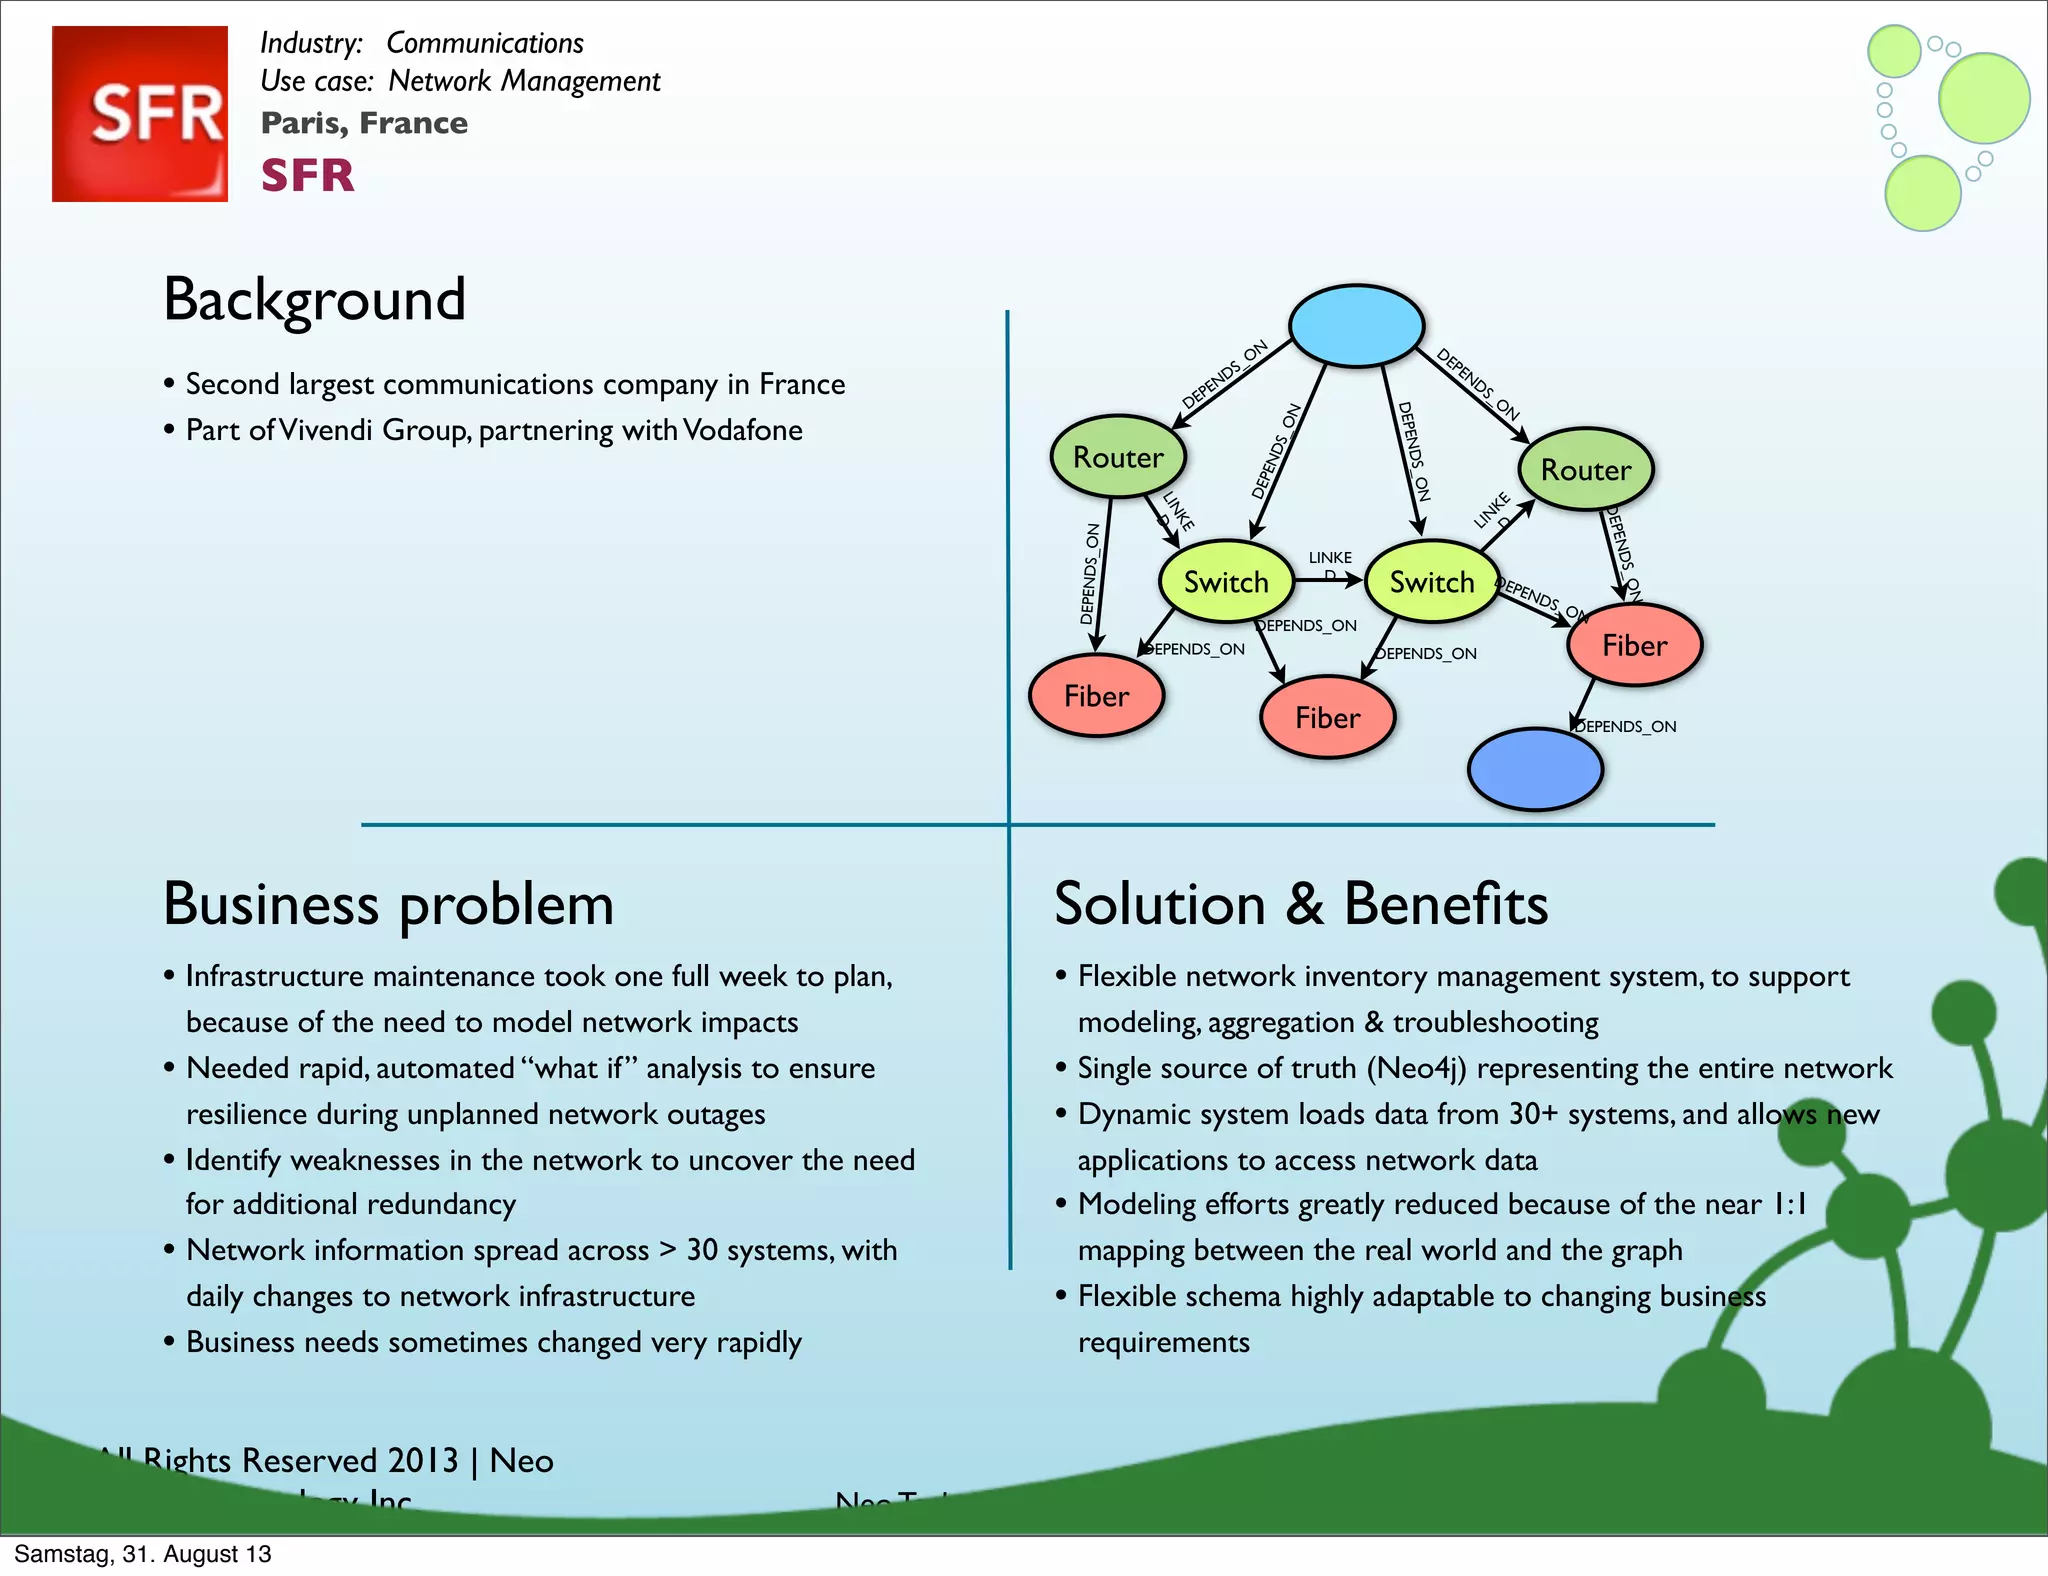
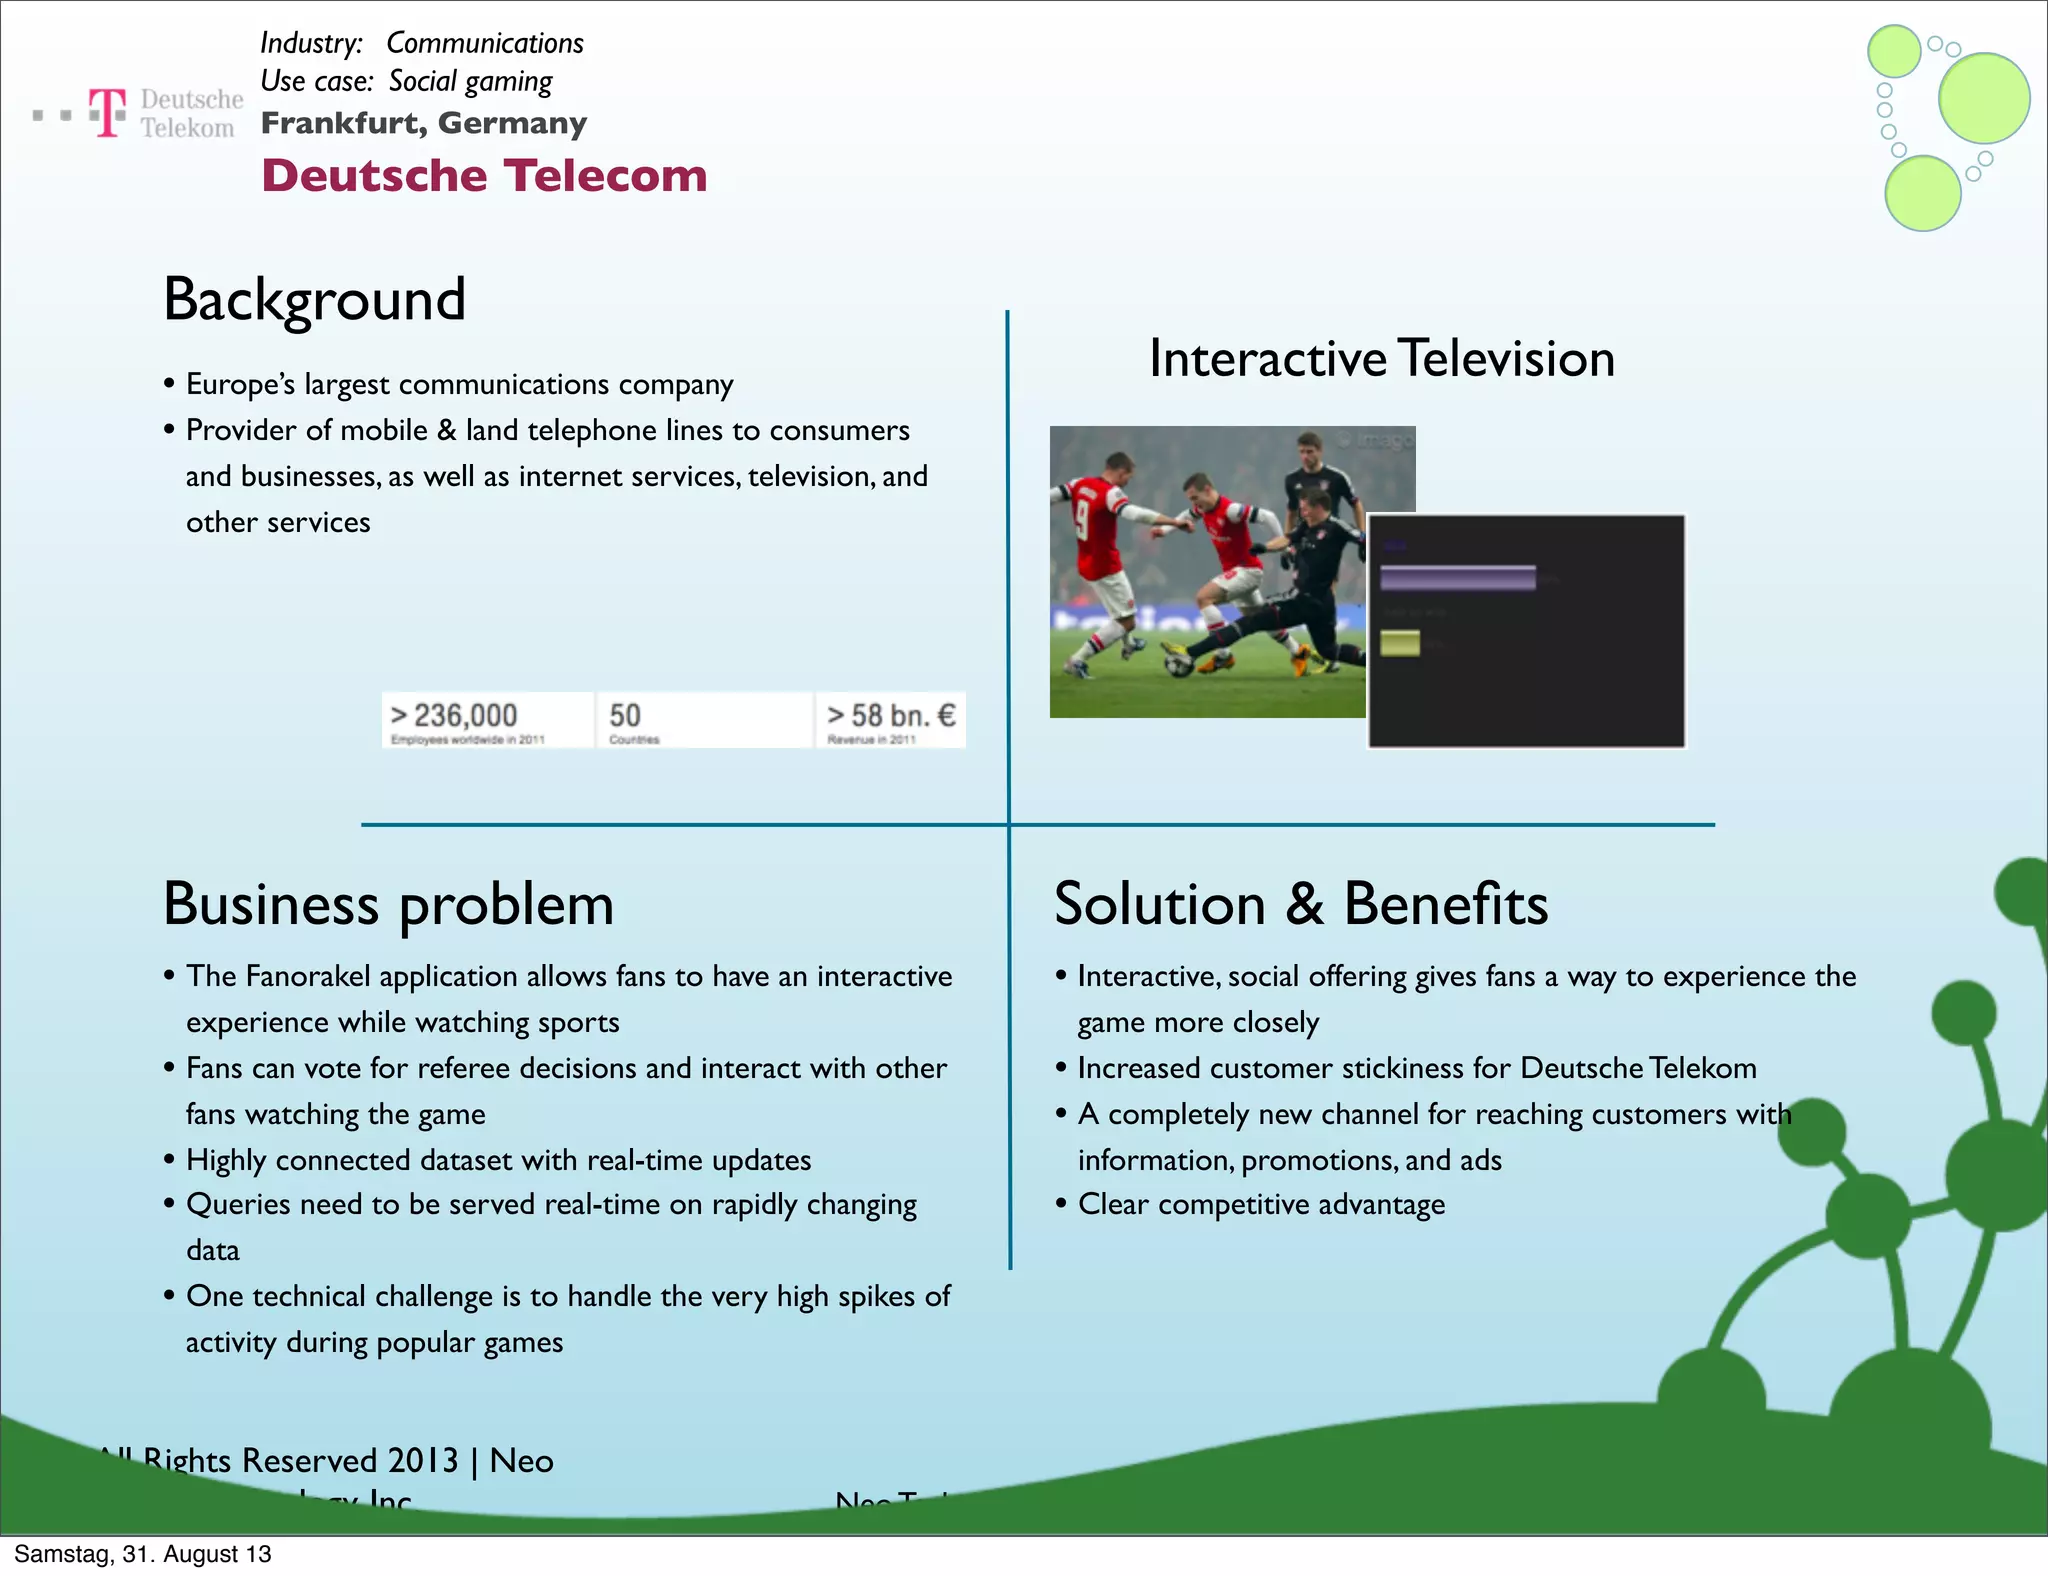
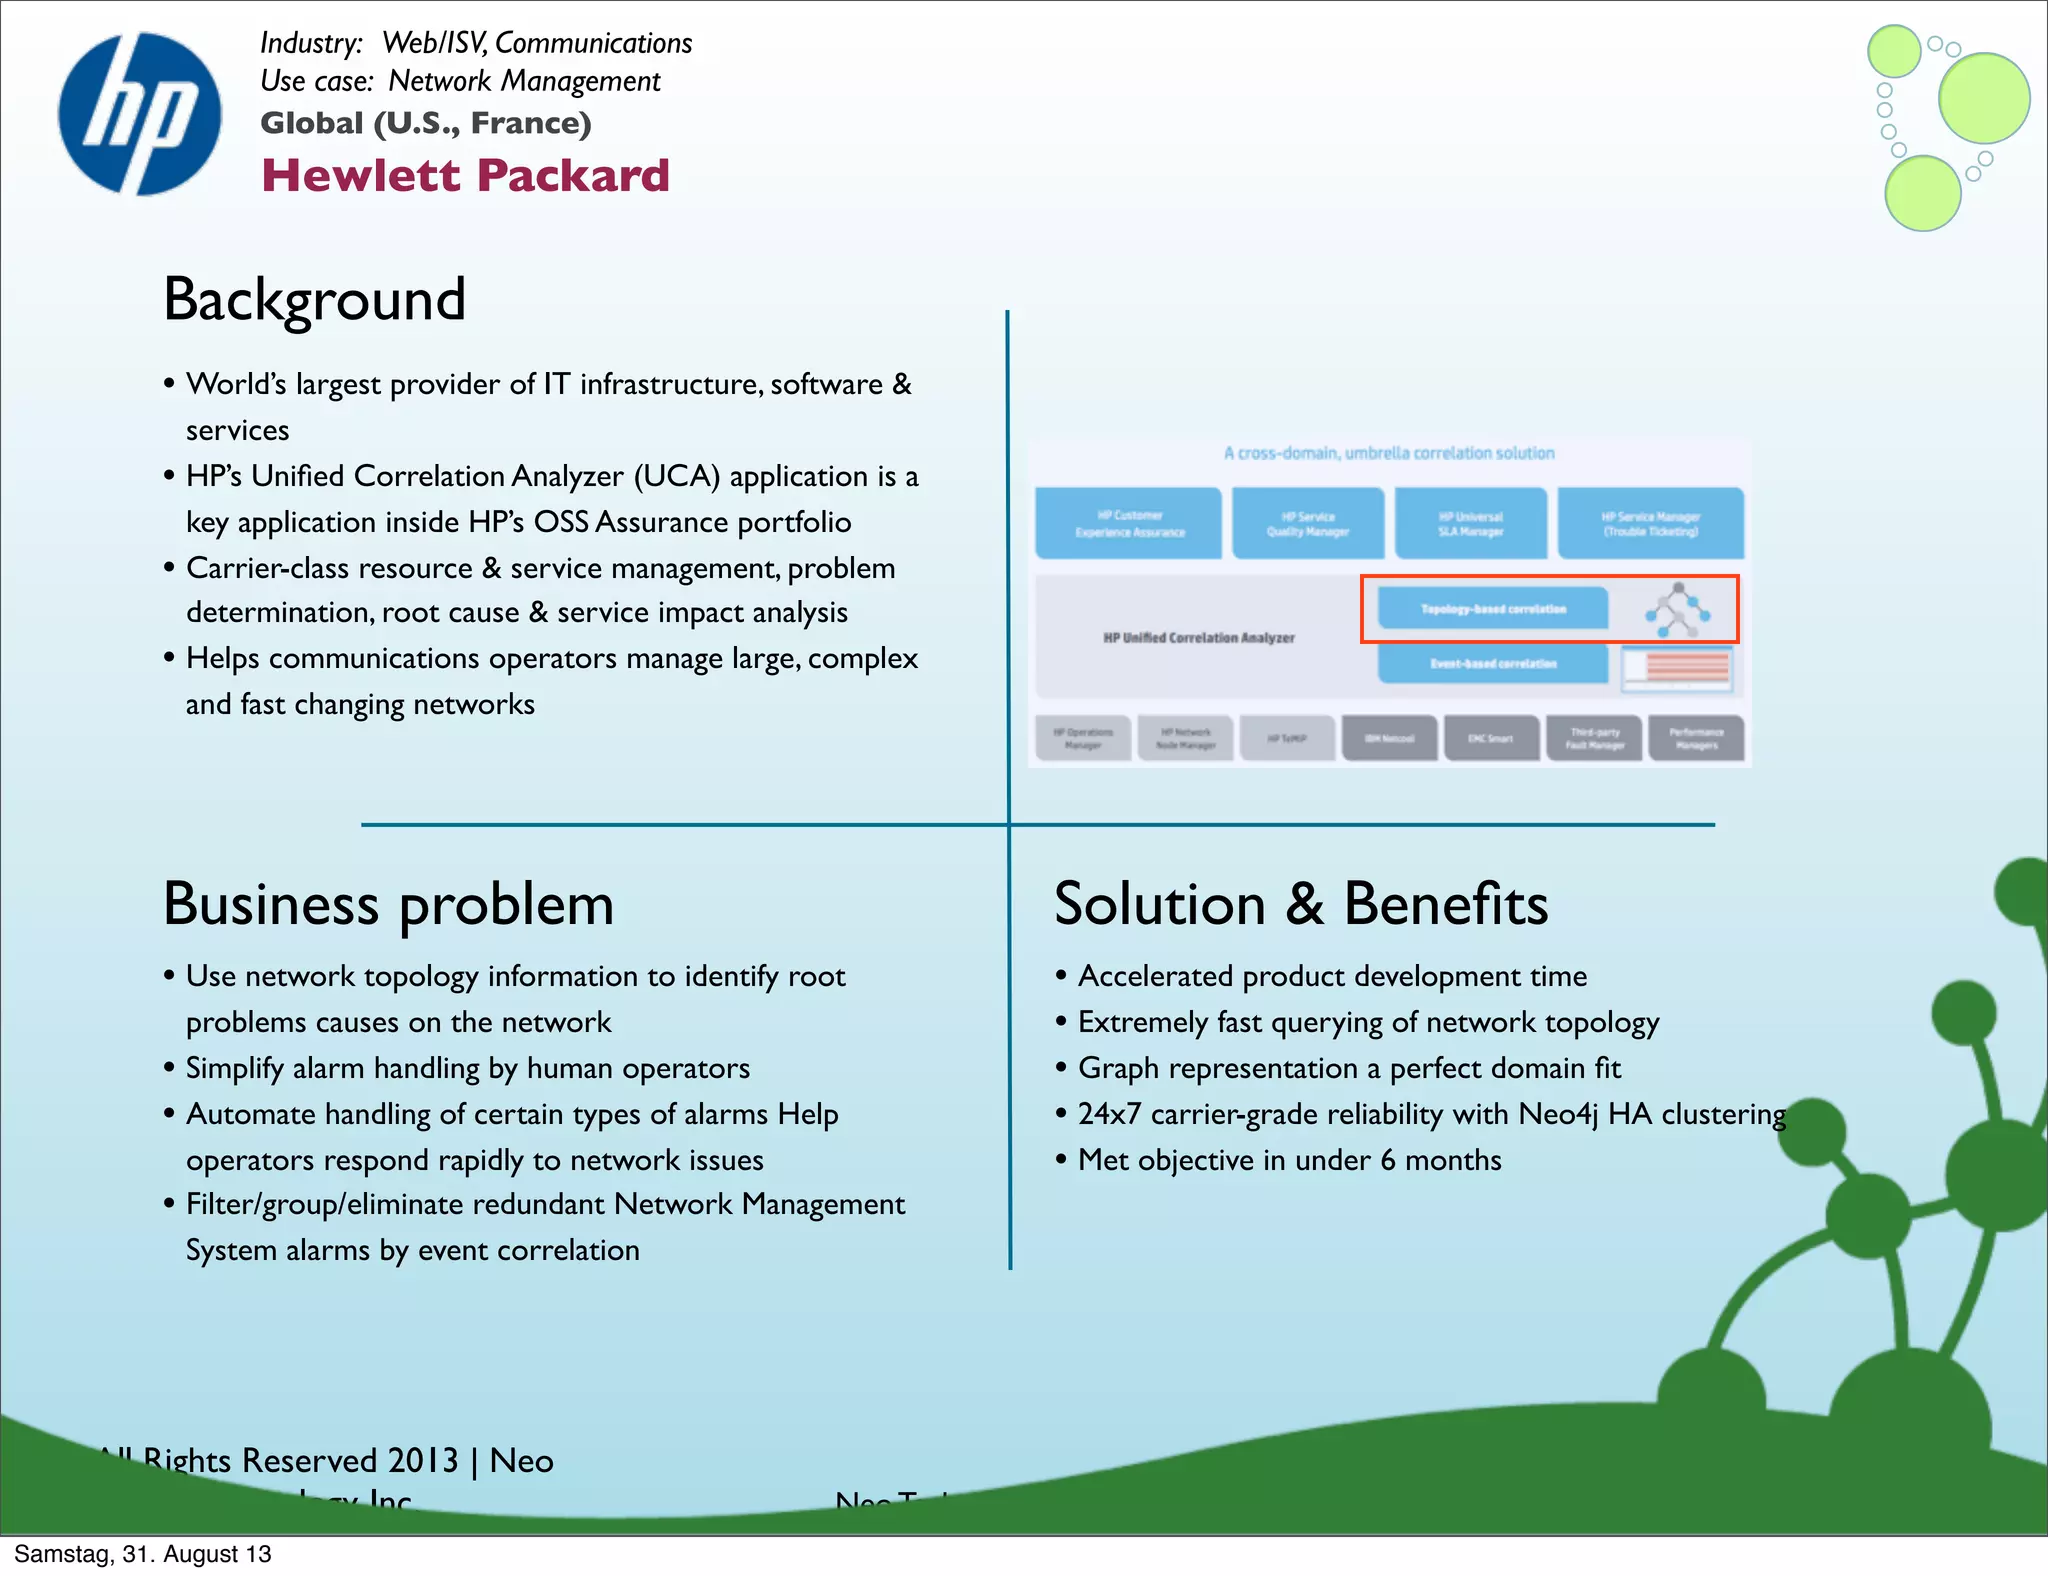
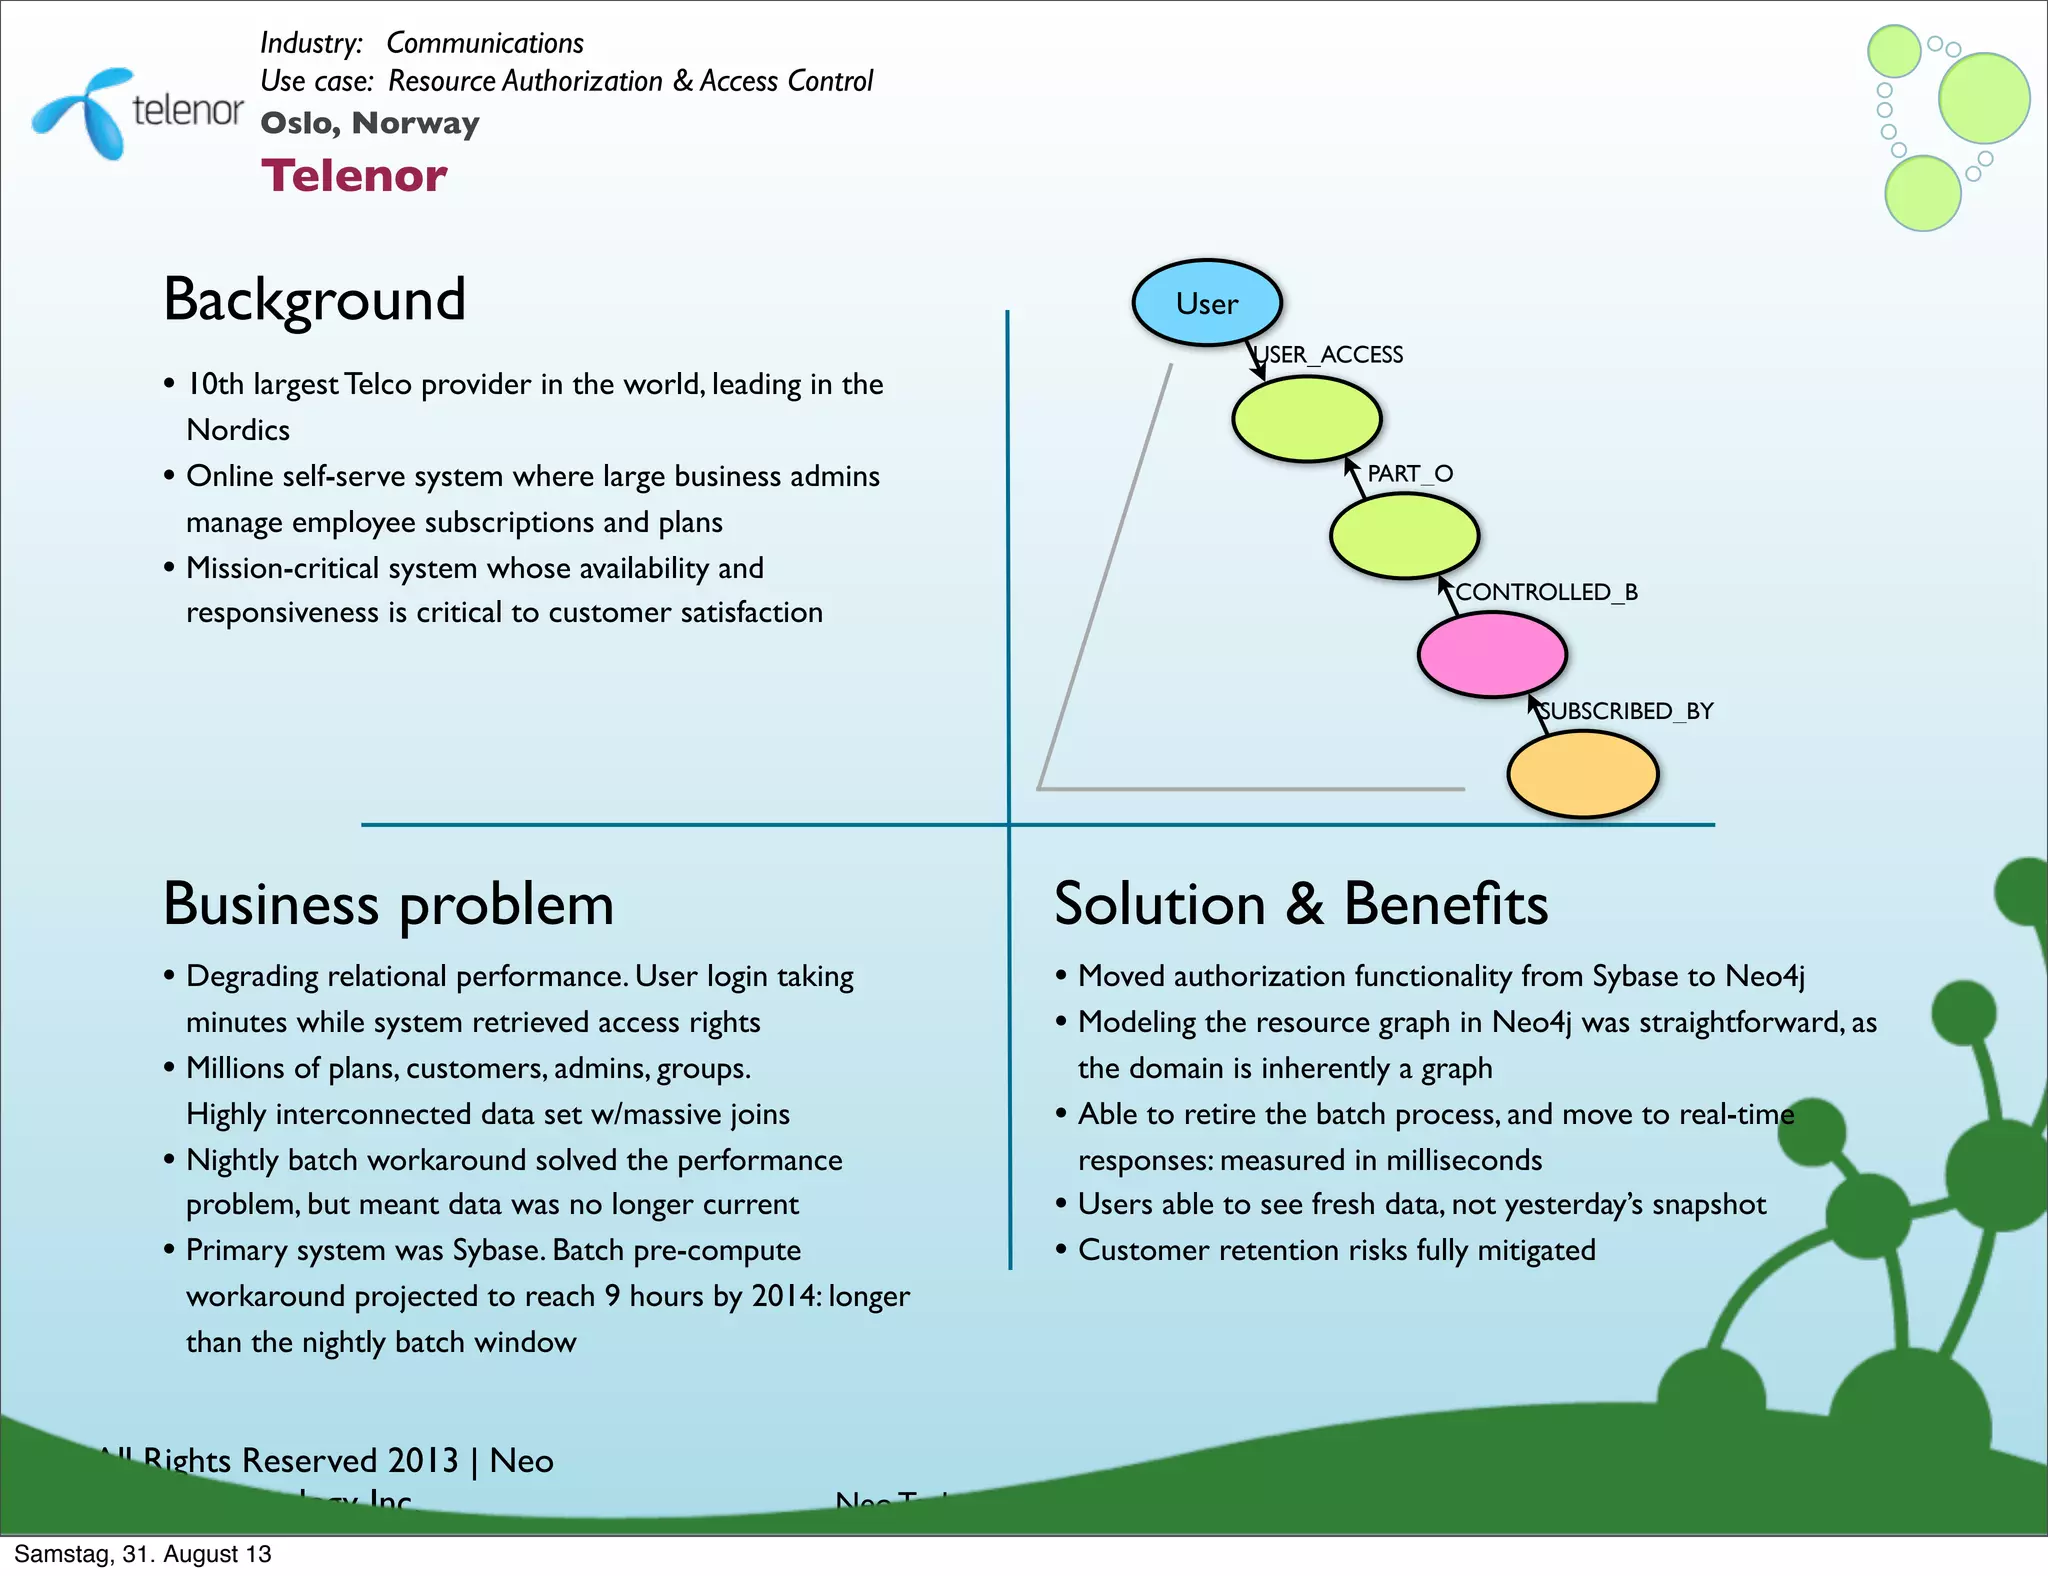
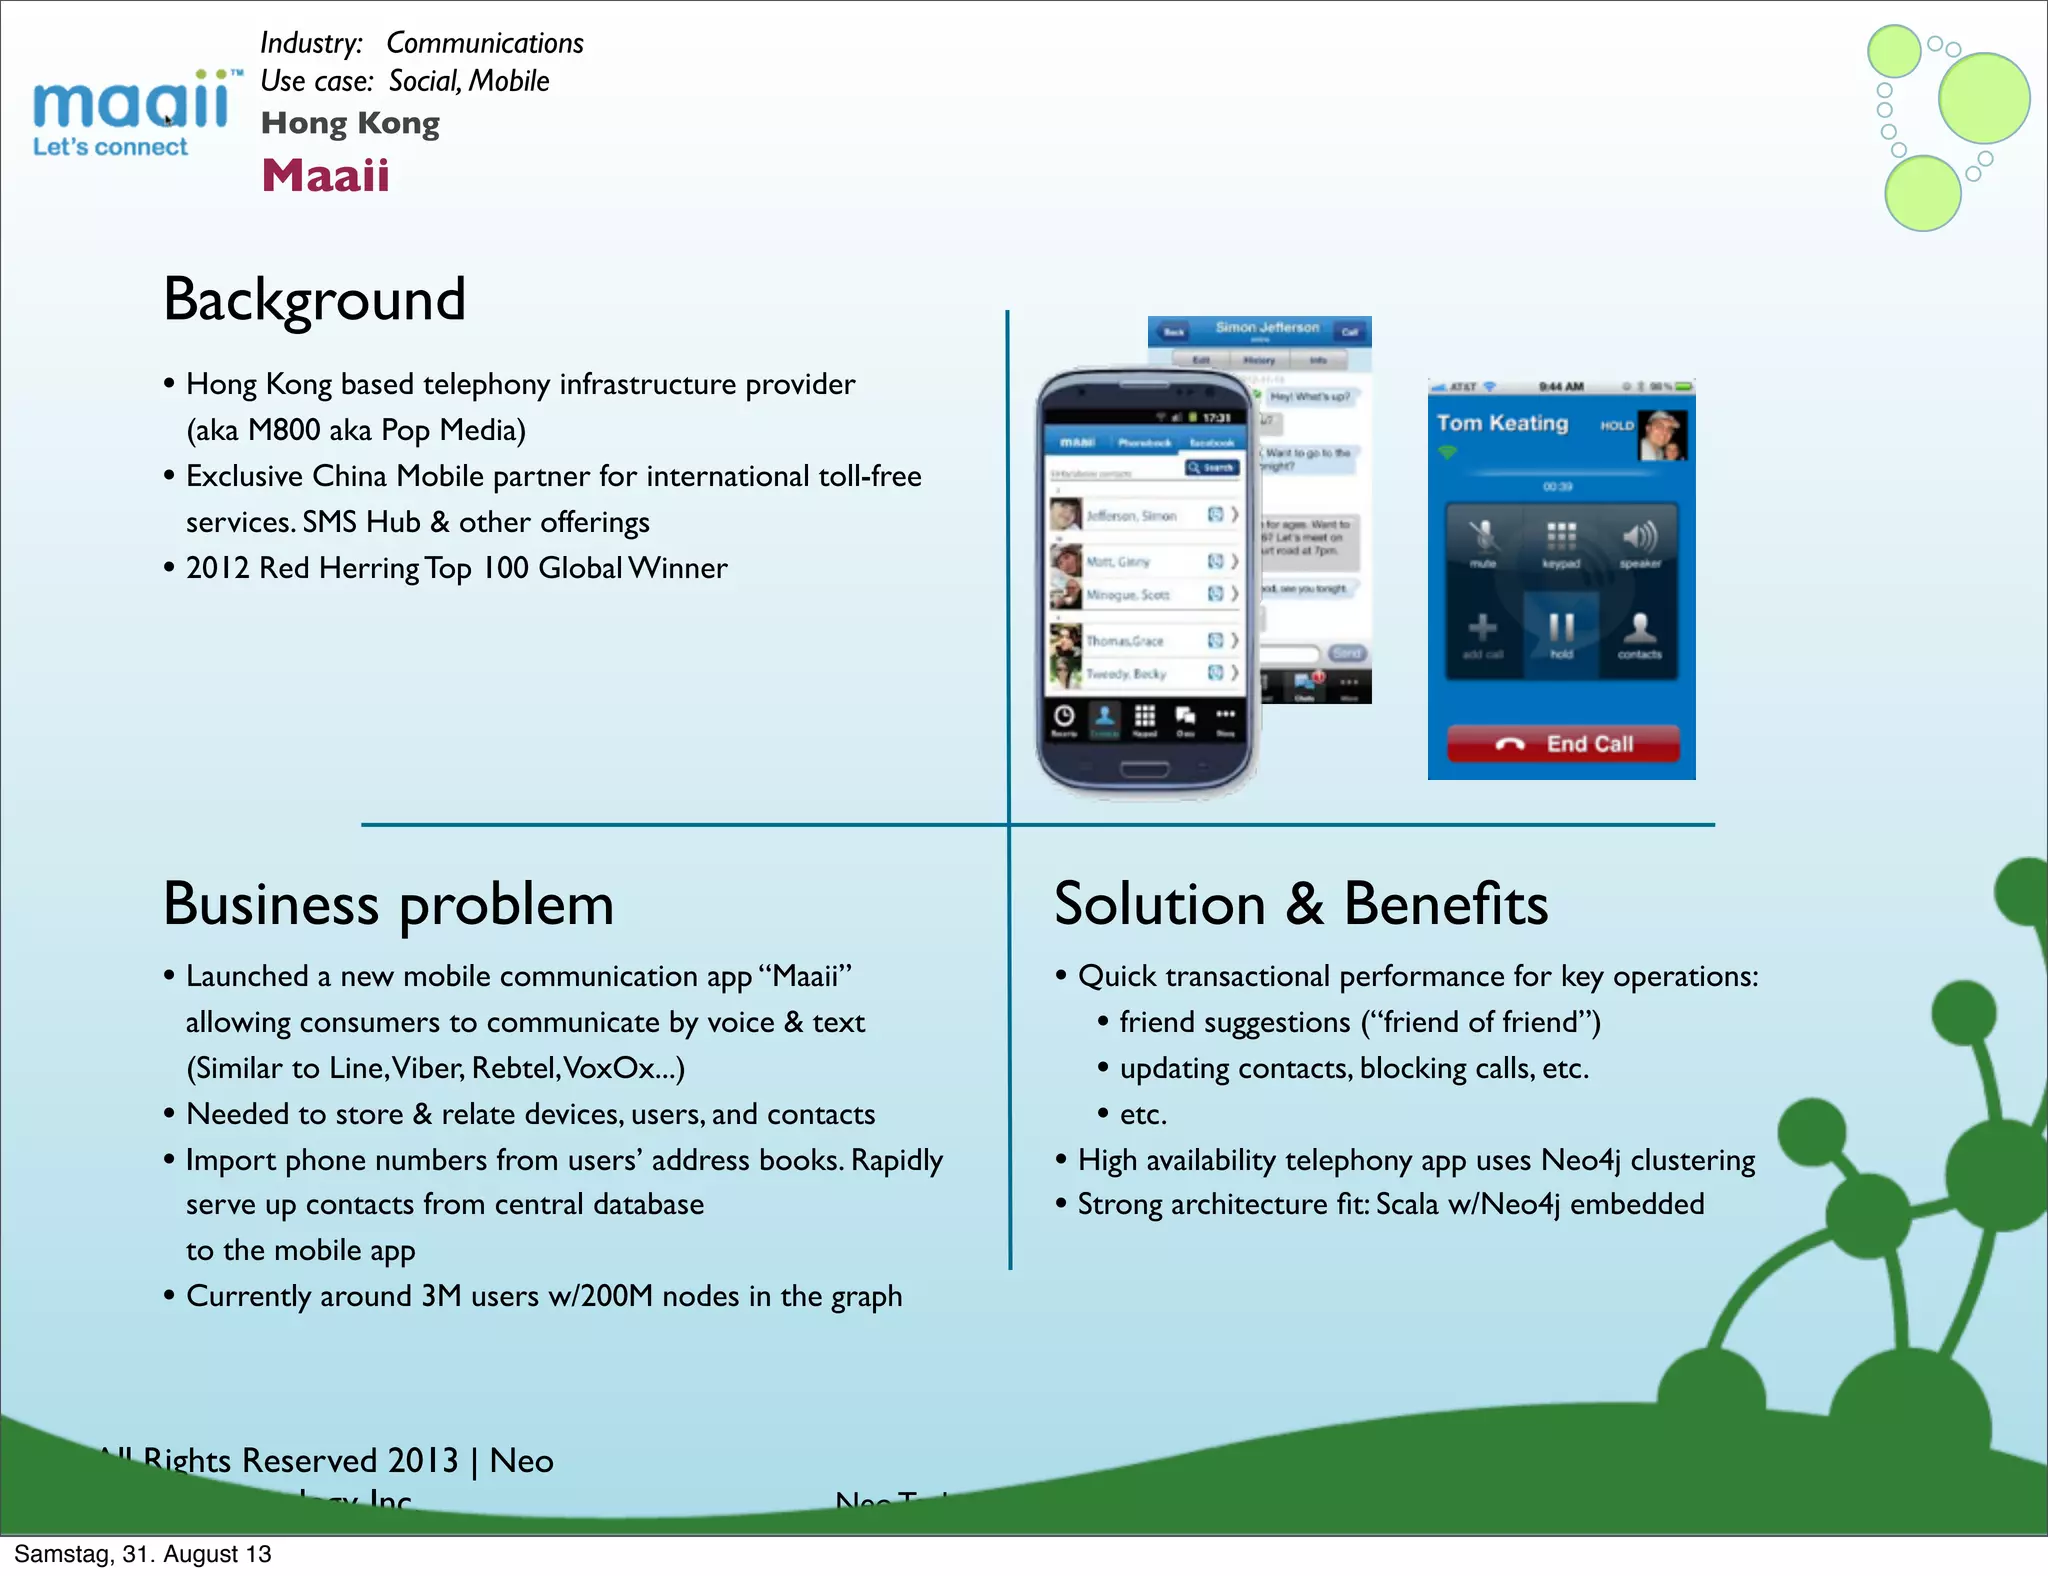
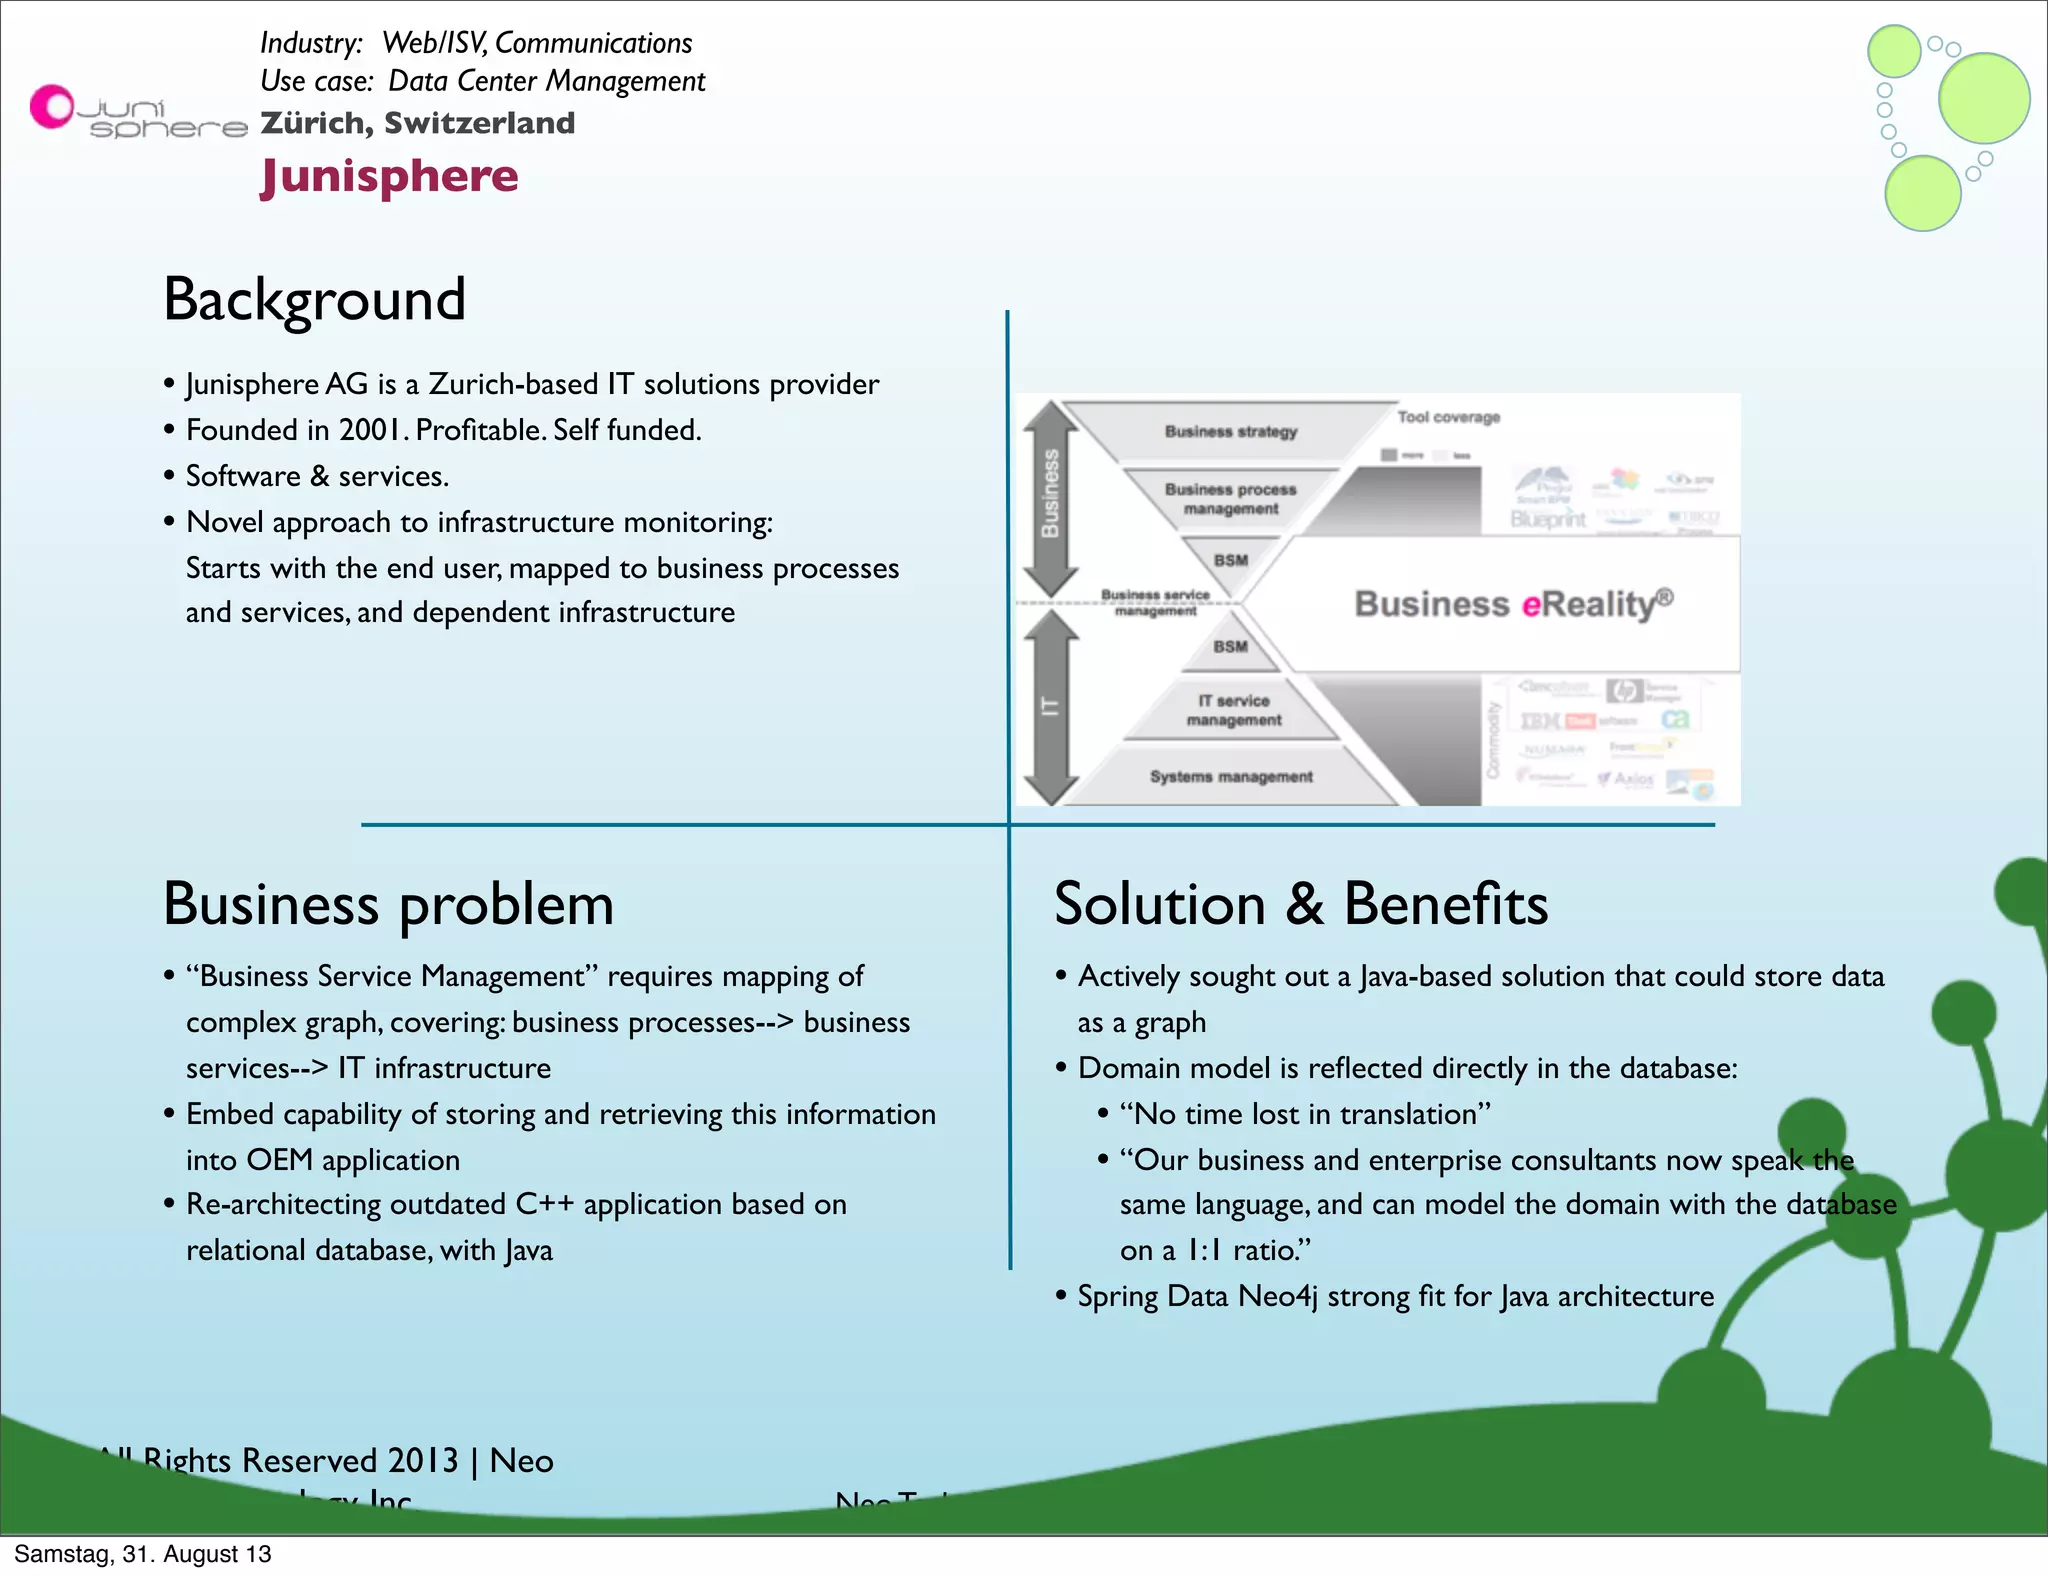
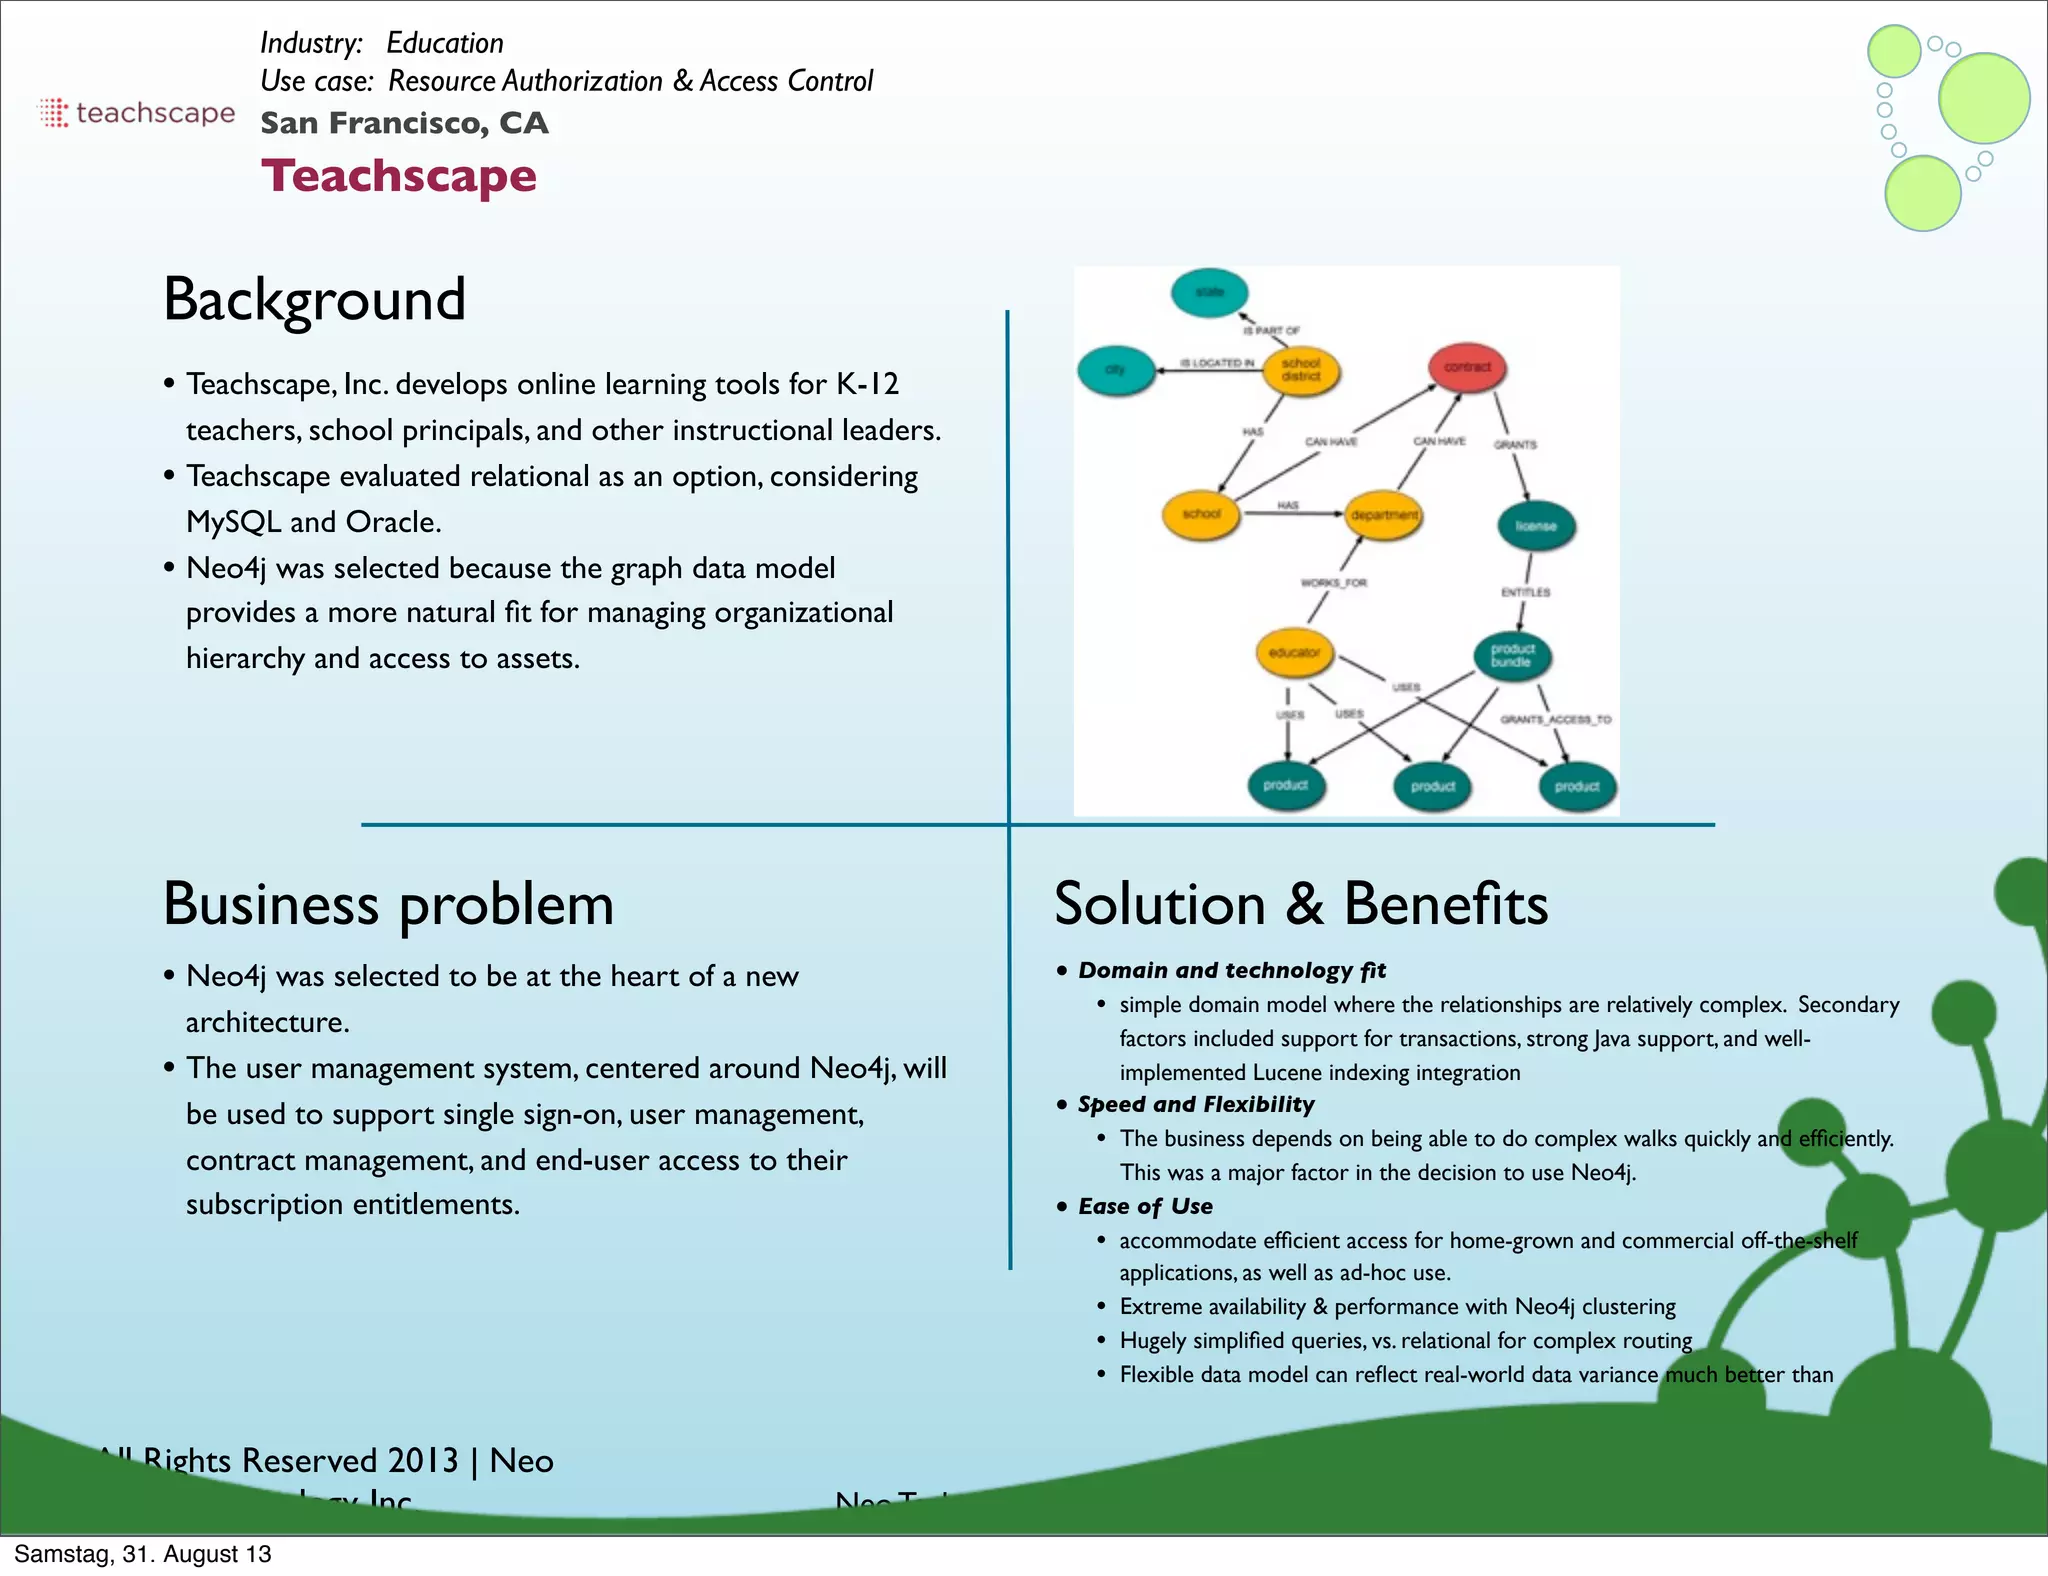
Examples of how organizations utilize graph databases to solve real business problems across industries.
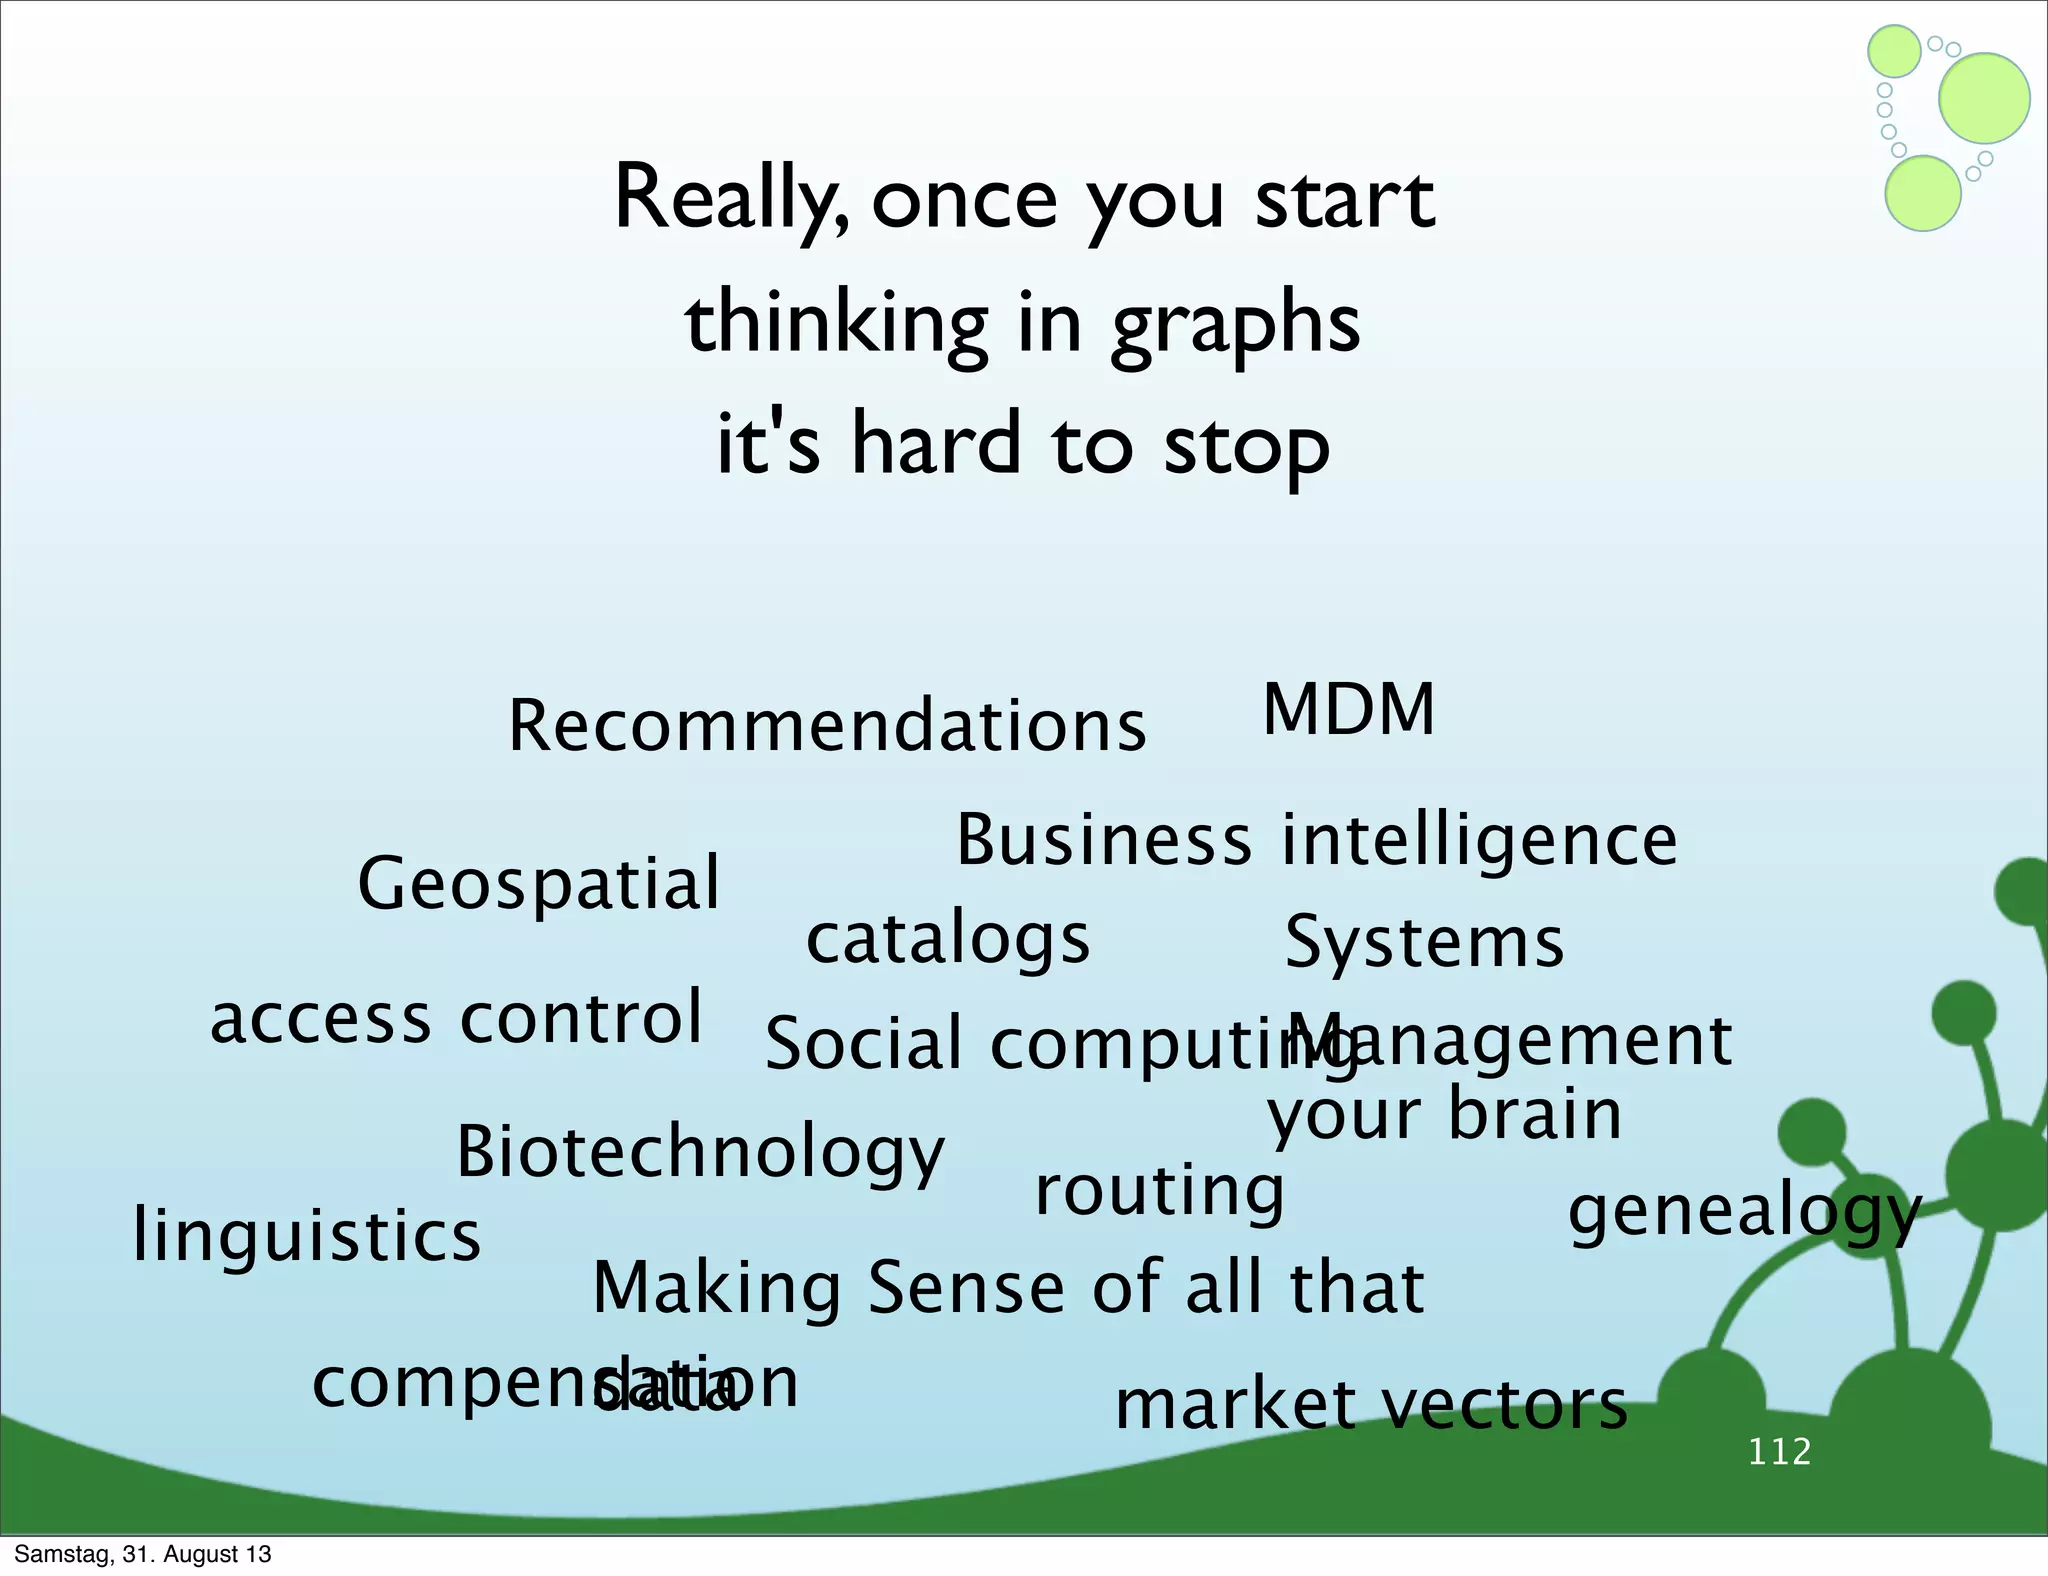
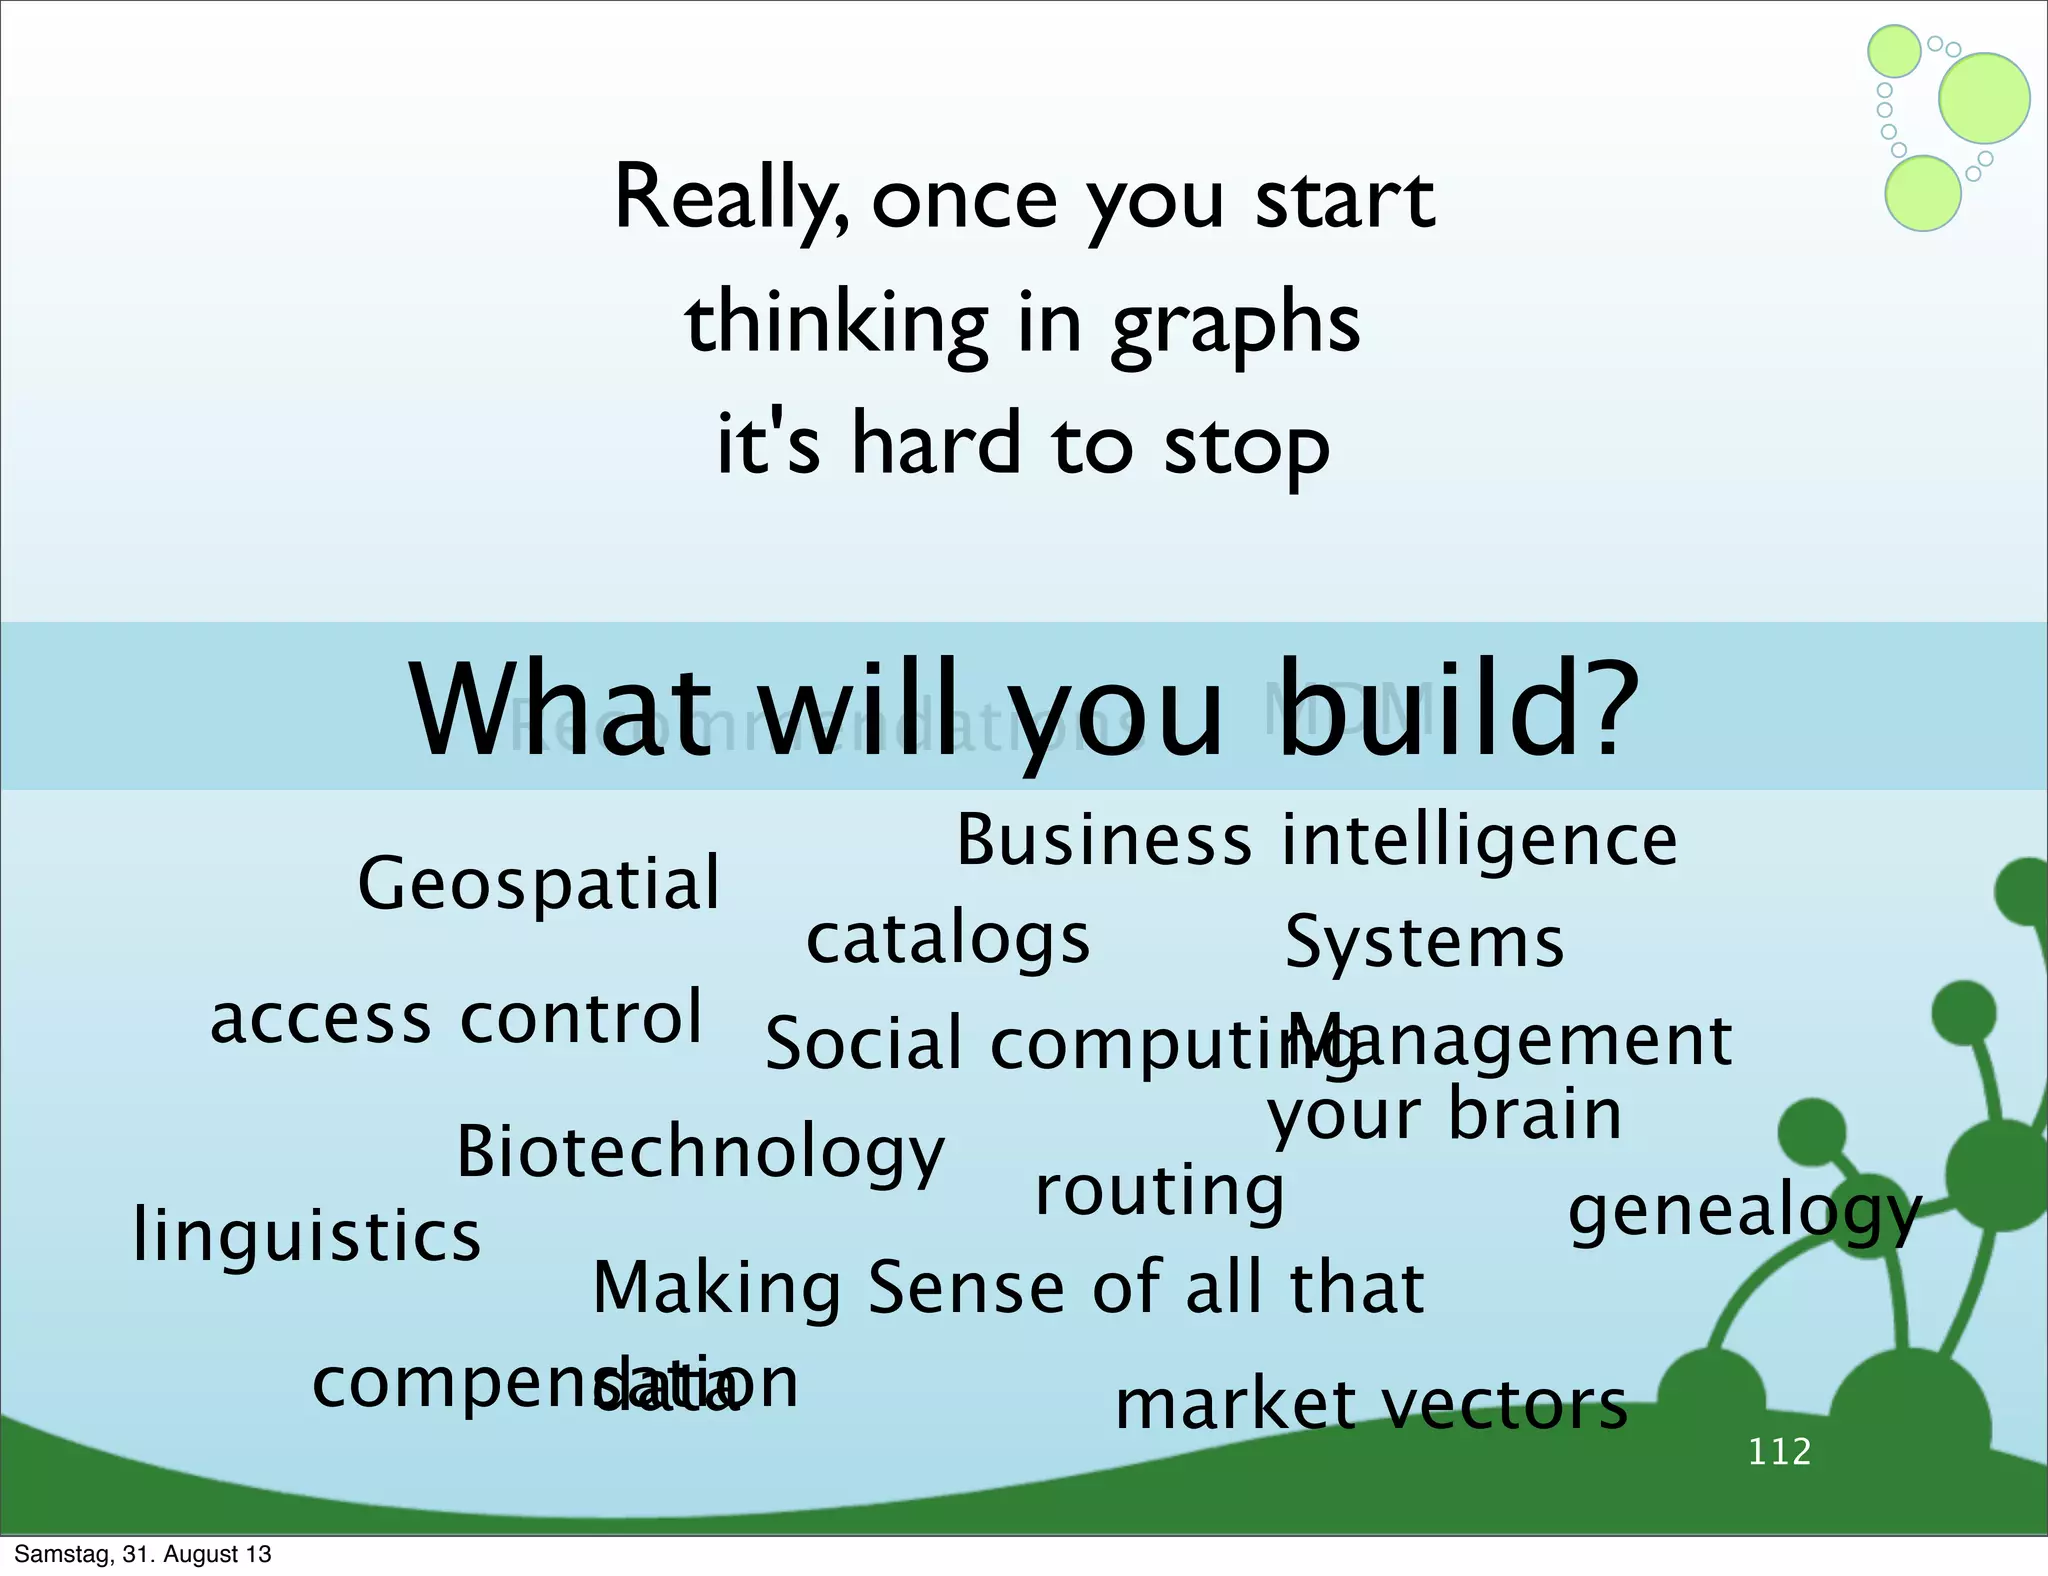
Encouragement to adopt graph thinking for various applications, highlighting graph databases as a potent data management solution.